



VGT Price
Data as of August 7, 2026
| Metric | Value |
|---|---|
| Price | ~$119–120 |
| NAV | $120.10 |
| Day’s Range | $117.87–$120.53 |
| 52-Week Range | $83.09–$126.00 |
| YTD Total Return | 27.80% |
| Net Assets (AUM) | ~$169B |
| Expense Ratio (net) | 0.09% |
| Dividend Yield (TTM) | 0.36% |
| Average Volume | ~4.9M shares |
| Inception Date | January 26, 2004 |
Figures sourced from Yahoo Finance and Google Finance intraday/closing data. Given normal daily price movement, treat the price and day’s-range figures as a snapshot, not a live quote — link to a real-time source or embed a live widget if this needs to stay accurate between manual updates.
Executive Summary: VGT Price Overview & Key Metrics
The Vanguard Information Technology ETF (VGT) is a passively managed, sector-focused fund tracking the technology segment of the US stock market. It holds roughly 320 companies spanning semiconductors, enterprise software, cloud infrastructure, and hardware, but its return profile is driven overwhelmingly by a small handful of mega-cap names — Nvidia, Apple, and Microsoft alone account for roughly 40–43% of the fund’s assets.
VGT completed an 8-for-1 stock split on April 21, 2026, which is why its per-share price today (roughly $119–120) looks dramatically different from historical charts showing prices in the $600–800 range from earlier in 2026 — the split changed the share price and share count, not the value of anyone’s holding.
Vanguard Information Technology ETF Live Market Price, NAV & Volume

VGT trades on NYSE Arca under the ticker VGT. Its NAV (net asset value) — the per-share value of the fund’s underlying holdings — closely tracks its market price throughout the trading day, since VGT is a highly liquid ETF with tight, efficient arbitrage between the two. As of the data snapshot above, NAV sat at $120.10 against a closing market price in the same range, with average daily volume of roughly 4.9 million shares — enough liquidity that bid-ask spreads stay tight for both small retail orders and larger institutional trades.
VGT Top Holdings: Weight Percentage & Concentration (NVDA, AAPL, MSFT)
| Rank | Holding | Approx. Weight |
|---|---|---|
| 1 | NVIDIA (NVDA) | ~17–18.6% |
| 2 | Apple (AAPL) | ~14.3–15% |
| 3 | Microsoft (MSFT) | ~10–10.9% |
| 4 | Broadcom (AVGO) | ~4–4.6% |
| 5 | Micron Technology (MU) | ~2.6–5% |
Weights vary slightly by data provider and reporting date; treat this table as directional, not exact, and refresh from Vanguard’s own factsheet before publishing.
The top three holdings alone typically represent roughly 40–43% of total fund assets, and the top ten combined run close to 60%. VGT’s benchmark index permits this level of concentration, so the fund’s short-term performance is disproportionately tied to earnings and guidance from a handful of companies — when Nvidia or Apple moves sharply on an earnings print, VGT tends to move with it regardless of how the other ~315 holdings perform.
VGT vs. XLK vs. FTEC: Expense Ratio & Total Return Comparison

| Metric | VGT | XLK | FTEC |
|---|---|---|---|
| Expense Ratio | 0.09% | 0.08% | ~0.084% |
| Holdings | ~320 | ~70–75 | ~300 |
| Benchmark | MSCI US IMI Information Technology 25/50 | S&P Technology Select Sector | MSCI USA IMI Information Technology |
| Dividend Yield (approx.) | 0.36–0.42% | 0.42–0.56% | 0.37–0.42% |
| Approach | Broad tech, including mid/small-cap | Concentrated, S&P 500 tech names only | Broad tech, similar to VGT |
All three funds are low-cost by industry standards, and the expense ratio gap between them (roughly 1 basis point) is negligible on most account sizes. The more meaningful difference is breadth: XLK is limited to technology companies within the S&P 500, giving it a more concentrated, mega-cap-heavy portfolio, while VGT and FTEC extend further down into mid- and small-cap technology names. In practice, all three are highly correlated (typically 0.96–0.99) since they’re dominated by the same handful of mega-cap holdings — combining more than one adds limited diversification benefit.
VGT Dividend Yield, Annual Distribution & Payout Schedule
VGT pays dividends quarterly, reflecting income passed through from its underlying holdings rather than a fixed payout target. Trailing twelve-month yield sits in the 0.36–0.43% range depending on the measurement window — low by broad-market standards, since growth-oriented technology companies typically reinvest earnings rather than distribute them as dividends. The most recent ex-dividend date was June 24, 2026, consistent with VGT’s regular quarterly (March, June, September, December) distribution cycle.
Because yield is low relative to price, VGT’s total return is driven almost entirely by price appreciation rather than income — a materially different profile from a dividend-focused fund.
VGT 52-Week Price Range & Historical Growth
Comparison Table: 1, 5, and 10-Year Compound Growth
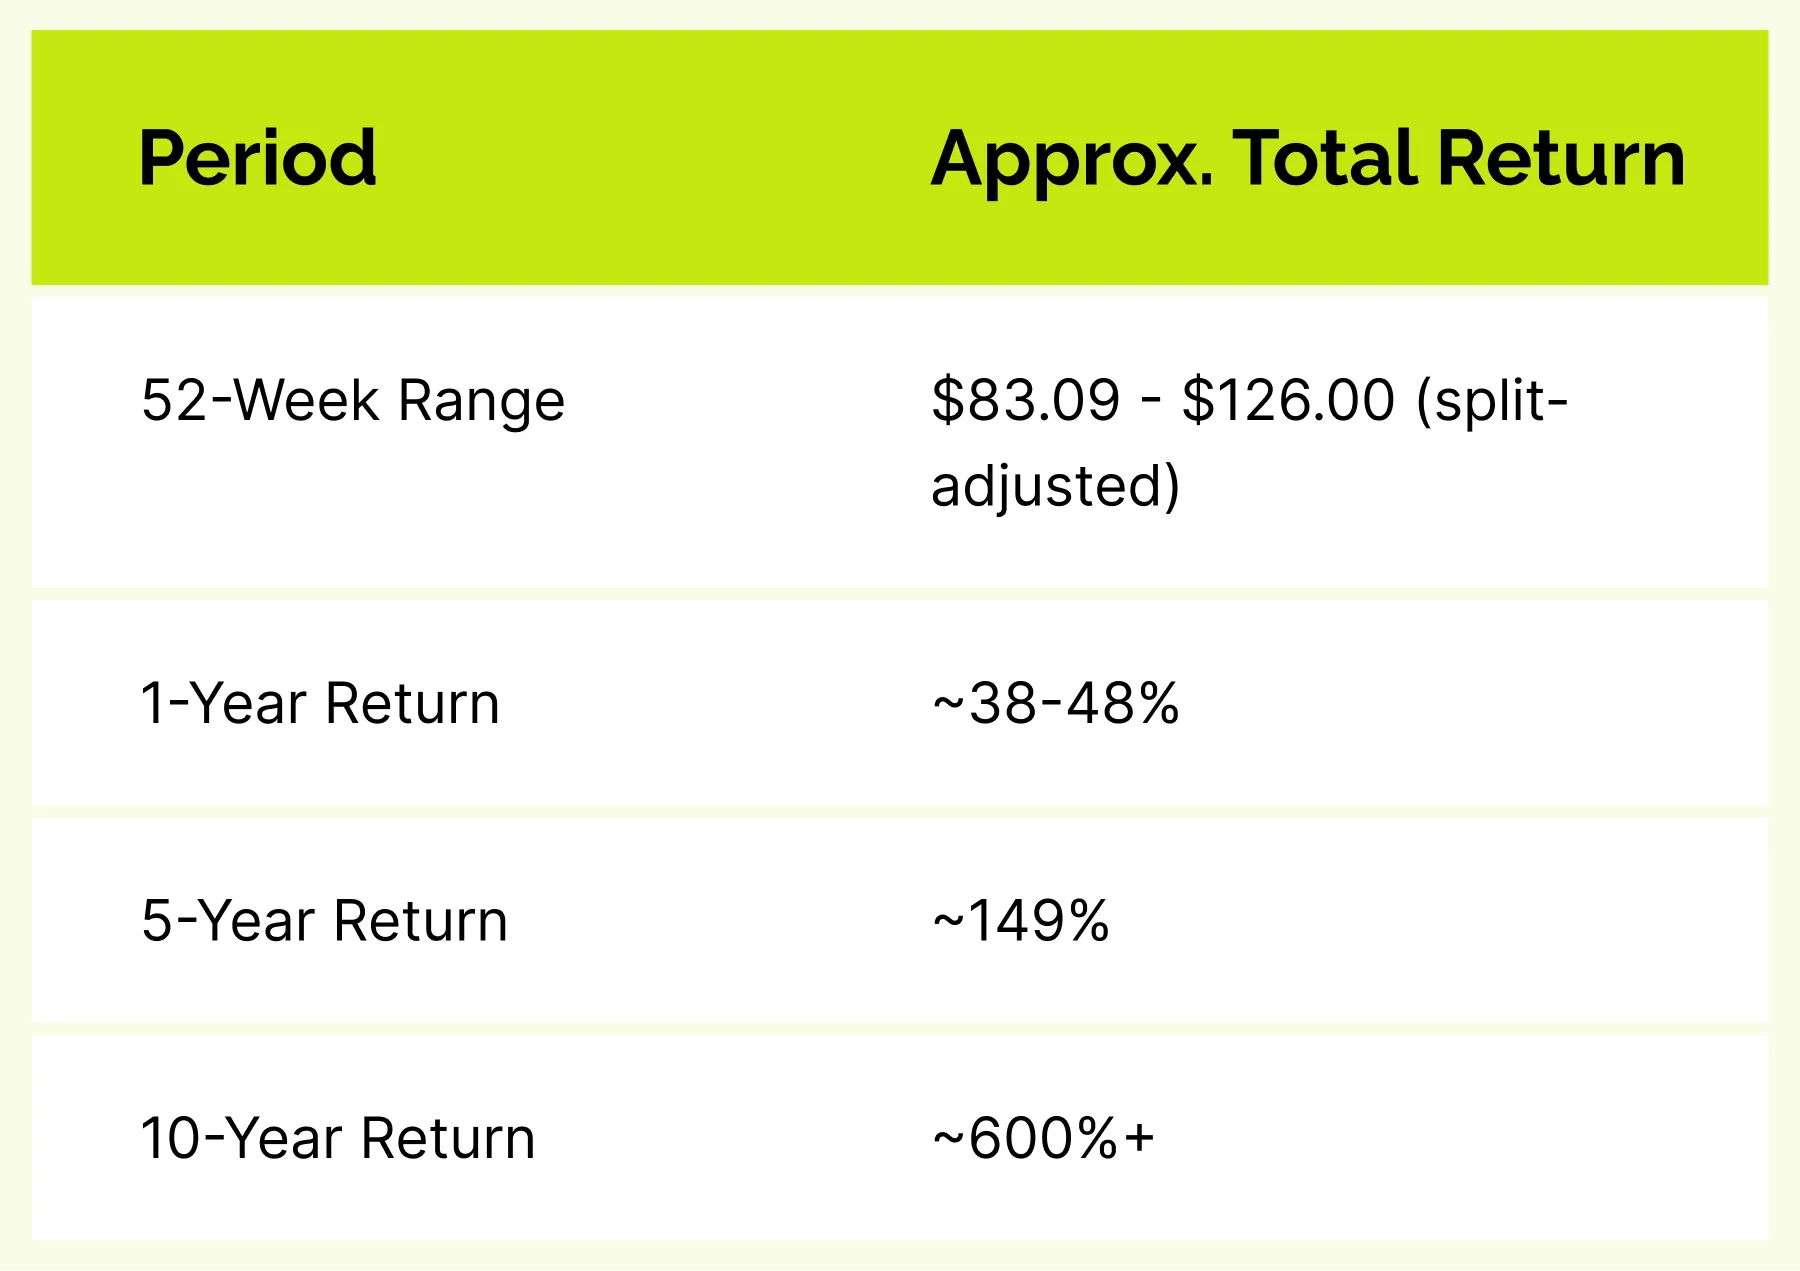
VGT’s long-term growth has been driven substantially by the same concentration that defines its current holdings — a decade-long run in mega-cap technology, and specifically the AI infrastructure buildout of the past several years, has disproportionately benefited its largest positions. This is worth reading alongside the concentration figures above: the fund’s historical growth and its current risk profile are two sides of the same structural feature, not independent facts.
VGT Stock Split History, Ratios & Execution Dates
VGT has completed one stock split in its history: an 8-for-1 split, announced March 24, 2026, and executed April 21, 2026. Every shareholder’s position value was unaffected — holders received 8 shares for every 1 they held previously, and the per-share price dropped proportionally (from roughly $950–960 pre-split to roughly $119–120 post-split). The split did not change the fund’s expense ratio, holdings, or strategy in any way; it was purely a mechanical adjustment aimed at making shares more accessible to investors without fractional-share access.
Vanguard executed similar splits on several other growth-oriented ETFs (including VUG at 6-for-1 and MGK at 5-for-1) around the same date, all for the same stated reason.
VGT Benchmark Index: MSCI US IMI Information Technology 25/50

VGT tracks the MSCI US Investable Market Information Technology 25/50 Index, a market-cap-weighted benchmark covering large-, mid-, and small-cap US companies classified under the Global Industry Classification Standard (GICS) information technology sector — spanning software, semiconductors, IT services, communications equipment, and technology hardware. The “25/50” in the index name refers to diversification caps applied at the index level (no single holding may exceed 25% of the index, and the sum of holdings above 5% may not exceed 50%), though these caps still permit the level of top-heavy concentration VGT currently shows.
VGT is a passively managed, full-replication (or sampling, where regulatory constraints require it) fund — it aims to hold each constituent in approximately the same proportion as the index itself, rather than making active bets on individual stocks.
VGT vs. VOO: Tech Sector Focus vs. Broad Market Portfolio
VOO (Vanguard S&P 500 ETF) and VGT serve fundamentally different roles. VOO holds all 500 S&P 500 companies across every sector, with technology representing roughly 30–35% of the fund — meaning VOO already carries meaningful tech exposure without being a sector bet. VGT is 100% concentrated in technology, carries a materially higher beta (around 1.4 versus VOO’s 1.0), and has historically shown wider drawdowns during tech-specific downturns.
The two funds also overlap directly: VGT and VOO currently share several of the same top holdings (Apple, Microsoft, Nvidia, Broadcom among them), so holding both doesn’t fully diversify away from mega-cap tech concentration — it amplifies it. A portfolio combining VOO and VGT pushes combined technology and communication-services exposure meaningfully higher than either fund alone, which is worth understanding before treating the pair as complementary rather than overlapping.
VGT Valuation Metrics: Trailing & Forward P/E Ratios
VGT’s trailing P/E ratio has recently sat in the high-30s to low-40s range, reflecting the growth-stock premium embedded in its largest holdings — a meaningfully higher multiple than a broad-market fund like VOO, which trades closer to the S&P 500’s long-run average. This isn’t unusual for a sector fund concentrated in software and semiconductor names, where the market has historically priced in expectations for continued earnings growth well beyond what a traditional valuation multiple alone would suggest.
P/E figures for index funds move with both price and the underlying companies’ trailing earnings, so treat any specific multiple cited here as a point-in-time figure rather than a fixed characteristic of the fund.
VGT Fund Assets Under Management, Daily Volume & Liquidity
VGT is one of the largest sector-specific ETFs on the market, with net assets in the range of $150–170 billion depending on the measurement date — meaningfully larger than comparable funds like FTEC (roughly $18 billion). Average daily trading volume in the millions of shares keeps bid-ask spreads tight, which matters for cost efficiency whether trading a small position or a large institutional block.
Fund size and liquidity aren’t the same thing as performance, but they do reduce the practical friction of getting in and out of a position — a meaningful consideration for active traders using VGT tactically rather than holding it long-term.
Why Choose Bookmap to Track and Trade VGT & Technology Stocks
Headline price and NAV numbers tell you where VGT closed — they don’t tell you what’s happening in the order book as that price forms. Given how concentrated VGT is in a handful of mega-cap names, moves in the fund are often driven by order flow in the underlying stocks themselves (Nvidia, Apple, Microsoft) well before that activity shows up in VGT’s own quote.
Bookmap’s order flow strategies tools — heatmaps, volume-based signals, and depth-of-market visualization — apply directly to trading concentrated, high-beta sector ETFs like VGT, where liquidity and large-order activity in the top holdings often lead the fund’s own price action. For a fuller comparison of this approach against traditional charting, see Bookmap’s guide to technical analysis vs. order flow.
Bookmap Pricing & Platform Access Options

Bookmap offers tiered subscription plans depending on the markets and level of order flow detail a trader needs — from a free tier for basic charting up to Global and Global+ packages that unlock full-depth market-by-order data, custom heatmap filters, and advanced liquidity tools. Compare current plans and pricing directly, since packages and features are updated periodically.
5 Strategic Steps for Trading VGT Price Volatility
- Understand what’s actually moving the fund. Given VGT’s concentration, check whether a move is broad-based (real sector sentiment) or driven by a single top holding’s earnings or guidance.
- Watch the order book in the top three holdings, not just VGT’s own quote. Nvidia, Apple, and Microsoft order flow frequently leads VGT’s price action rather than following it.
- Size positions for VGT’s actual volatility, not a broad-market assumption. A beta near 1.4 means VGT swings meaningfully more than the S&P 500 in both directions.
- Separate the split from the signal. Following the April 2026 split, compare performance and valuation metrics on a split-adjusted basis only — mixing pre- and post-split figures produces misleading conclusions.
- Check overlap before pairing with other funds. If VGT sits alongside VOO, QQQ, or an individual mega-cap tech holding in the same portfolio, confirm how much concentration is being stacked rather than diversified.
This is general educational framing, not investment advice — position sizing and risk tolerance are individual decisions, and Bookmap doesn’t provide personalized financial recommendations.
FAQ
What is VGT’s current price?
VGT trades in the range of roughly $119–120 as of early August 2026, following an 8-for-1 stock split executed on April 21, 2026. Always check a live quote before making any trading decision — a static article figure will be out of date within days.
Why did VGT’s stock price drop so much recently?
It didn’t lose value — it split 8-for-1 on April 21, 2026. Shareholders received 8 shares for every 1 they previously held, and the per-share price dropped proportionally from roughly $950–960 to roughly $119–120. Total position value was unaffected.
What are VGT’s top holdings?
VGT’s largest holdings are typically Nvidia, Apple, and Microsoft, together representing roughly 40–43% of the fund’s assets. The next several holdings — Broadcom, Micron, and others — add another 15–20%, bringing the top ten to roughly 60% of total assets.
How does VGT compare to XLK and FTEC?
All three are low-cost technology sector ETFs with expense ratios within about a basis point of each other. XLK is more concentrated, limited to S&P 500 technology names, while VGT and FTEC extend into mid- and small-cap tech stocks for broader sector exposure. Performance across all three is highly correlated since they share the same largest holdings.
What index does VGT track?
VGT tracks the MSCI US Investable Market Information Technology 25/50 Index, a market-cap-weighted benchmark of large-, mid-, and small-cap US technology companies.
Is VGT a good alternative to VOO?
They serve different purposes rather than being direct alternatives. VOO provides broad exposure across all S&P 500 sectors, with technology as one component among many. VGT is a concentrated, single-sector bet on technology. Combining both increases overall technology concentration rather than diversifying it, since the two funds share several top holdings.
What is VGT’s dividend yield?
VGT’s trailing twelve-month dividend yield is roughly 0.36–0.43%, paid quarterly. This is low relative to broad-market funds, reflecting the growth-stock, low-payout profile of its largest technology holdings.
How many holdings does VGT have?
VGT holds approximately 318–324 individual companies, though the top ten account for roughly 60% of total fund assets — meaning its effective diversification is much narrower than the raw holdings count suggests.