See when heavy volume confirms — and when it does not.
Compare plans to track absorption, continuation, and failed participation in real time.
Education
May 6, 2026
SHARE
Why Heavy Volume Does Not Always Mean Continuation
 Volume rarely tells the full story! Most traders interpret rising activity as a confirmation of market strength. They also associate participation with direction. However, this assumption begins to weaken when the price fails to respond as expected.
This gap between activity and outcome shows a deeper layer of market behavior. Not all volume drives continuation. In many cases, it reflects absorption, trapped positioning, or structural limits. As a result, relying only on visible activity can lead to misinterpretation.
A more refined approach examines how volume interacts with liquidity and price movement. And this relationship defines whether participation leads to expansion or resistance.
This article explains how volume trading continuation truly develops, why volume spikes fail, and how trading volume analysis combined with order flow volume signals reveals the difference between continuation and exhaustion.
Why Traders Associate Volume With Continuation
Usually, volume is the first tool most traders rely on in trading volume analysis. This is because it appears to offer a direct link between participation and price movement. Let’s understand the logic:
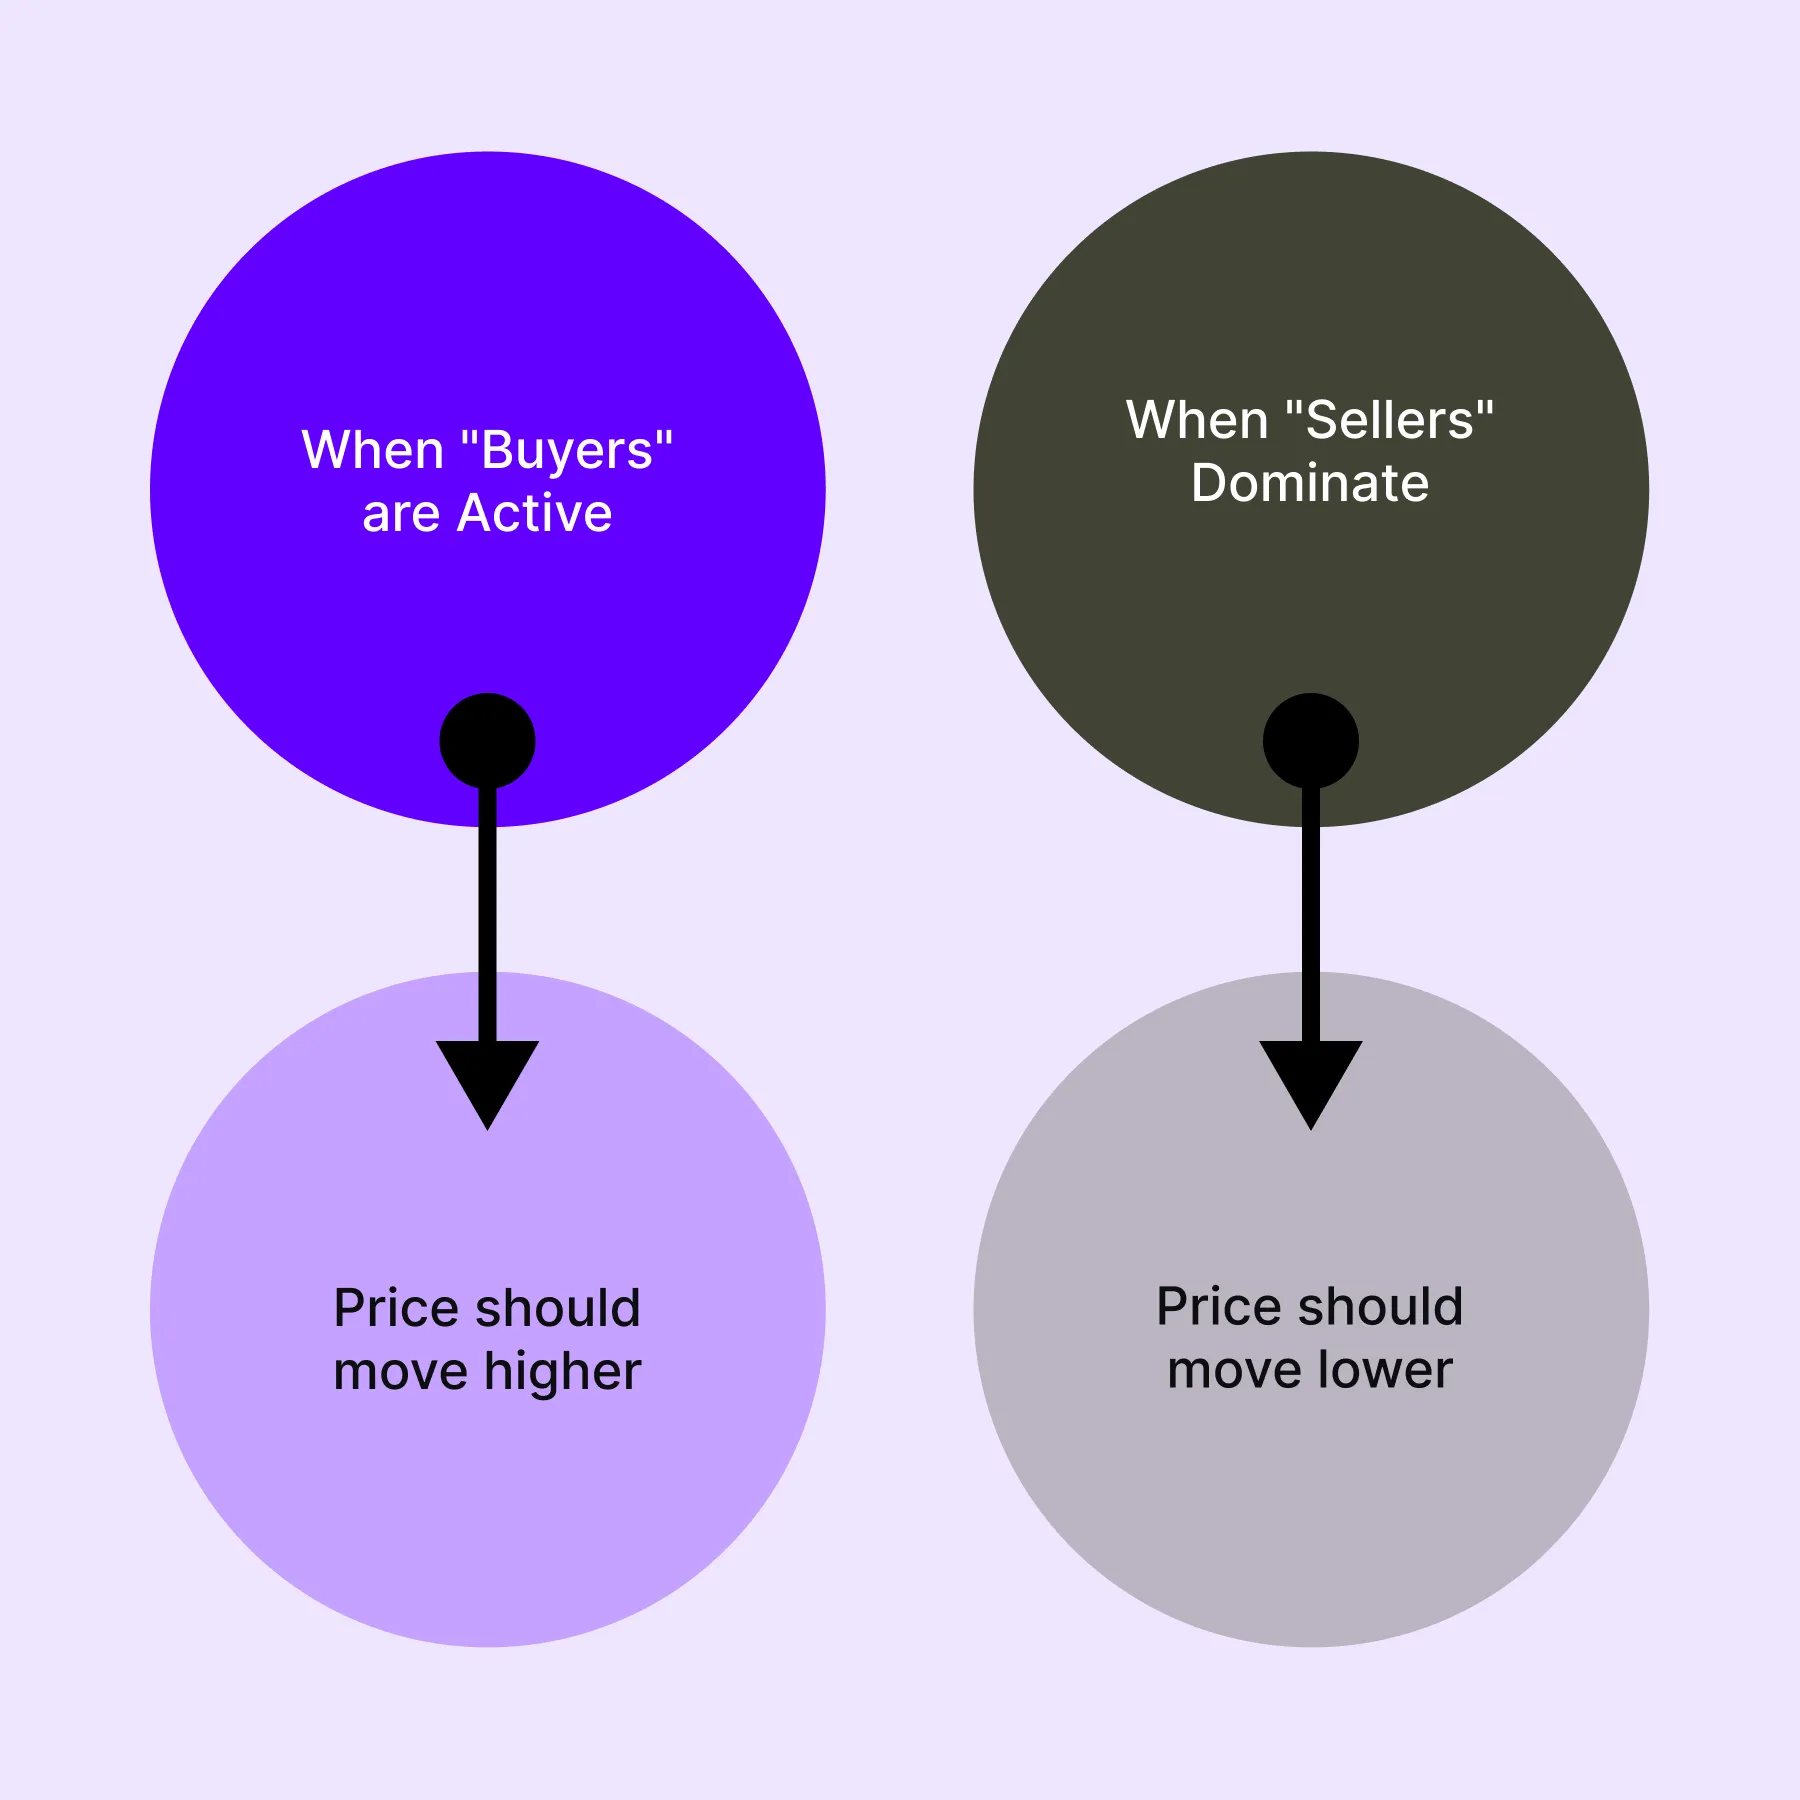
As a result, higher activity is commonly interpreted as stronger conviction. This forms the basic idea behind high-volume trading, indicating continuation. In some market conditions, this assumption does hold. Strong participation can support directional moves when there is little opposition.
However, this relationship begins to fail when liquidity and opposing interests are ignored. At its core, realise that volume only reflects that transactions have taken place. It does not reveal which side had control over those transactions.
For example, suppose there are two identical volume spikes. Now, they can represent different underlying conditions.
| Condition I | Condition II |
|
|
So, traders may observe from the above conditions that volume alone cannot confirm continuation. It must be evaluated in the context of liquidity, opposing interest, and how the price responds to that activity.
Analyze participation and liquidity behavior in real time → Compare Packages
Volume Shows Activity, Not Directional Control
Volume shows how many transactions take place in the market. However, it does not indicate who is in control of price movement. This distinction is usually overlooked in basic trading volume analysis, where activity is mistaken for direction.
Note that every transaction involves two participants, and each plays a different role:
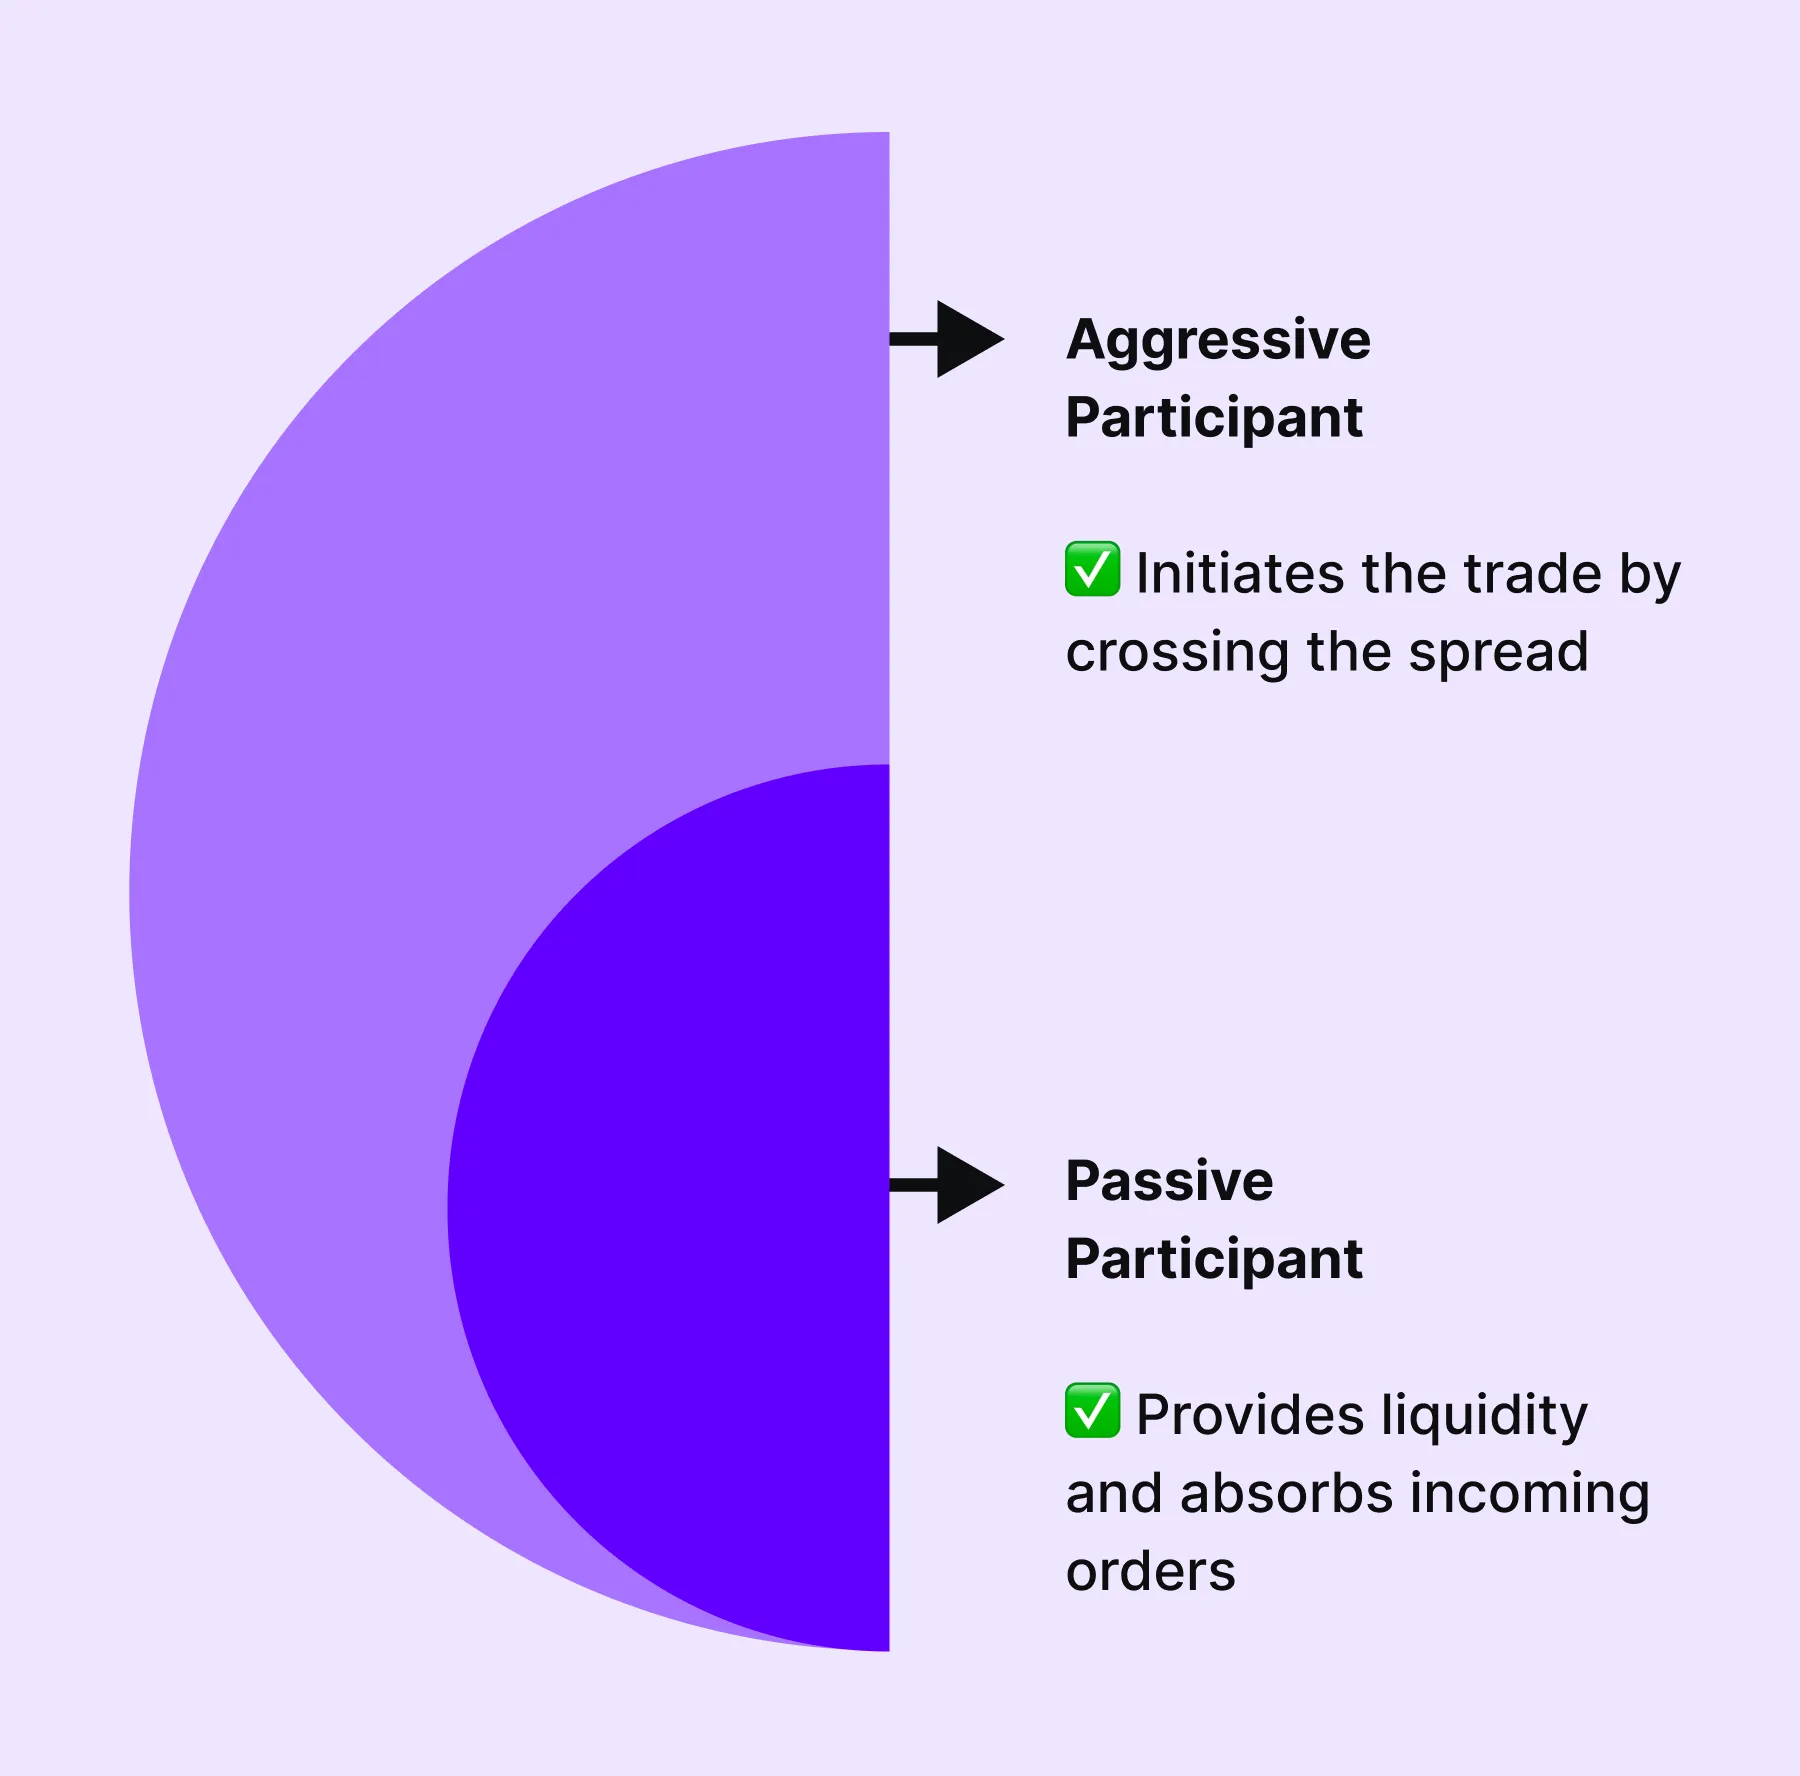
This interaction forms the foundation of order flow volume signals. While aggressive orders attempt to move the price, passive orders can either allow that movement or stop it.
Now, for the price to continue in one direction, aggressive participants must overpower the available liquidity. In such cases,
- Price moves with momentum, and
- Supports volume trading continuation.
However, this condition does not always hold. When sufficient liquidity exists on the opposite side, it can absorb the incoming aggression. As a result, the price fails to advance despite high activity.
This can be illustrated through a common market scenario:
| Market Observation | Interpretation |
| Price rallies with strong buying volume | Buyers appear active |
| Large passive sell orders sit above the price | Selling liquidity increases |
| Aggressive buying meets this liquidity. | Orders get absorbed |
| Heavy volume prints, but price stalls | No continuation occurs |
In the above scenario, at first, strong buying volume suggests control by buyers. However, despite high participation, the price does not continue higher. Thus, volume spikes fail when they encounter strong opposing liquidity.
Therefore, volume alone cannot confirm which side dominated the interaction. It only confirms that trading occurred.
When Heavy Volume Signals Continuation
Volume supports a move when it appears alongside structural expansion in price. In this case, activity is not only increasing, but also pushing the market into new areas where minor resistance exists. This is where volume trading continuation becomes visible in real market behavior.
Continuation develops when aggressive participation meets limited opposing liquidity. As a result, the price is able to travel further with each wave of activity. This relationship forms the core of volume vs price continuation.
For more clarity, let’s check out some signs that volume is supporting continuation:
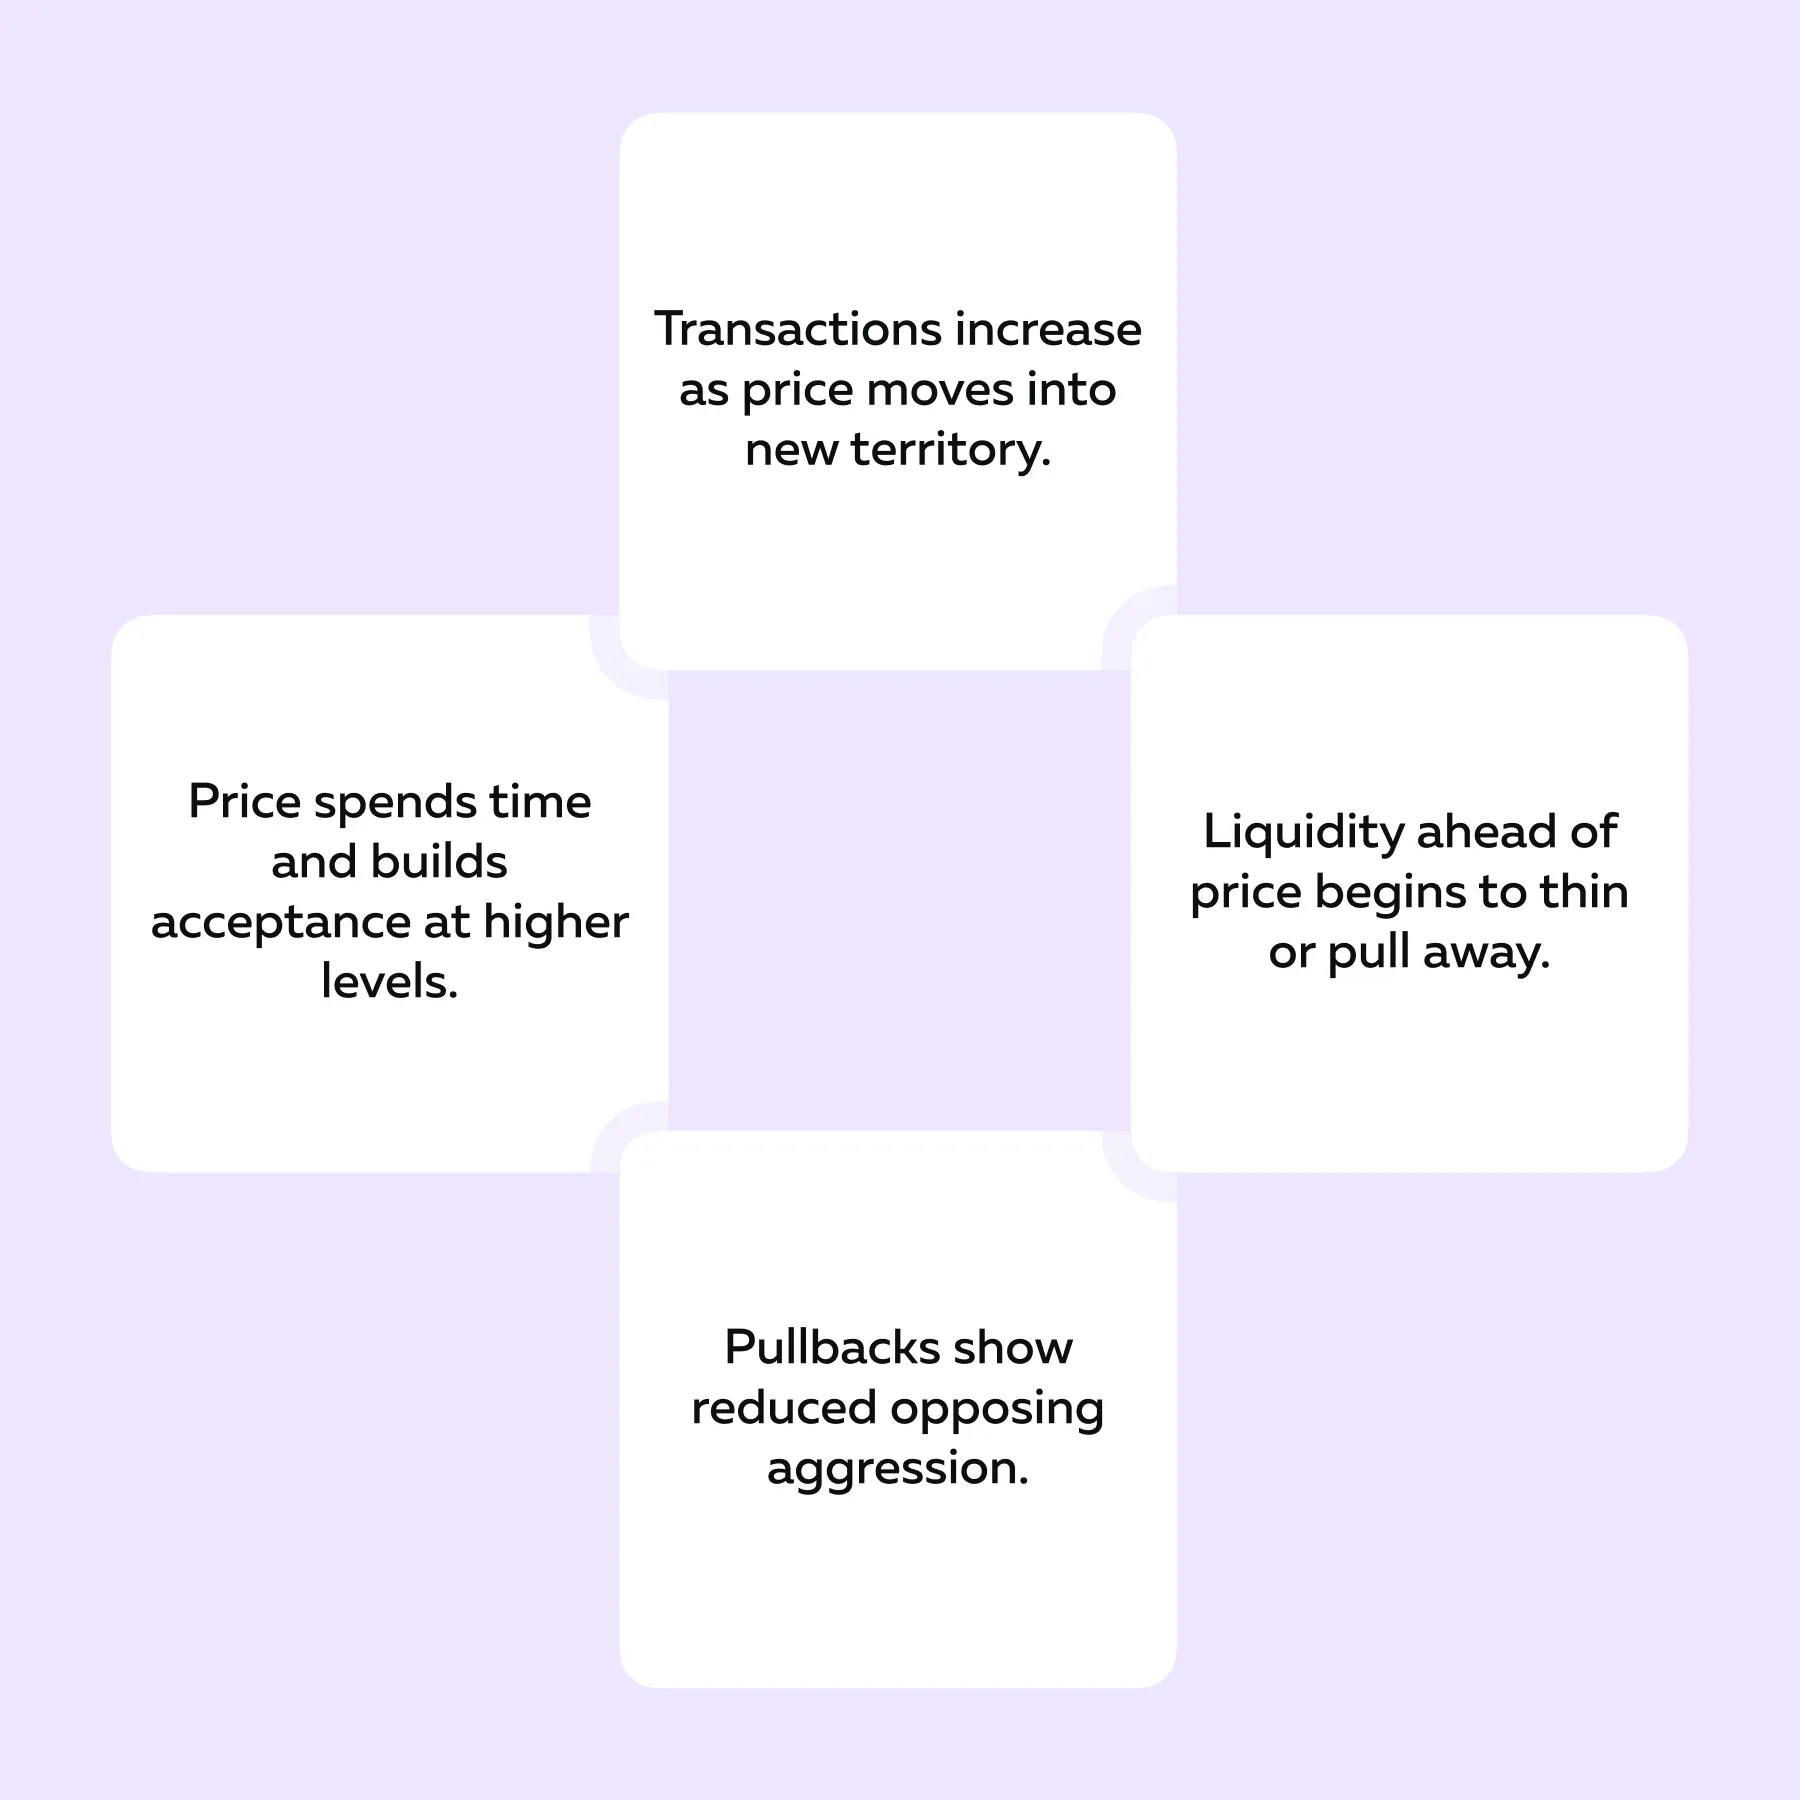
These conditions indicate that participation is driving expansion rather than being contained. Again, this can be illustrated through a simple scenario:
| Market Observation | Interpretation |
| Price breaks above resistance. | Market enters new territory. |
| Transaction volume increases. | Participation rises. |
| Liquidity above pulls away. | Resistance weakens. |
| Buyers continue lifting offers. | Aggression remains dominant. |
| Price holds above the breakout. | Acceptance forms. |
In this case, traders must note that activity supports price movement because there is not enough opposing liquidity to stop it. See how liquidity and transaction flow reveal whether volume supports continuation → Compare Packages
When Heavy Volume Signals Absorption Instead
Heavy volume can also appear when the market is absorbing aggressive activity. Here, high participation does not lead to expansion because passive participants provide strong resistance.
This occurs when aggressive traders “act with urgency,” but their orders are met by large resting liquidity. Instead of allowing the price to move, this liquidity absorbs the flow. These interactions are best interpreted through order flow volume signals. They may reveal the imbalance between aggression and resistance.
Now, let’s check out some common signs of absorption:
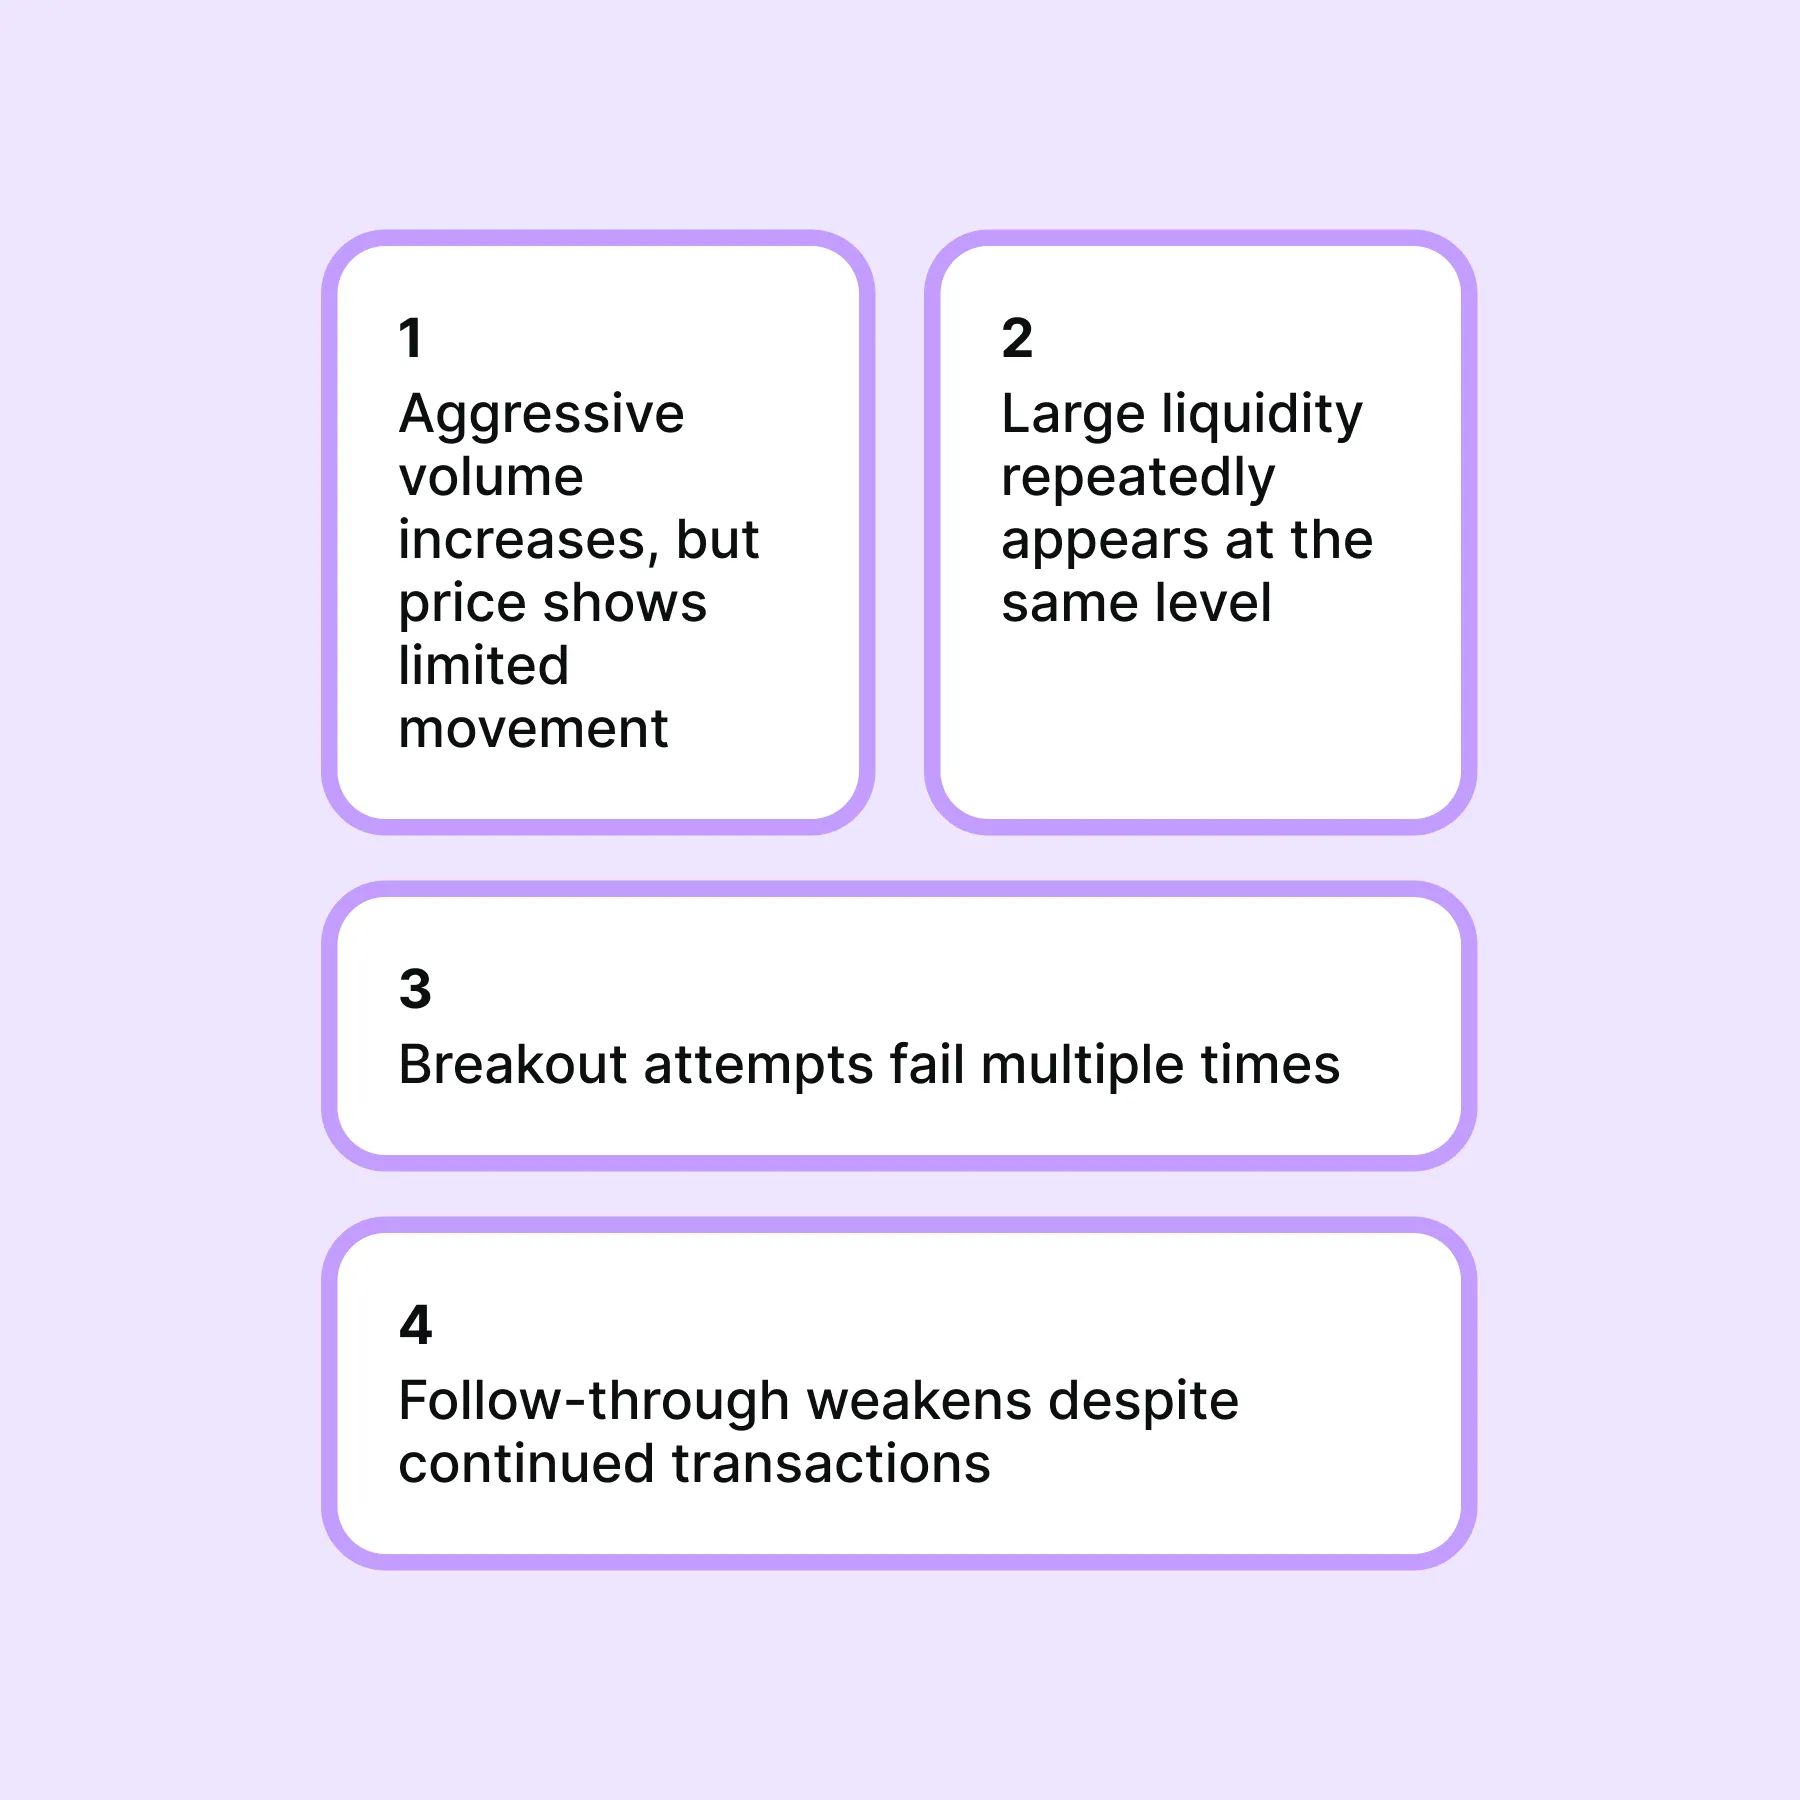
For a better understanding, let’s study an example:
- Price pushes higher with strong buying. This price increase indicates aggressive buyer participation.
- Volume spikes significantly and shows a sharp increase in market activity.
- Sell liquidity absorbs orders at a fixed level and creates strong resistance.
- Price fails to advance further. This suggests the move is being contained.
- Price begins rotating lower, which indicates a shift in control to sellers.
In this case, heavy volume does not signal continuation. Instead, it signals that the market has encountered strong opposing interest.
Therefore, while volume reflects activity, its meaning depends on context. Without considering liquidity and price response, trading volume analysis can misinterpret participation as continuation. (when in reality it was exhaustion or resistance).
The Role of Trapped Traders During High Volume
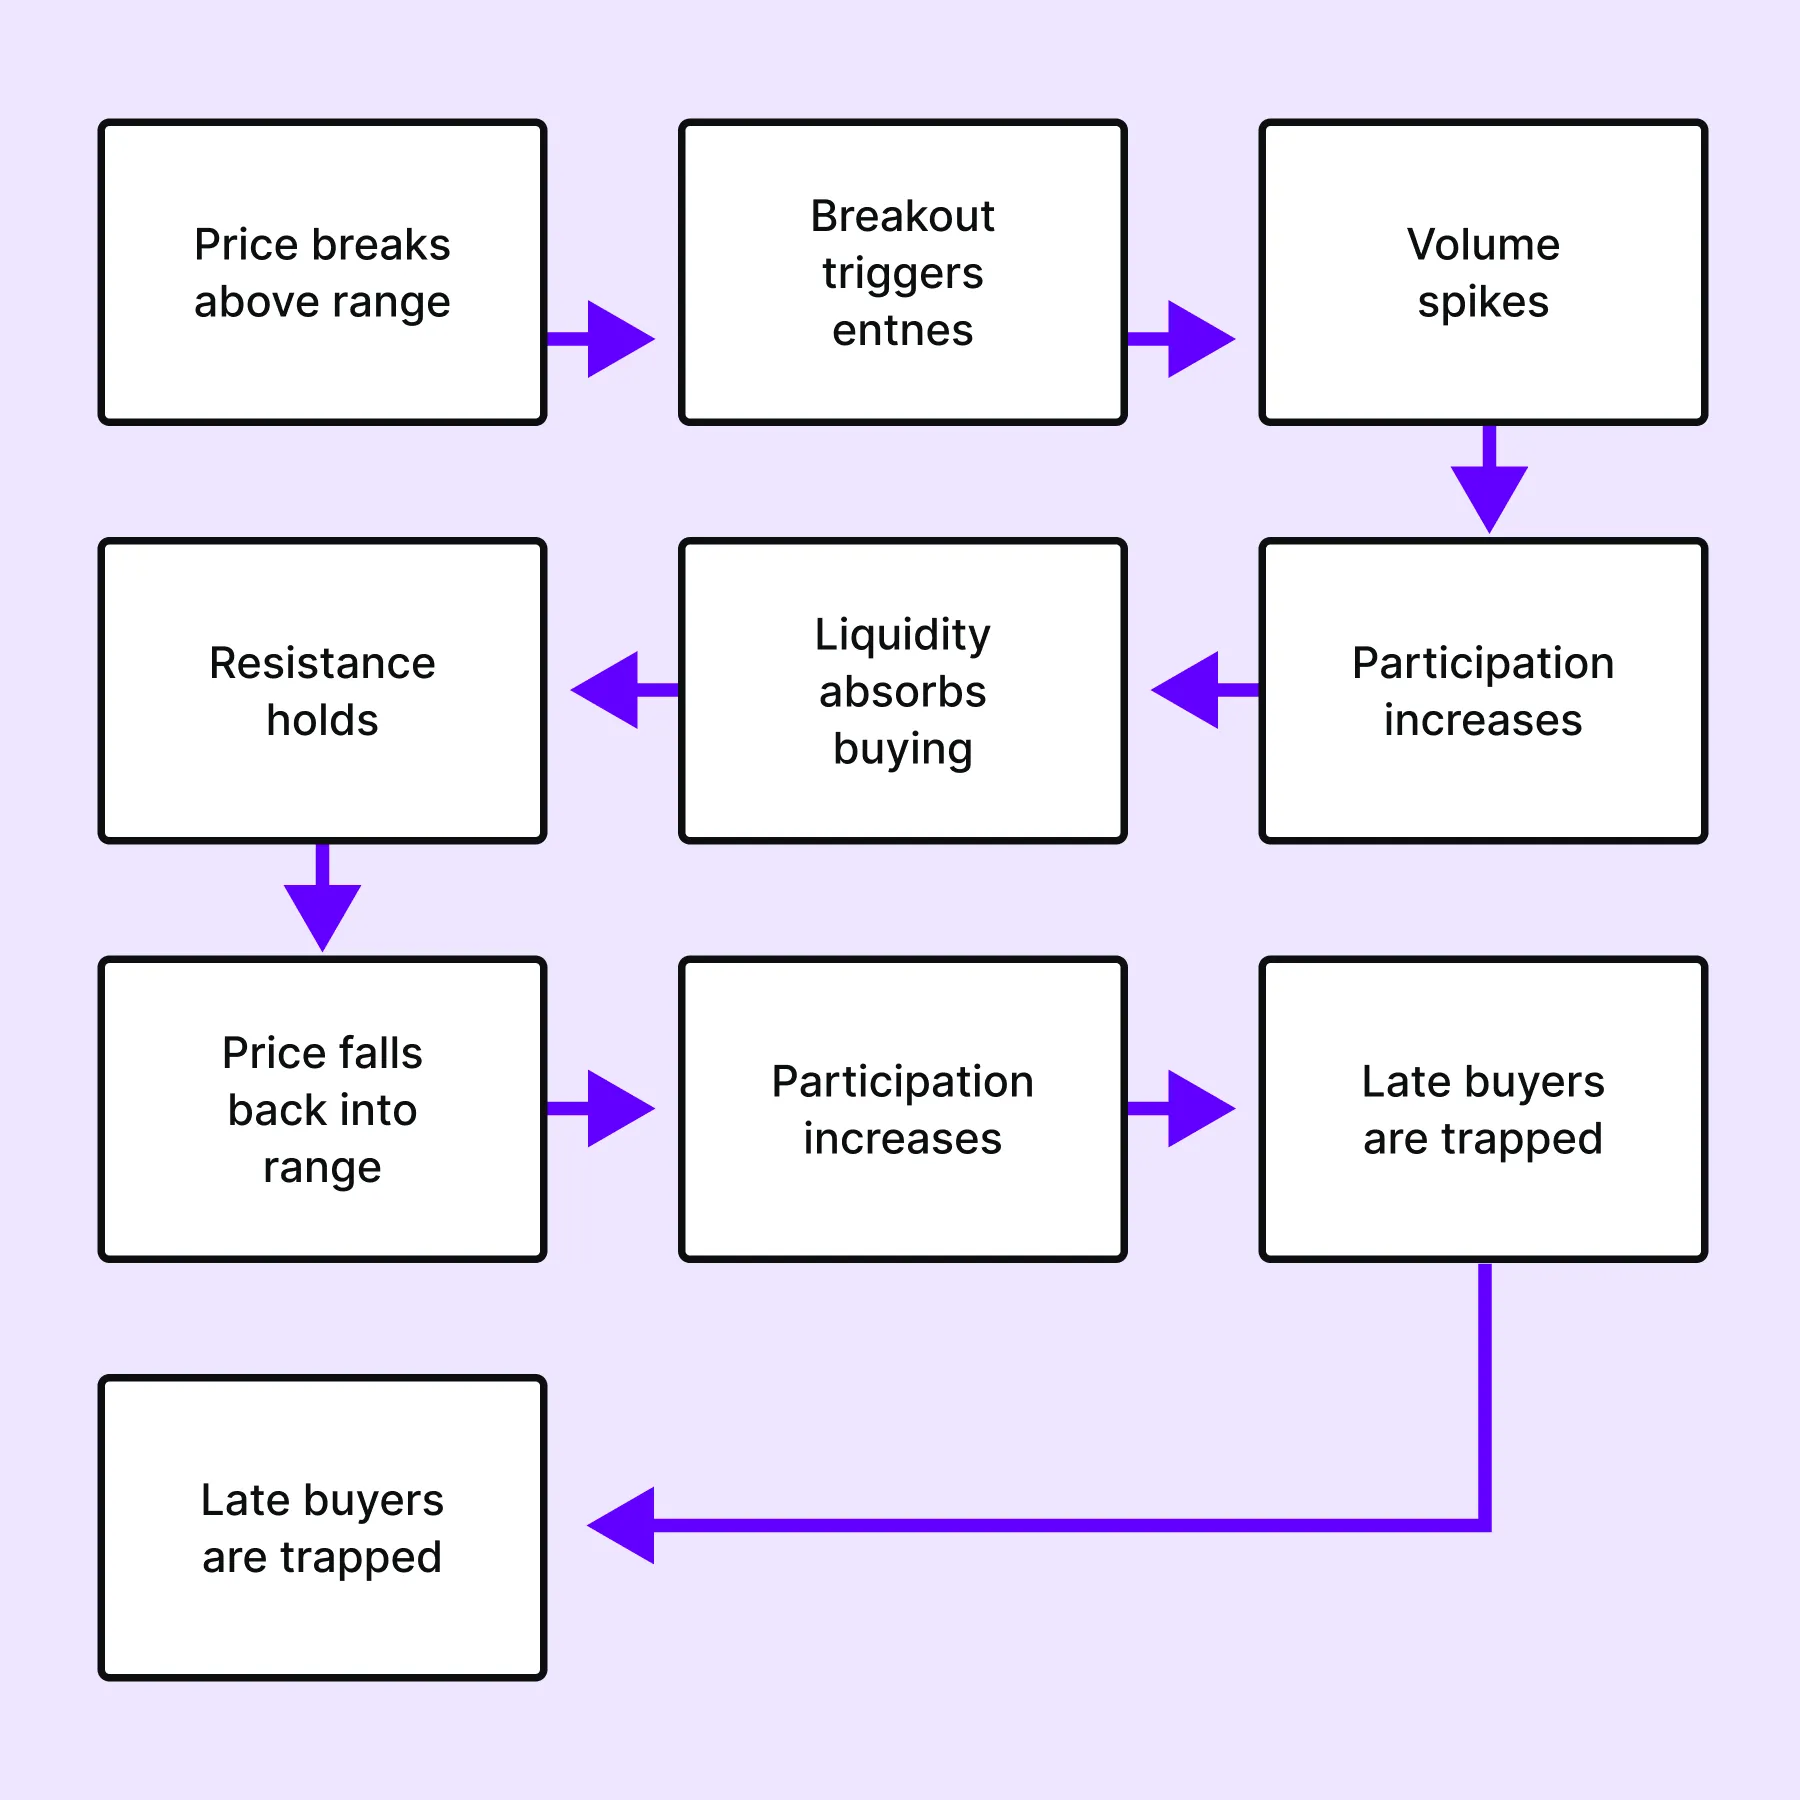
Heavy volume does not always lead to continuation because some market participants enter at the wrong time. This creates what is known as “trapped positioning”, which plays an important role in failed moves.
Usually, this process begins with a breakout. Price moves above a short-term range, and activity increases sharply. Now, many traders:
- Interpret this as confirmation, and
- Enter in the direction of the move.
However, the underlying structure may not support continuation. In such cases, opposing liquidity absorbs the aggressive orders. As a result,
- Price fails to hold above the breakout level, and
- Begins to rotate back into the range.
At this point, traders who entered during the breakout are forced to exit. Their selling activity adds pressure in the opposite direction. For more clarity, study the graphical representation of a breakout and how late traders get trapped:
Understand when volume signals absorption instead of momentum → Compare Plans
Effort Versus Result: The Key Interpretation Tool
A more reliable way to interpret volume comes from comparing “effort and result”. This approach improves trading volume analysis by linking activity with actual price movement.
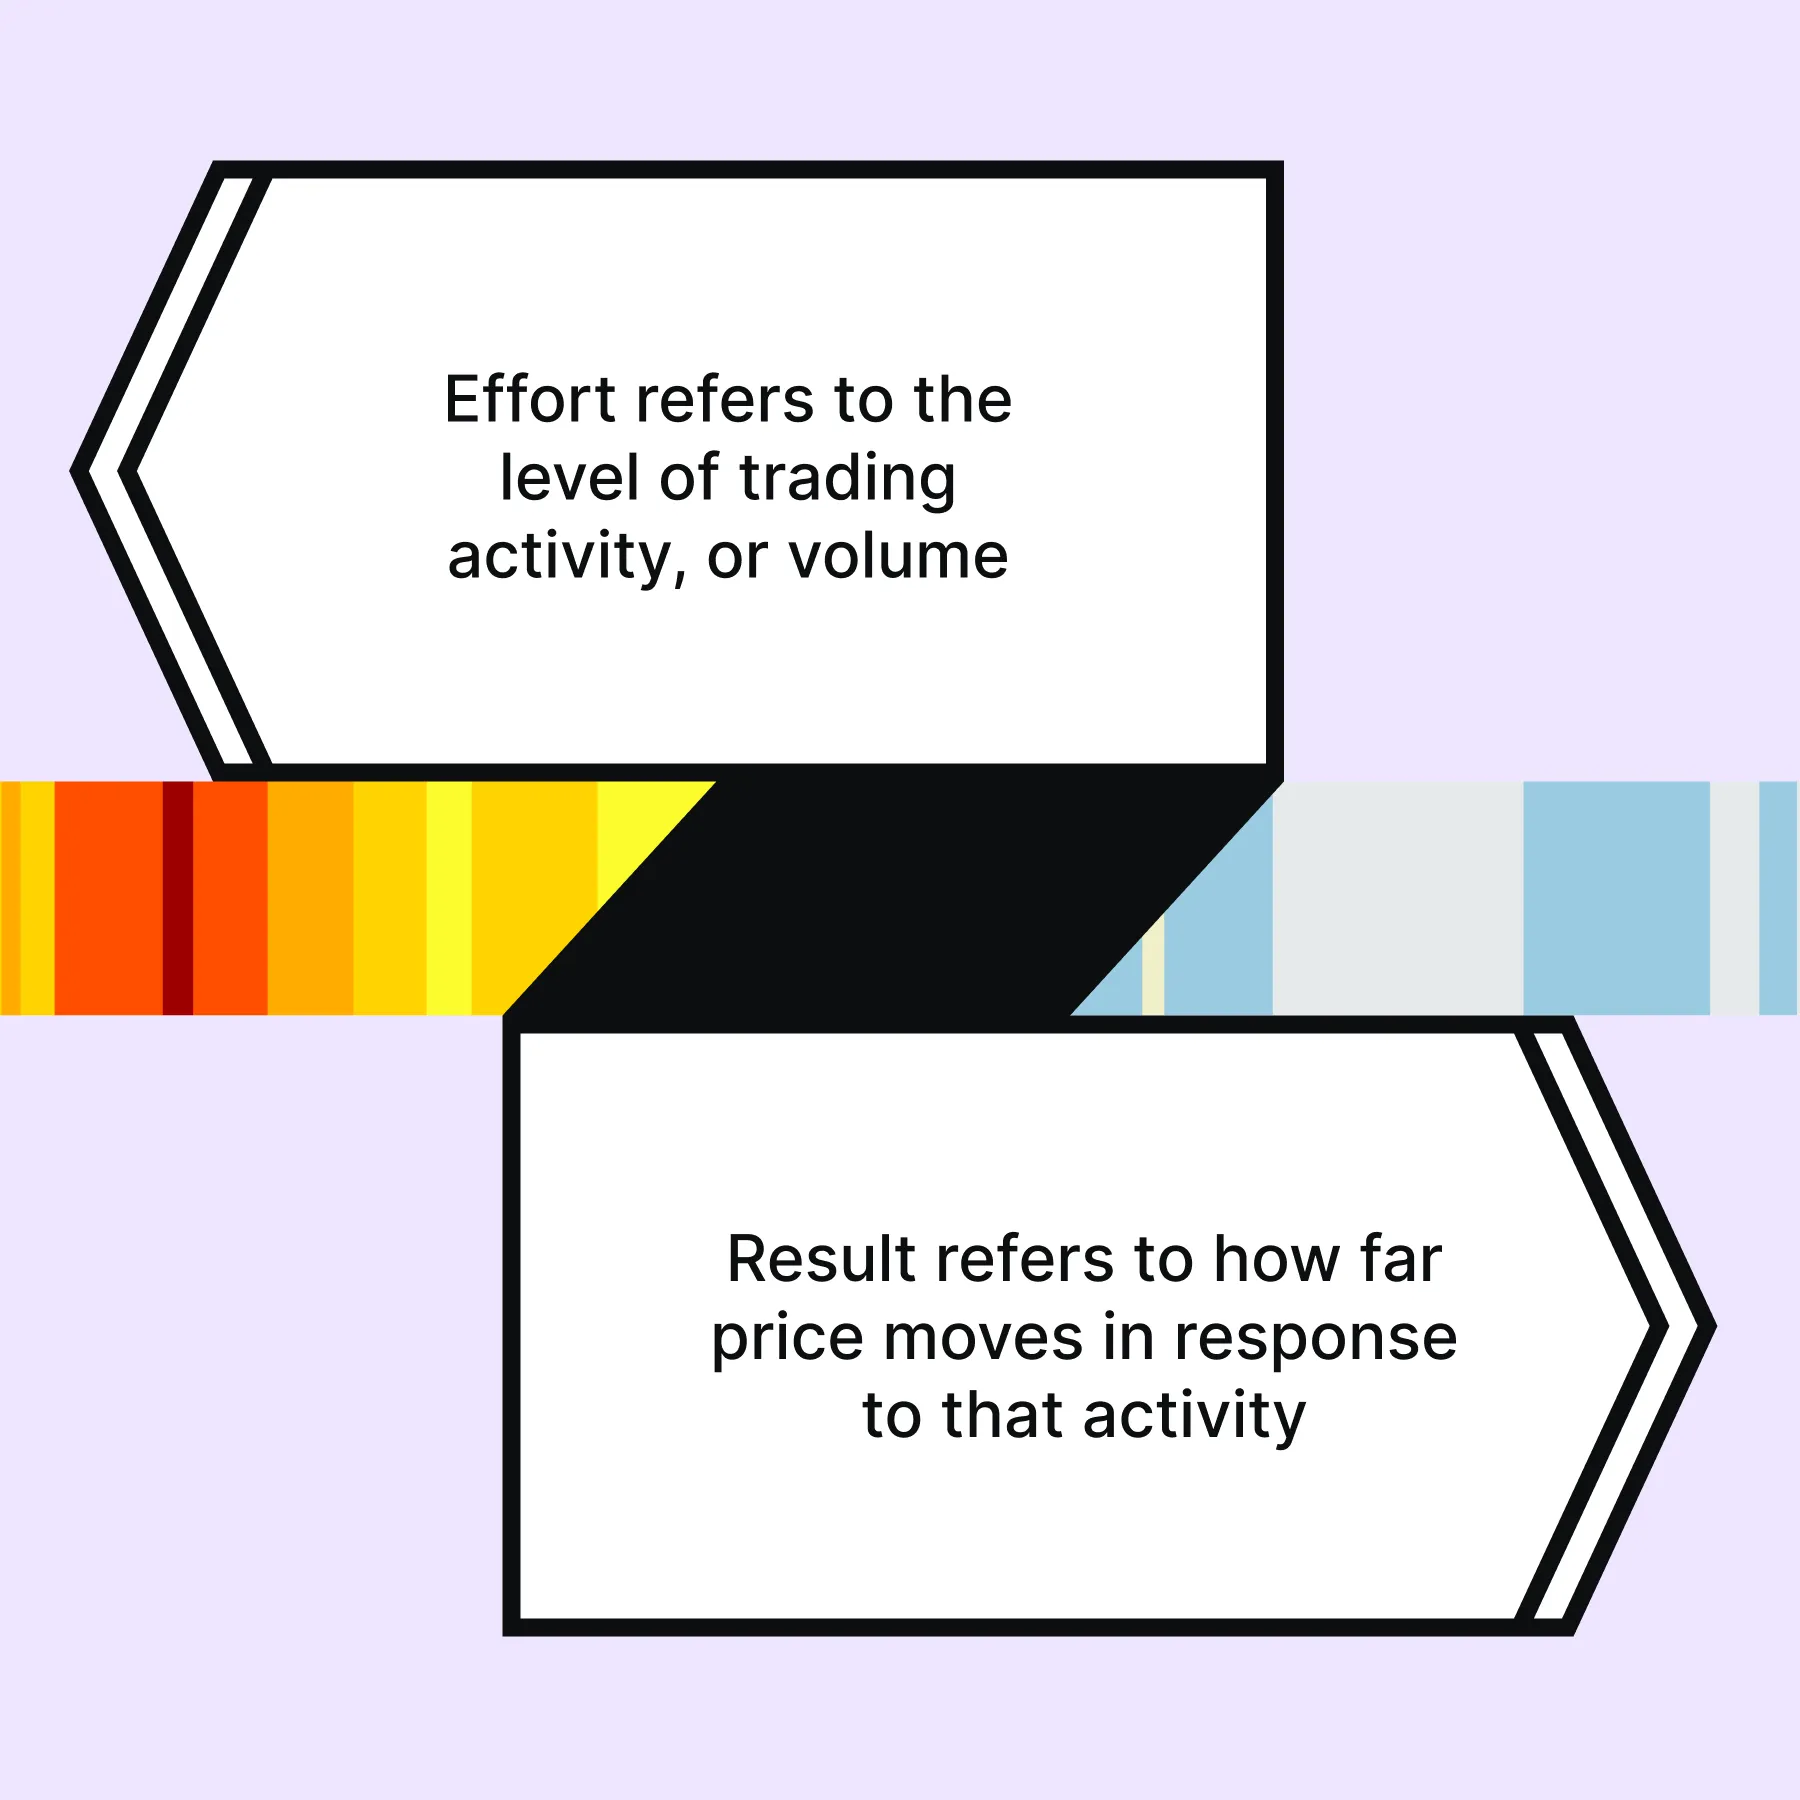
The relationship between the two determines whether participation supports continuation. If effort increases but price shows little progress, it indicates that something is preventing the move. In most cases, this “something” is opposing liquidity, absorbing the activity.
This can be illustrated as follows:
| Effort (Volume) | Result (Price Movement) | Interpretation |
| High | Small price change | Absorption present |
| High | Strong price movement | Continuation likely |
For example,
- Suppose a large burst of aggressive buying enters the market.
- Volume rises significantly.
- However, the price only moves slightly before stalling.
- This imbalance suggests that passive sellers are absorbing the flow.
- In contrast, assume that increased effort leads to sustained price movement.
- Now, this indicates that participation is aligned with direction.
Therefore, without price expansion, high volume/activity alone cannot confirm continuation. It may instead indicate resistance or structural completion.
Reading Volume Together with Liquidity
The importance of volume increases only when it is read alongside liquidity.
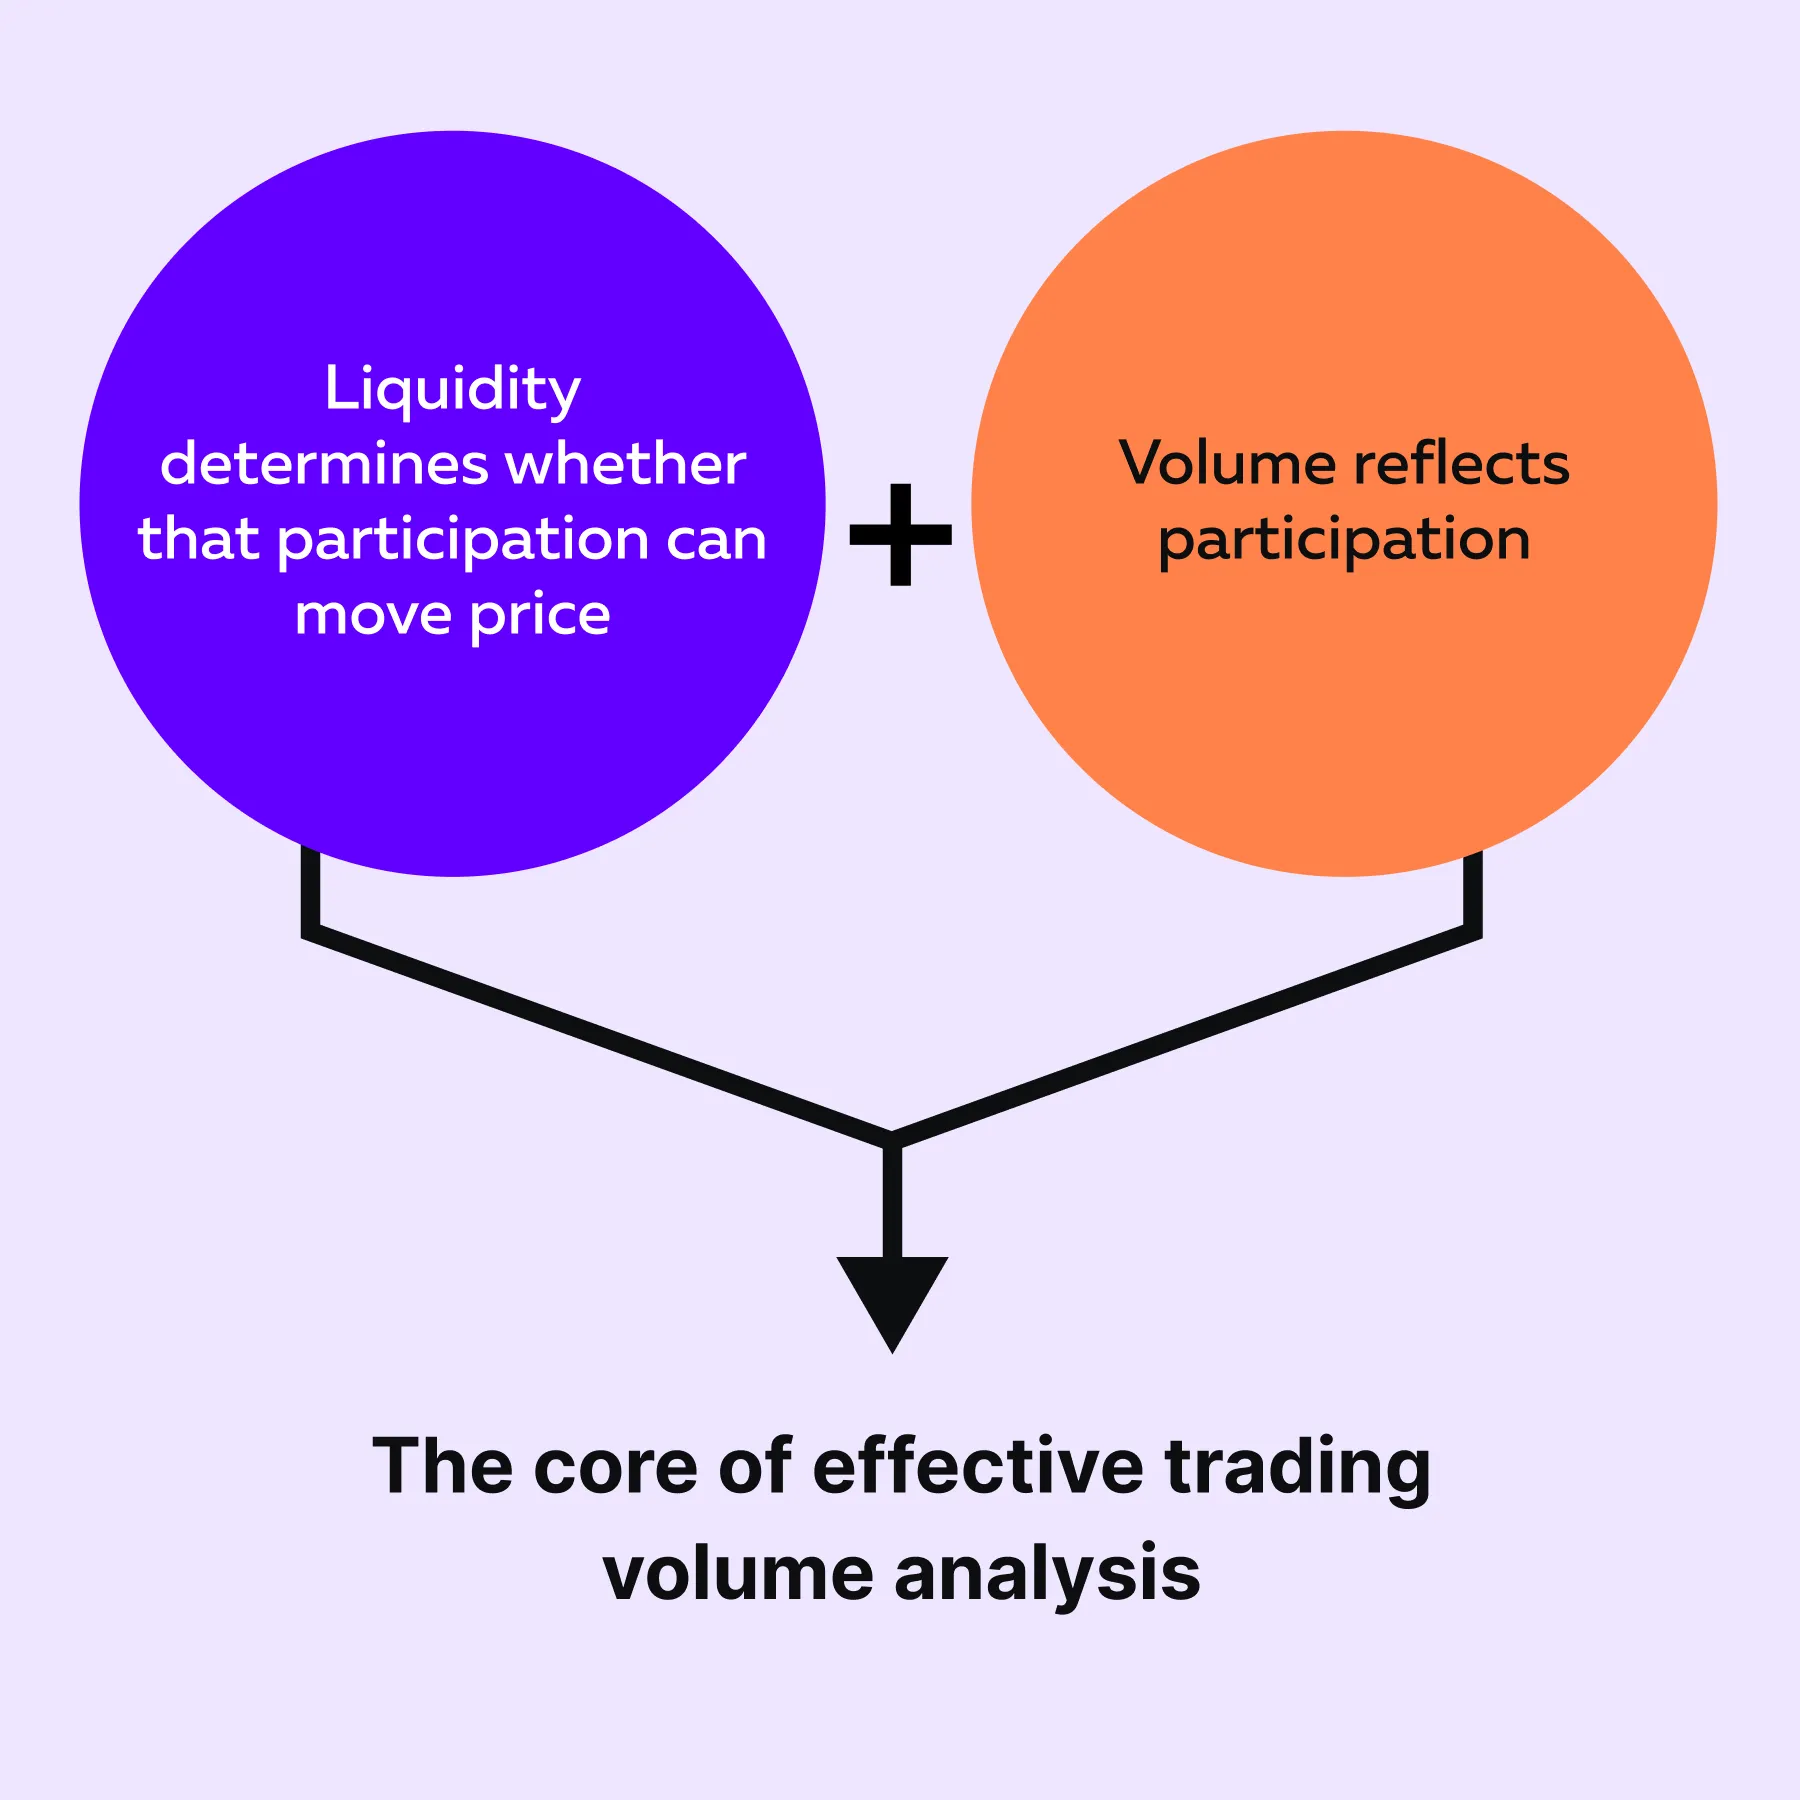
Note that aggressive traders initiate moves, but their success depends on the availability of opposing orders.
- If liquidity allows the price to move, continuation develops.
- If liquidity resists, the move stalls.
Several successful traders consider this interaction at the time of interpreting order flow volume signals. For a better understanding of the concept, let’s have a look at some “observable conditions” that further clarify this relationship:
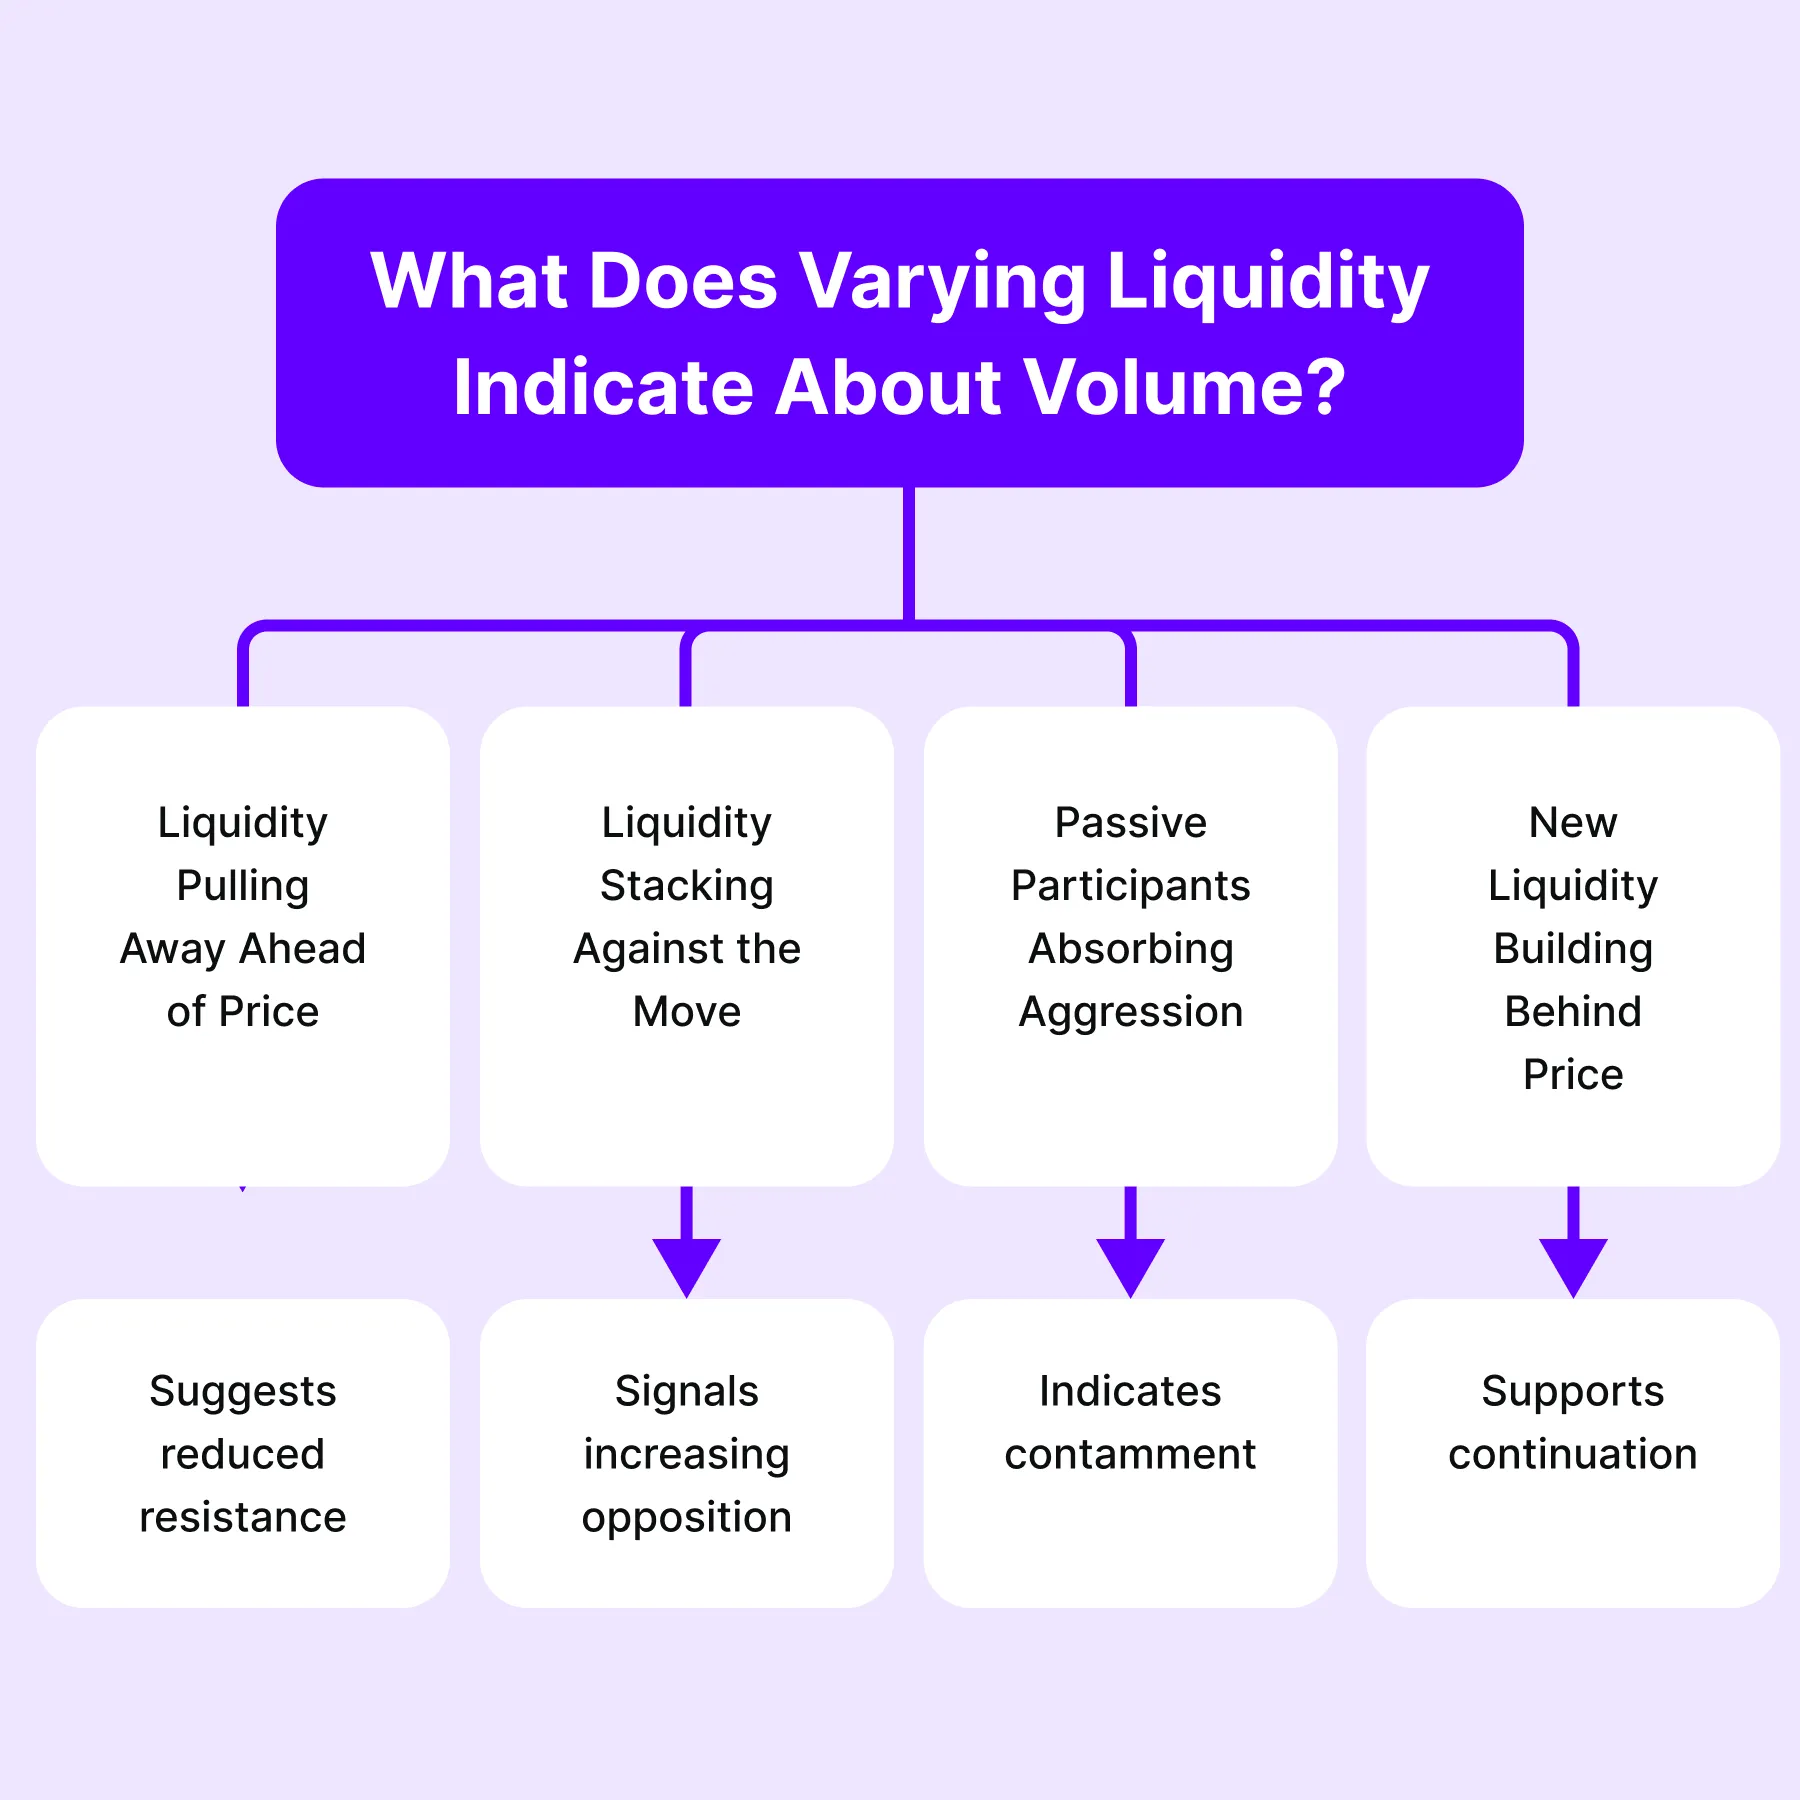
These factors show that volume alone cannot define direction. Instead, they influence the outcome of volume vs. price continuation. For example,
- Suppose there is a surge in buying activity.
- It may signal a “bullish environment”.
- However, assume that large sell orders repeatedly appear above the price.
- Now, that activity gets absorbed.
- As a result, continuation may fail despite strong participation.
In contrast, when liquidity above price disappears while volume increases, there is little resistance to slow the move. Therefore, traders must understand that:
- Volume shows participation, while
- Liquidity shows resistance.
Only by reading both together can the true intent behind market activity be identified. Understand how liquidity and transaction flow reveal whether volume supports continuation → Compare Packages
Why Modern Markets Produce More Volume Traps
Modern markets operate with greater speed and automation. Algorithmic systems now drive a large portion of activity. These systems can trigger rapid bursts of trading within very short time frames. At the same time, liquidity providers continuously adjust their quotes, which alters available resistance and support.
In this environment, several events can create sudden volume spikes:
- Stop clusters triggering forced buying or selling
- Liquidity sweeps targeting resting orders
- Inventory adjustments by large participants
- Momentum strategies reacting to price movement
Due to this, heavy volume may not represent true directional intent. Instead, it may reflect short-term reactions (rather than sustained participation). Therefore, trading volume analysis must account for structure and liquidity. Without this context, volume traps become more common, and false signals increase.
This dynamic can be observed in a Bookmap Insights Example. Let’s study it.
Real Trade Example: Large Volume Without Continuation
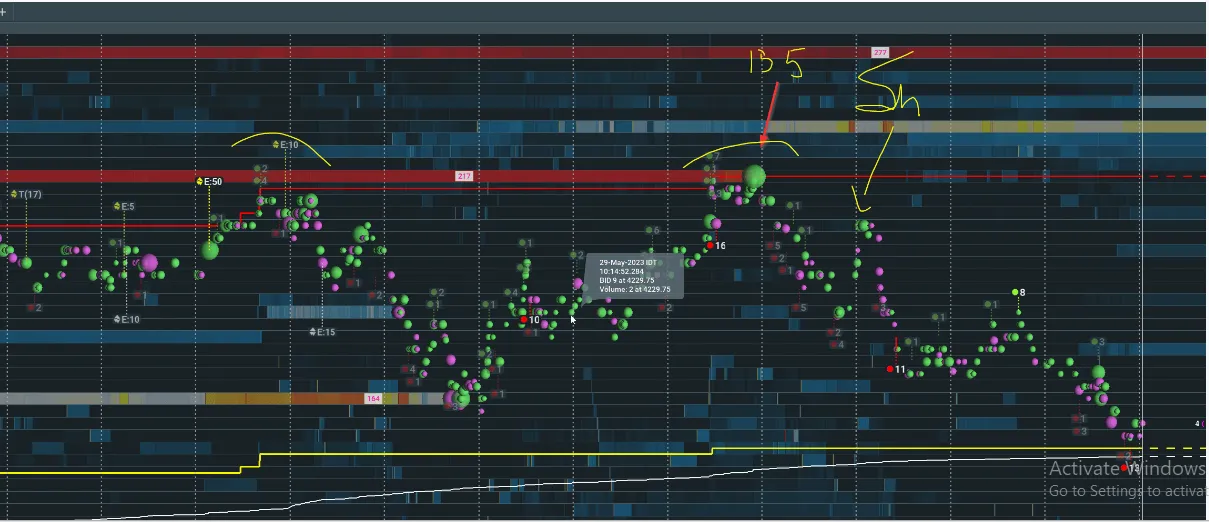
Earlier in the session, price had already moved higher and was approaching liquidity near the highs. As the price reached this area, aggressive buying activity increased sharply. Large volume printed near the top, which many participants would interpret as “bullish continuation” (based on common volume trading continuation logic).
However, the outcome differed. Despite the increase in activity:
- Passive sell liquidity remained present above the price
- Aggressive buying orders were absorbed
- Price failed to hold above the level
- Follow-through did not develop
This sequence shows an imbalance between effort and result. While participation increased, price did not expand. This is a classic case of volume vs price continuation, where effort fails to produce the expected outcome.
Shortly afterward, the price rotated lower. The prior buying activity (instead of driving continuation) marked resistance.
Conclusion
Heavy volume often draws attention, yet it does not guarantee continuation. It only confirms that a large number of transactions have taken place. What matters more is the outcome of that activity.
When volume leads to price expansion, it reflects participation that supports volume trading continuation. However, when the same activity is absorbed by opposing liquidity, the price fails to progress.
Therefore, trading volume analysis requires observing how the price responds to activity. The relationship between volume vs price continuation reveals whether the market is advancing or being resisted. In addition, order flow volume signals help identify when participation is being absorbed.
See how real-time liquidity and order flow reveal whether volume is driving continuation or signaling exhaustion → Compare Packages
FAQs
1. Does high trading volume always mean a trend will continue?
No, high volume only shows that many trades are happening. It does not confirm control. If strong opposing liquidity is present, the price may stop or reverse. Traders must understand that high volume alone cannot confirm the continuation of volume.
2. Why does volume sometimes spike before reversals?
Usually, volume spikes near key price levels where many traders enter aggressively. If the market cannot continue, those traders become trapped. Their exits add pressure in the opposite direction. This is one reason why volume spikes fail and lead to reversals.
3. What is absorption in trading?
Absorption occurs when large passive orders absorb aggressive buying or selling. Even with high activity, the price does not move much. Traders must realize that strong participation does not always result in volume or price continuation.
4. How can traders interpret volume more accurately?
Volume should be read with liquidity and price behavior. Note that strong moves require both participation and low resistance. If volume increases but price does not move, absorption may be present. This approach improves trading volume analysis and reduces false signals.
Sign Up Now