See positioning shifts before reversals fully develop.
Compare plans to track speculative positioning alongside price behavior.
Education
May 6, 2026
SHARE
COT and Price Reversals: How to Interpret Speculator Positions

Usually, markets turn when positioning leaves no room for surprise! Yes, in futures markets, price trends are not driven by opinion alone but by how capital is actually positioned. This is where the Commitment of Traders Report becomes valuable, as it reveals the positions of different market participants.
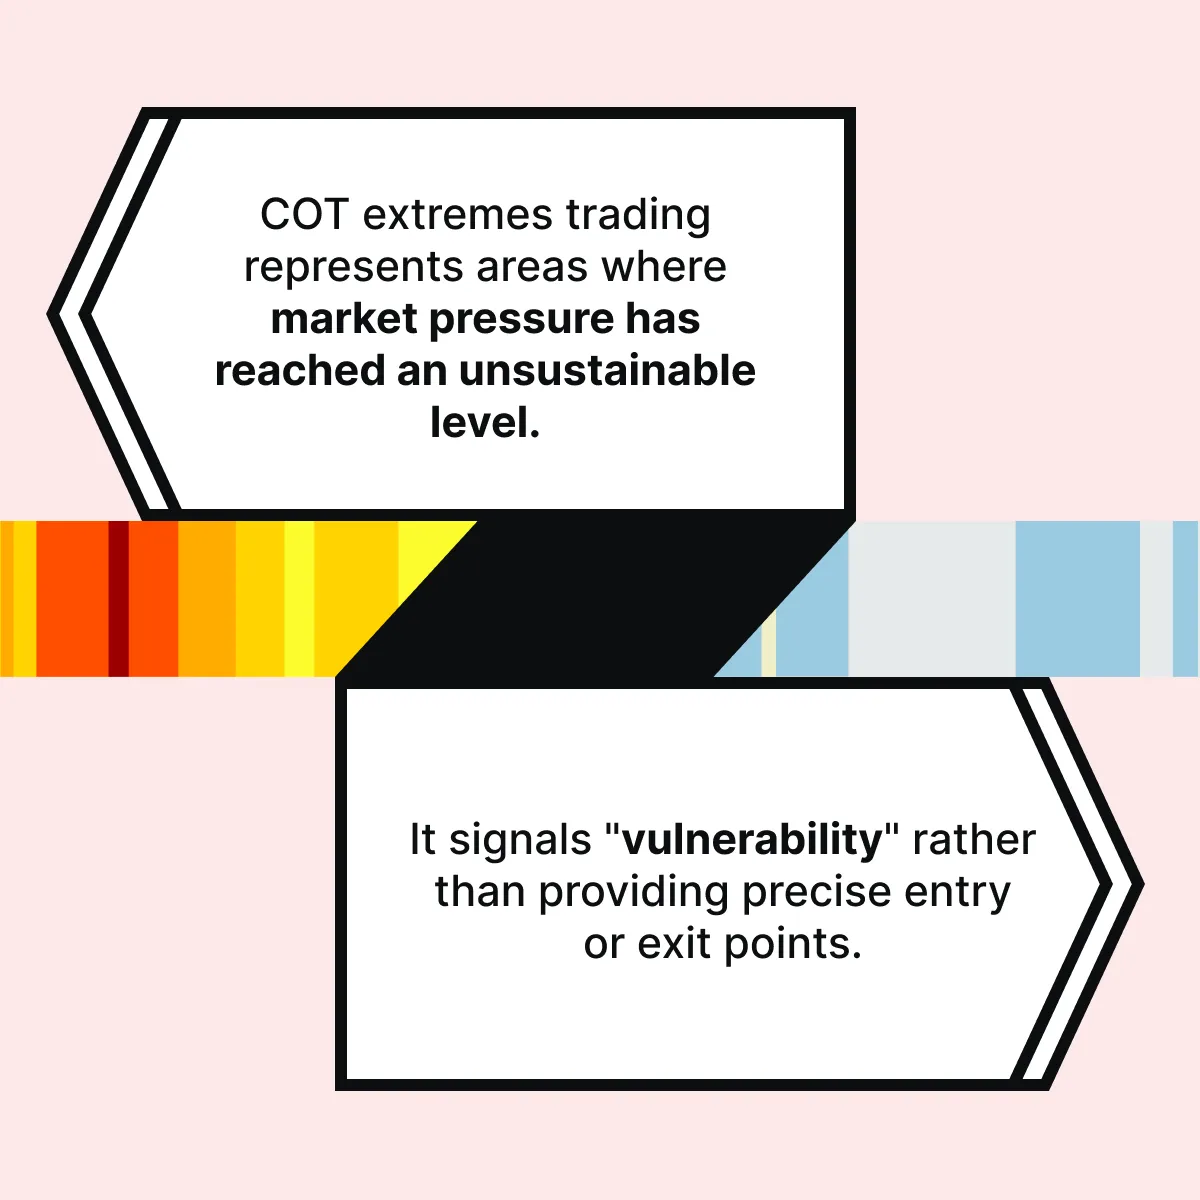
At first glance, strong trends supported by heavy speculative buying may appear stable. However, as COT positioning analysis shows, these trends may become crowded over time. When too many participants hold similar positions, the market becomes structurally fragile (even if the price continues in the same direction).
Read this article to understand how speculator positioning of futures data influences broader COT market sentiment, why extremes matter, and how positioning interacts with liquidity. Additionally, traders will also learn how the COT report trading strategy helps identify vulnerability and offers deeper insight into why markets reverse rather than when they will.
What the COT Report Actually Shows
The Commodity Futures Trading Commission publishes the Commitment of Traders report each week. It shows how different market participants are positioned in futures markets. The report divides traders into groups and shows whether they are holding more long or short positions.
Let’s see what the primary use of the COT report is:
To begin with, the report classifies participants into three main categories, each representing a distinct role in the market.
| Category | Who They Are | Purpose in the Market | Some Common Examples | Impact on Price | Role in COT Analysis |
| Commercial Traders | Businesses and institutions with real economic exposure | Manage risk by hedging future price changes |
|
Lower direct impact on short-term price trends |
|
| Non-Commercial Traders (Large Speculators) | Hedge funds, managed money, and large speculative participants | Seek profit from price movements |
|
Strong influence on trends and momentum |
|
| Non-Reportable Traders | Small traders below the reporting threshold | Participate in markets with smaller position sizes |
|
Limited influence compared to institutions |
|
Taken together, these three groups create a 100% complete picture of how different participants are positioned. When extremes emerge (particularly within large speculator positioning), they can even indicate “potential imbalances” in the market.
Why Extreme Speculator Positioning Matters
Positioning extremes arise when a large share of market participants align on one side of a trade. Let’s see how traders can spot them:
Due to these positioning extremes, the overall sentiment becomes “heavily one-directional”. This situation is visible through:
- COT positioning analysis, and
- Broader COT market sentiment indicators.
Under such conditions, trend continuation depends on new participants entering in the same direction. However, when speculator positioning futures data shows that most large traders are already positioned long, the pool of potential new buyers becomes limited.
This imbalance creates a fragile structure. In this structure, prices rely on “sustained optimism” but lack fresh demand to support further movement. Consequently, even a minor negative development disrupts this balance. For example,
- Suppose a few large speculators hold near-record long exposure in crude oil.
- Here, any unfavourable news can lead to a wave of selling.
- This process indicates a shift in sentiment rather than a direct reaction to the report itself.
Importantly, the reversal does not occur because of the commitment of traders report. Instead, it happens because crowded positioning must eventually rebalance. Let’s see what COT extremes traders can show in this context:
Understand how positioning and liquidity interact in real markets → Compare Packages
Positioning Does Not Predict Timing
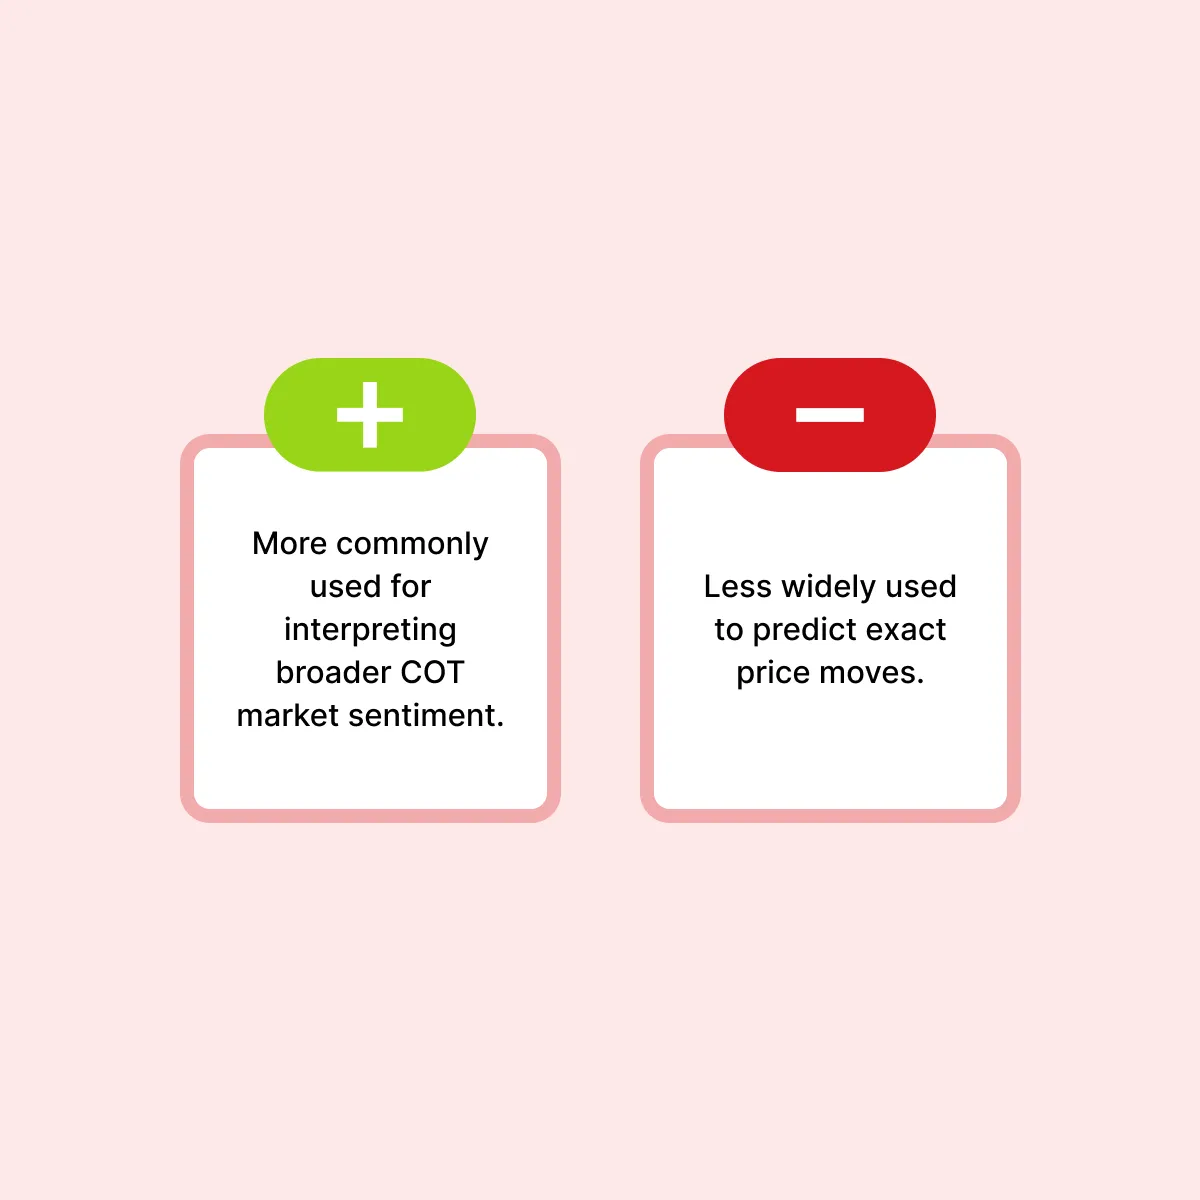
COT data is often misread as a short-term timing tool. Realise that its real value lies in providing context. The Commitment of Traders report shows how market participants are positioned. But it does not indicate when the price will reverse.
In many cases, positioning extremes can persist for extended periods. For example,
- Suppose a strong bull trend is ongoing in the market.
- The prices keep rising.
- Large speculators may continue to hold heavy long exposure.
- This behaviour represents “sustained momentum” rather than immediate exhaustion.
- It also means extreme readings in COT positioning analysis do not automatically lead to reversals.
Therefore, the role of the COT report trading strategy is not to identify exact entry or exit points. Instead, it reveals the following:
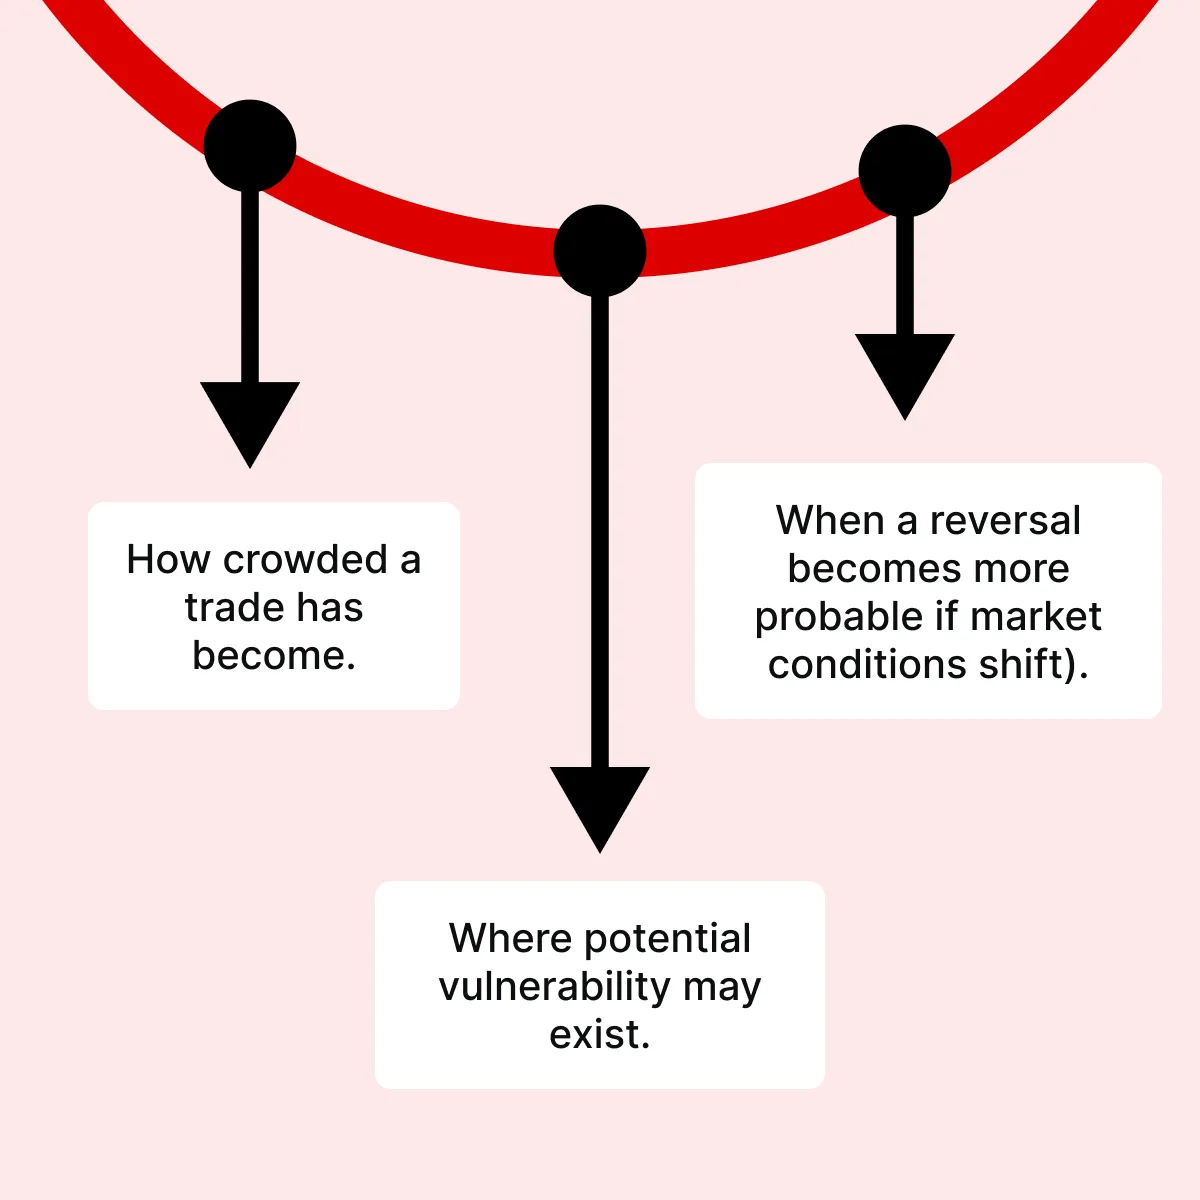
In this sense, COT market sentiment acts as a “background indicator of pressure” rather than a trigger for action.
The Mechanism Behind Positioning-Driven Reversals
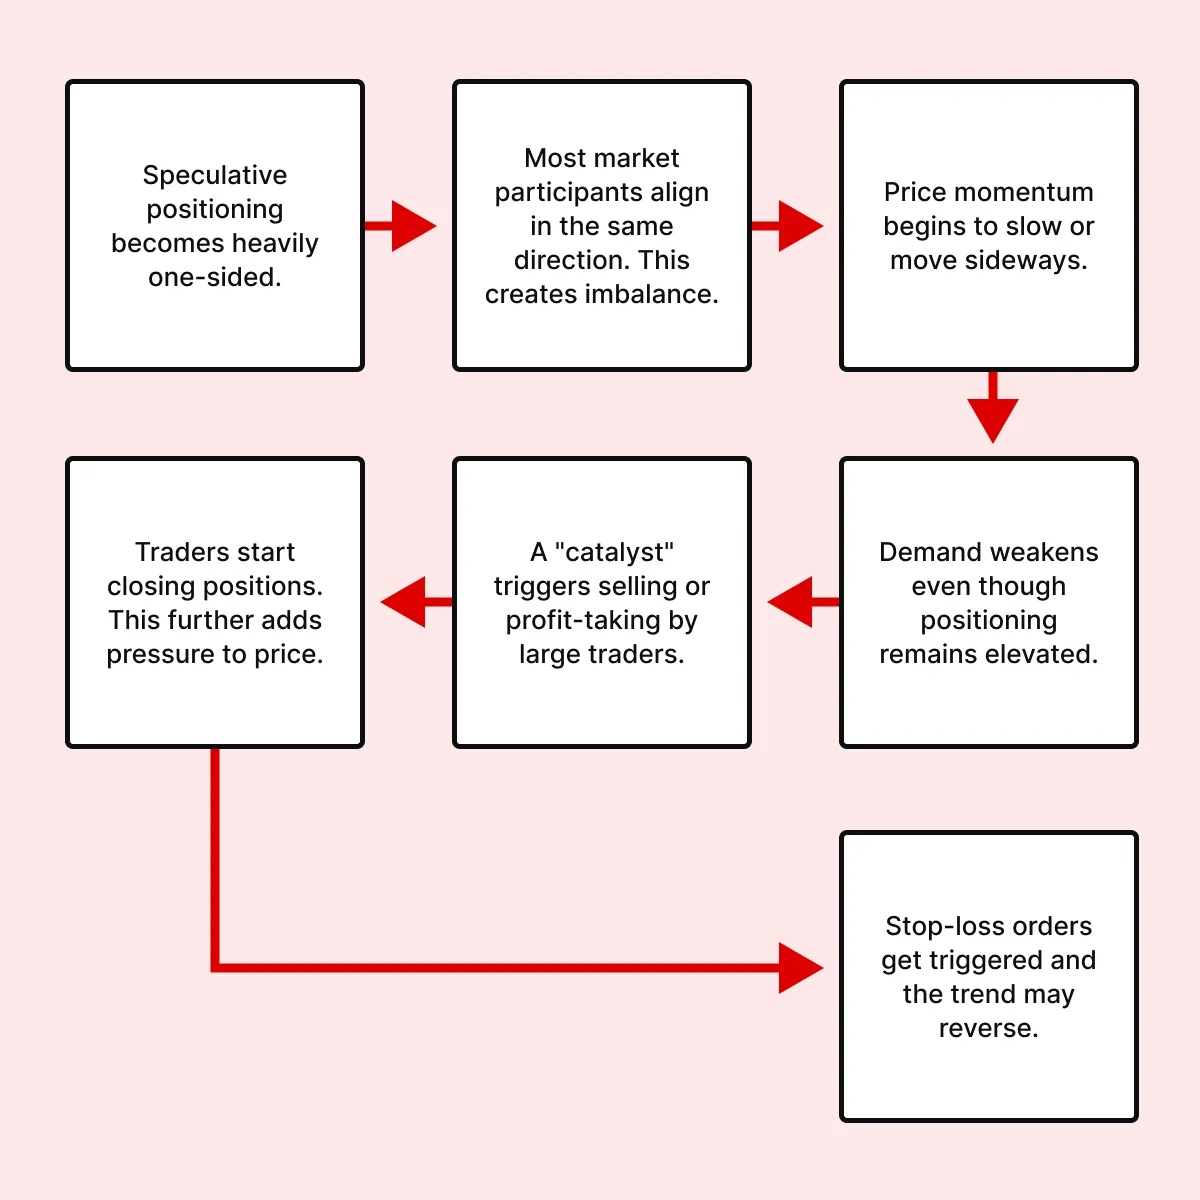
Reversals linked to positioning are not a result of a sudden change in opinion. Instead, it follows a process. Initially, speculative positioning becomes highly one-sided (this is reflected in speculator positioning futures data). This stage indicates that a large portion of the market is aligned in the same direction.
Now, as this imbalance grows, price momentum begins to slow or stall. This change suggests that the trend is losing incremental demand (even though positioning remains elevated). Subsequently, a catalyst, such as unexpected news or a shift in macro conditions, triggers selling or profit-taking among large participants.
Once selling begins, traders start closing positions. This adds to market pressure. At the same time, liquidity conditions change as stop-loss orders are triggered. Such triggering of stop-loss orders further increases the pace of the move and may lead to price reversal.
See how participation and order flow confirm positioning shifts → Compare Plans
Why Liquidity Matters When Positioning Unwinds
Positioning on its own does not move prices. Instead, price movement occurs when position unwinding interacts with available liquidity in the market.
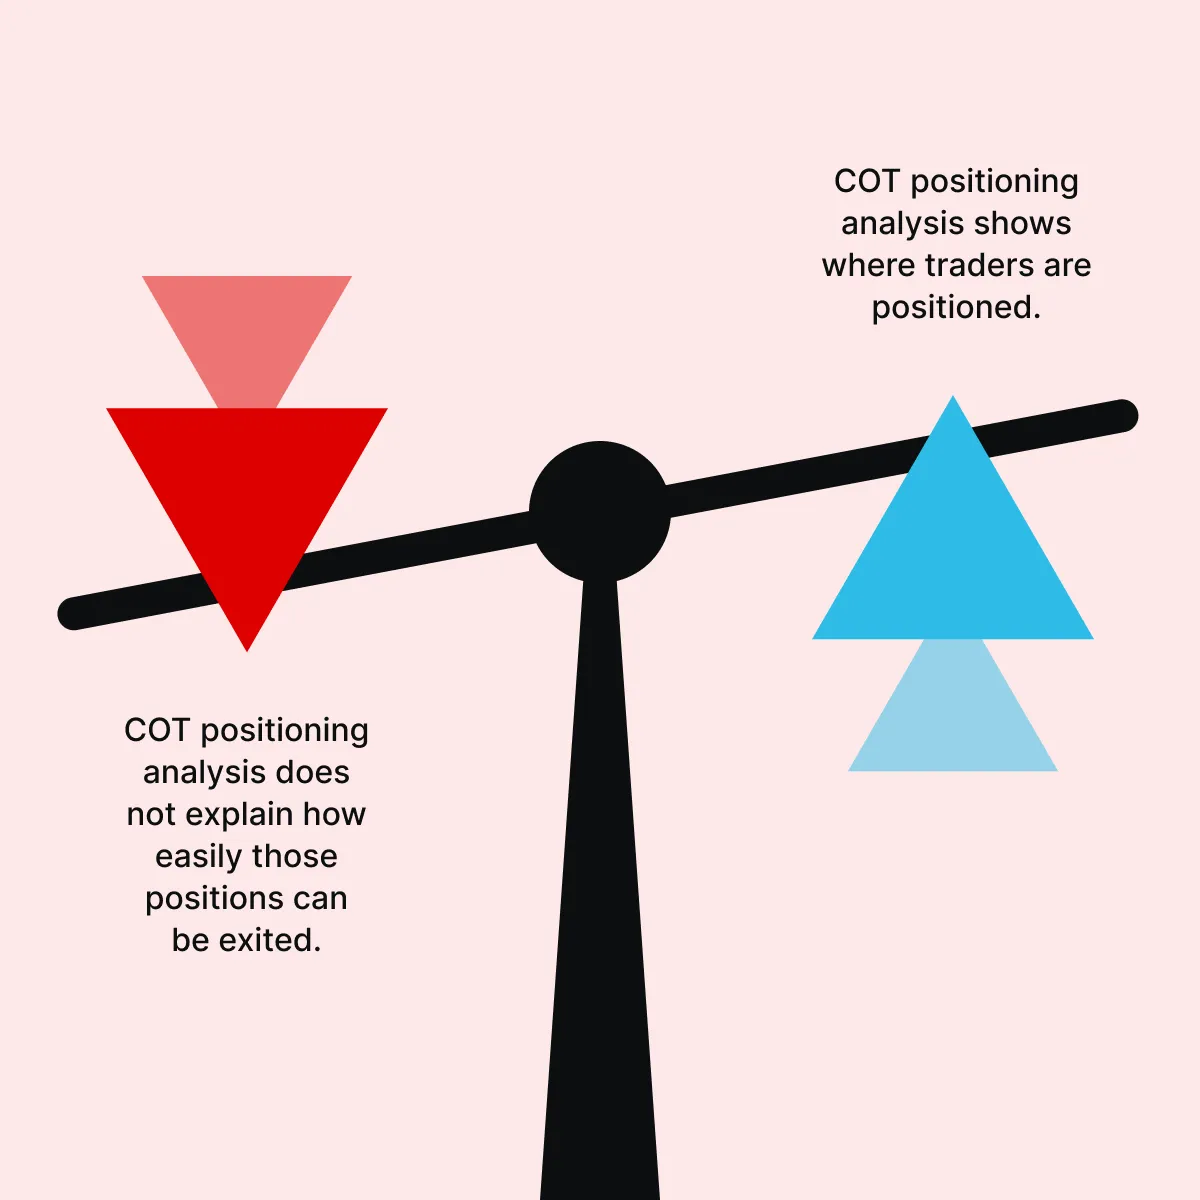
This distinction is highly important. That’s because when large speculative positions begin to close, the outcome depends on market depth. If liquidity is strong, the market can absorb selling with limited disruption. However, if liquidity is thin, even moderate selling pressure can lead to sharp price movements. As a result, several liquidity shifts usually appear during these unwinding phases. Let’s see three different examples to understand better:
| Example I | Example II | Example III |
|
|
|
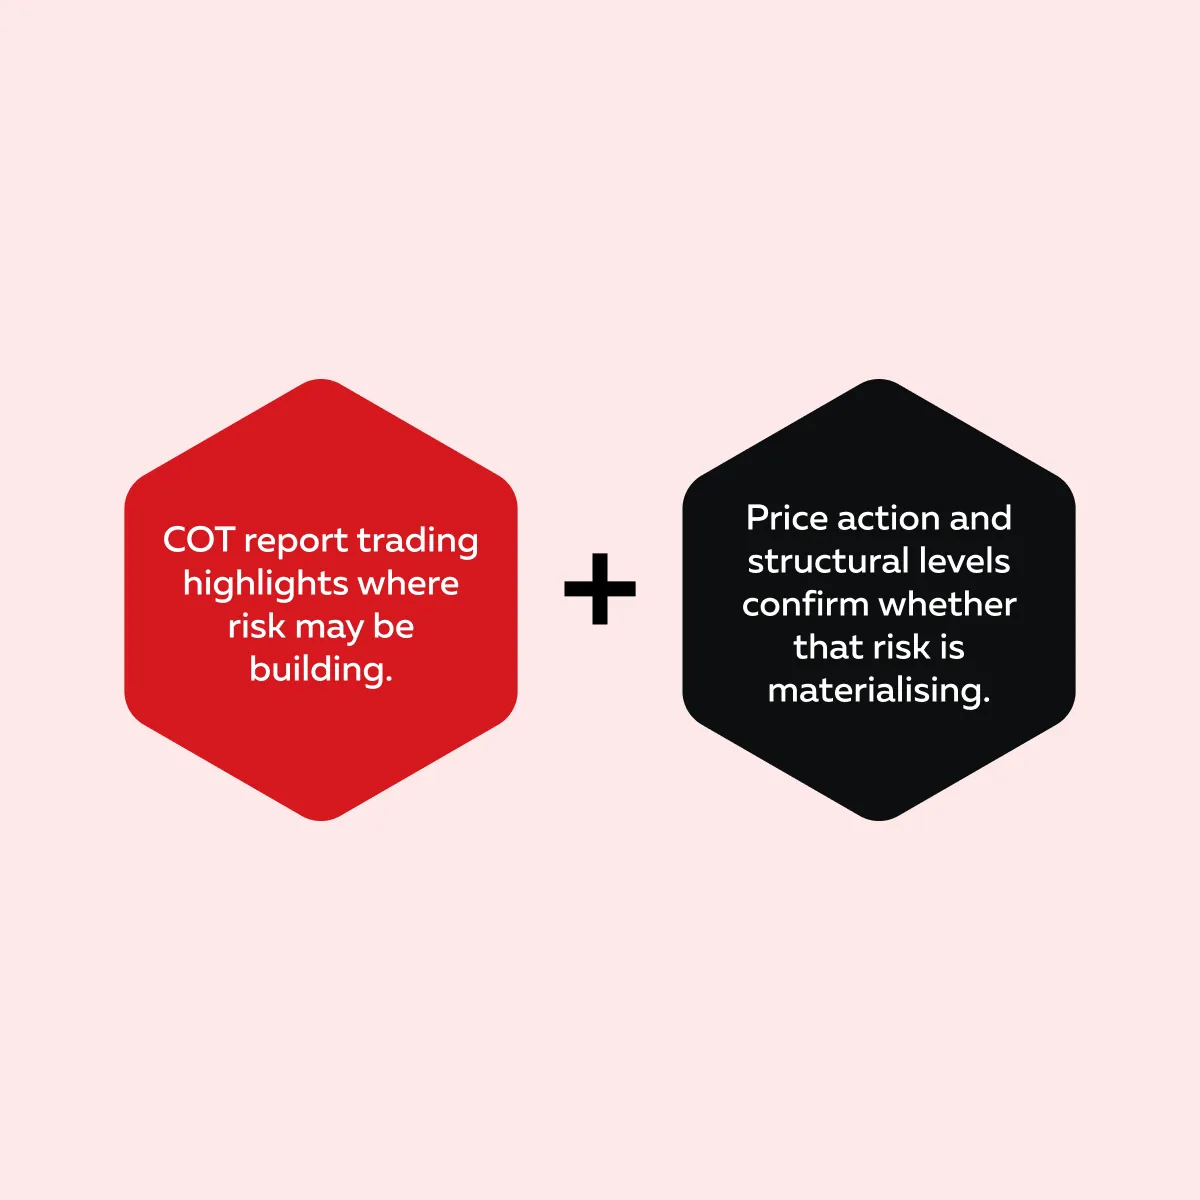
Thus, COT market sentiment should be interpreted alongside real-time liquidity conditions. Note that within a COT report trading strategy:
- Positioning identifies where pressure may build, while
- Order flow and liquidity reveal how that pressure translates into actual price movement.
This combined view strengthens the interpretation of COT extremes trading. Understand how positioning and liquidity interact during reversals → Compare Packages
Example Scenario: Crowded Long Trade Unwinds
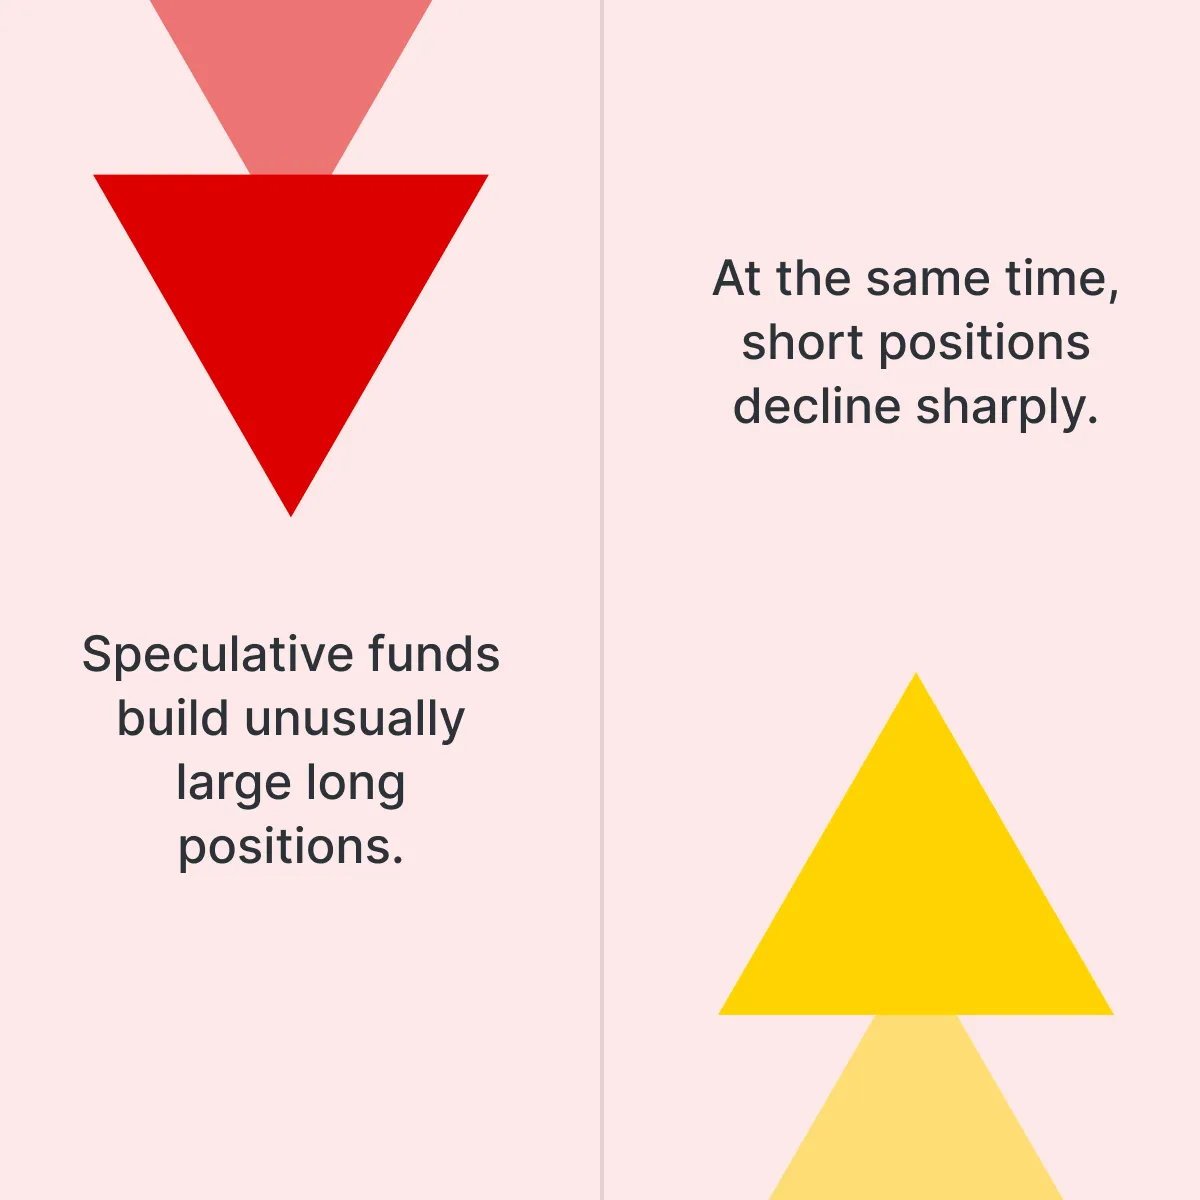
A common pattern in futures markets begins with large speculative traders building near-record long positions in a currency contract. This build-up is visible through speculator positioning of futures data. Such a build-up usually aligns with a strong upward price trend over several weeks. As long as new buyers continue to enter, the trend remains supported.
However, conditions gradually change as:
- Momentum begins to slow, and
- Price moves into a sideways range.
During this phase, liquidity starts to build above the market, while buying pressure weakens. At the same time, early signs of selling emerge. These signs indicate that some participants are beginning to reduce exposure.
Traders must understand that such a situation becomes even more unstable when the price approaches a key support level. Later, once this level breaks, long liquidation begins. Traders start closing positions, which triggers stop-loss orders. Such a triggering further adds selling pressure and accelerates the decline.
Using COT Data Without Overfitting
The application of COT data requires careful interpretation. The Commitment of Traders report can be used as a “positioning tool”. Using it, traders may:
- Identify crowded trades
- Detect areas of potential weakness in trends, and
- Assess broader COT market sentiment
These insights provide context for how market pressure is distributed across participants. However, limitations become visible when COT data is used in isolation. Traders must note that entering trades solely based on extreme positioning can lead to poor outcomes. This may happen as extremes can persist without immediate reversal.
Similarly, assuming that all extreme readings will result in turning points ignores the role of price structure and liquidity conditions.
For this reason, a balanced COT report trading strategy treats positioning as one component of analysis.
This approach ensures that COT positioning analysis supports decision-making without becoming an over-optimised or misleading signal. Analyze market behavior beyond sentiment indicators → Compare Packages
Conclusion
The Commitment of Traders report offers a clear view of how major participants are positioned in futures markets. It does not predict exact turning points. Yet it reveals when markets become imbalanced. When speculative positioning turns extreme, trends may continue, although underlying risk begins to build.
As a result, even small changes in liquidity or sentiment can lead to strong price moves. This behaviour shows pressure created by crowded trades (rather than random market action).
In this context, COT positioning analysis and COT market sentiment provide valuable insight into where vulnerability may exist. When combined with price structure and liquidity conditions, this approach explains not just when markets move, but why reversals occur. See how real-time liquidity and participation confirm positioning shifts → Compare Packages
FAQs
1. What is the Commitment of Traders report?
The Commitment of Traders report is a weekly report released by the Commodity Futures Trading Commission. It shows how different groups (hedgers, large speculators, and smaller traders) are positioned in futures markets.
Through its analysis, traders may understand the overall COT market sentiment and where major market pressure exists.
2. Why do positioning extremes matter?
Positioning extremes matter because they show when a trade becomes crowded. Through COT positioning analysis, it becomes clear that if too many traders are on one side, fewer participants remain to continue the move.
This creates an “imbalance” and also increases the chance of sharp price adjustments if conditions change.
3. Does extreme COT positioning guarantee a reversal?
No, extreme positioning does not guarantee a reversal. There is a possibility that speculator positioning on futures data stays extreme for long periods during strong trends.
Traders must note that COT extremes trading shows vulnerability in the market. However, reversals only occur when:
- Price momentum weakens, and
- Other factors, like liquidity or catalysts, come into play.
4. How should traders use COT data effectively?
The COT report trading strategy works best when used as context rather than a signal. Using it, traders may identify crowded trades and overall sentiment. However, effective analysis combines COT positioning analysis with:
- Price structure
- Liquidity behaviour, and
- Participation data
Such a combined analysis may explain how and why market moves develop.
Sign Up Now