See nasdaq 100 more clearly in real time.
Compare plans to access deeper market visibility for nasdaq 100.
Stocks
September 5, 2025
SHARE
How the Nasdaq 100 Got So Concentrated and Why Traders Should Care

What happens when excess capital chases a few stocks? The index where these stocks are listed starts appearing like a spotlight for them! Yes, we are talking about the Nasdaq 100. It’s made up of 100 stocks, but due to market-cap weighting, only a handful of megacap names dominate its moves.
This Nasdaq 100 concentration has only grown stronger! Since the post-2020 tech surge and the AI boom, Nvidia, Apple, Microsoft, and other tech giants have significantly increased their weights in the index.
The impact? One blockbuster report from Nvidia or Apple can now swing QQQ and NQ futures far more than the combined moves of dozens of smaller peers.
Want to trade profitably in such an environment? In this article, you will learn why the Nasdaq is so top-heavy and how it impacts traders. Also, we will explore a few practical strategies to trade better and how our real-time market analysis tool, Bookmap, gives you an edge.
How the Nasdaq 100 Became Top-Heavy
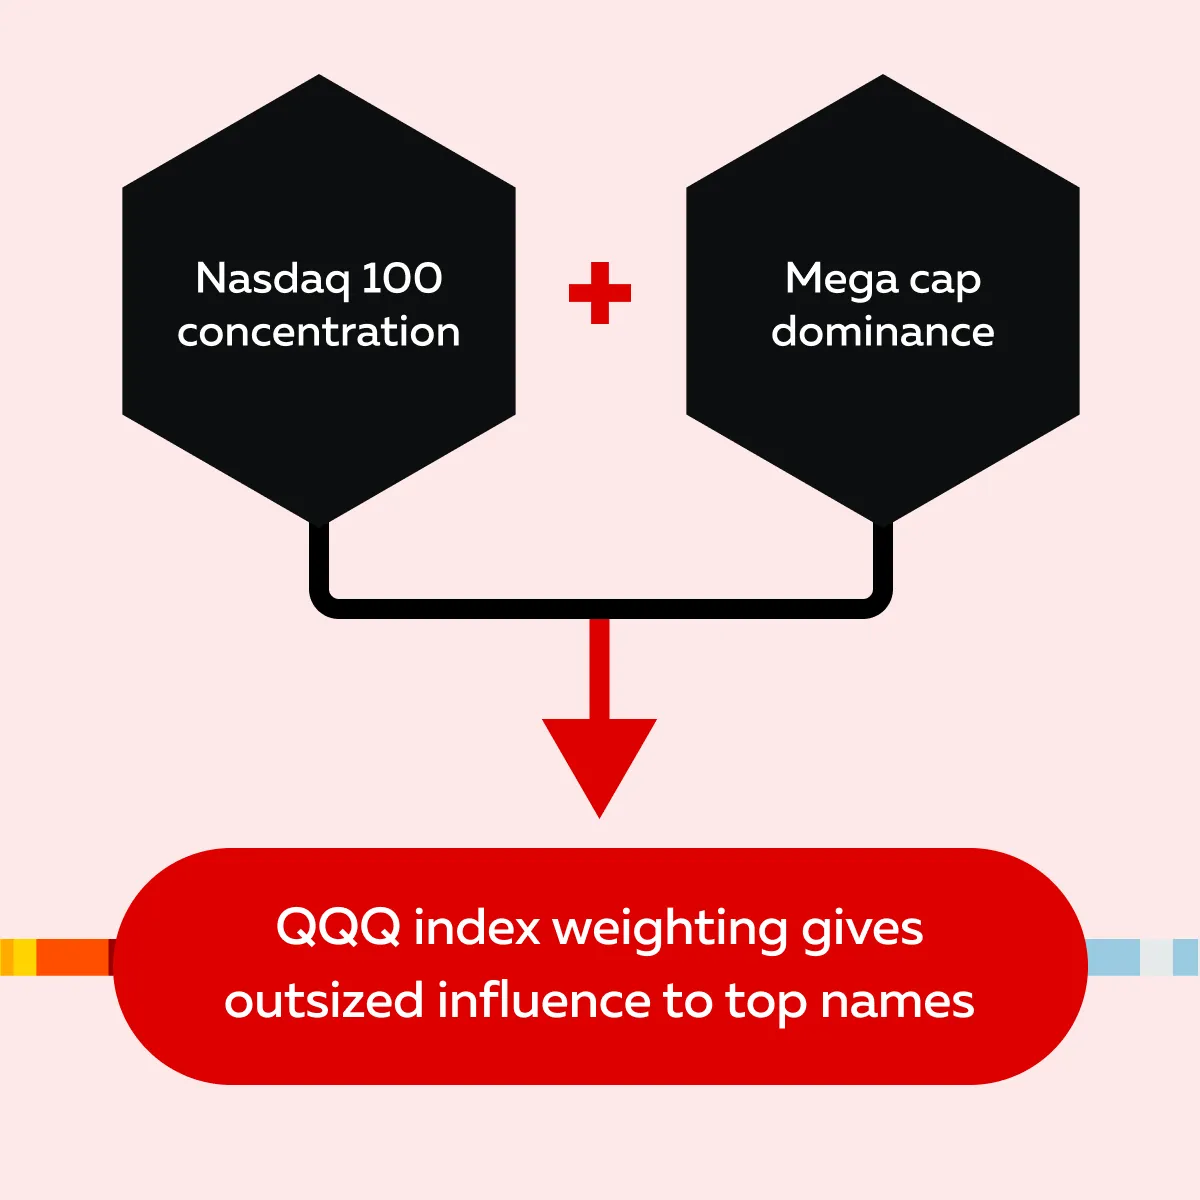
The Nasdaq 100 is built using “market-cap weighting”. Due to this, companies with bigger market values get a larger share in the index. Over time, especially after the post-2020 tech rally and the recent AI boom, a few megacap companies have grown much faster than the rest, like Apple, Microsoft, and Nvidia.
This is why the index has developed a Nasdaq 100 concentration problem. These biggest names now dominate its performance. Need something interesting? By 2023, just seven companies controlled over half of the index’s weight. For example, Nvidia’s share jumped from under 2% to more than 6% in less than two years.
Is Nasdaq noticing? Yes, the index provider sometimes does a special rebalance, like in 2023, to reduce this QQQ index weighting imbalance. However, such changes don’t erase the long-term trend.
Another Major Reason for this Megacap Dominance
There is a massive flow of investor money into QQQ and similar ETFs! Since these funds mirror the Nasdaq 100’s structure, they keep buying more of the largest stocks. This further strengthens their influence.
Now, does this also create a side effect? Read this example:
- Say a giant like Apple misses its earnings expectations.
- Consequently, it pulls down the whole Nasdaq 100.
- This happens even if the other 93 companies are performing well!
Need an Alternative to the Nasdaq 100?
Yes, the concentration risk is real. That’s why a few investors have started using the “equal-weight Nasdaq”. In this index, every stock has the same share in the index.
However, it’s not widely used because of these two key reasons:
- Equal-weight Nasdaq often underperforms during strong, megacap-driven markets,
and
- It usually comes with higher trading costs.
Why Concentration Changes Market Behavior
Do you know what happens when the Nasdaq 100 becomes highly concentrated? The performance of a few megacap stocks overshadows the rest of the index. This happens because the QQQ index weighting has an extra influence on the largest companies.
As a result, the market appears stronger or weaker than it really is! Let’s understand this concept in detail:
1. One Stock Can Move the Index
Let’s assume that in the Nasdaq, the top 5 stocks rally. Now, the index will appear to be in great shape. This can happen even if most of the other 95 stocks are flat or falling.
As a trader, if you think you’re betting on a broad market move, you could be mistaken! In reality, you are just betting on a handful of earnings results. For example,
- In 2024, Nvidia reported blockbuster earnings due to the AI boom.
- As a result, its stock jumped sharply.
- Because of its large index weighting, NQ futures surged in response.
- However, beneath the surface, most Nasdaq 100 components didn’t follow.
This clearly shows how megacap dominance creates strong headlines but weak market breadth.
2. Volatility Clusters Around Mega Events
In a top-heavy Nasdaq, market volatility often revolves around a few megacap events. The major ones are:
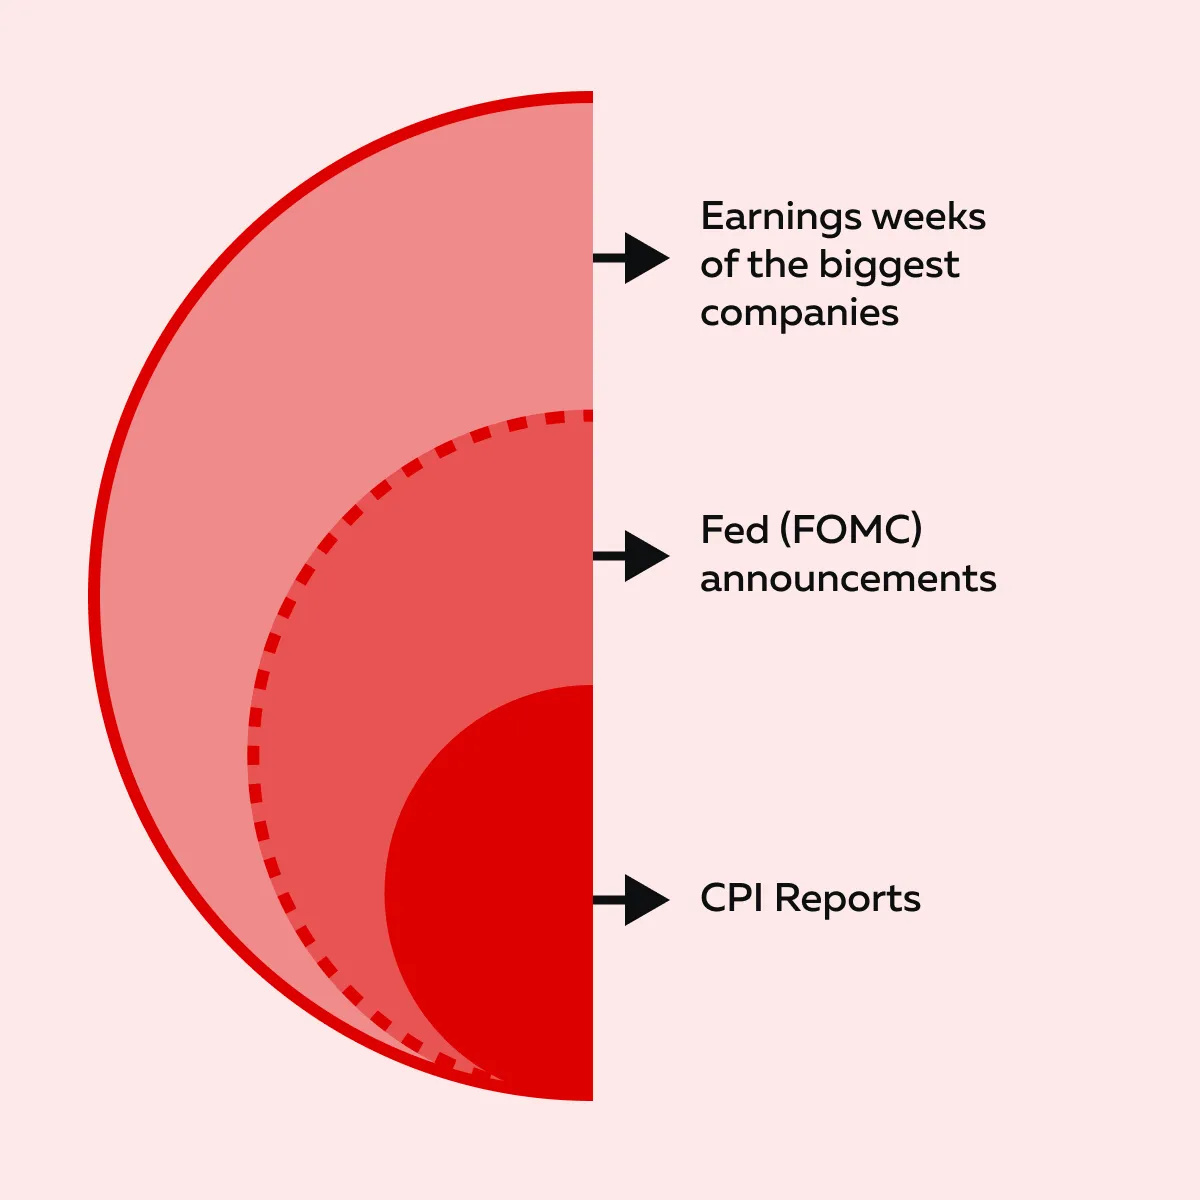
Because of the concentration of the Nasdaq 100, most traders focus heavily on these moments and try to build large positions in advance. Traders move the Nasdaq. Bookmap shows you where. → Explore Bookmap for NQ Futures
Liquidity Build-Up and Disappearance
When a major player like Amazon or Apple is about to report, liquidity in products that are influenced by the QQQ index, such as Nasdaq futures, increases sharply before the release. This happens because everyone is positioning for the possible impact!
However, right after the event, that liquidity vanishes. Such a disappearance can create sudden “air pockets”. In these pockets, prices can move sharply because of fewer resting orders on the book.
Let’s understand how this is visible on our real-time market analysis tool, Bookmap:
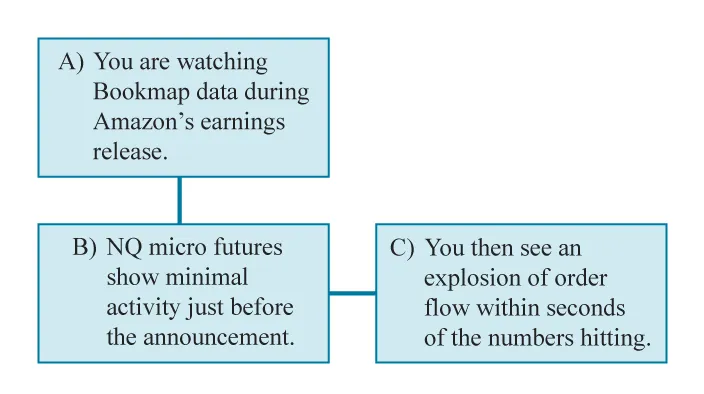
Now, what does this show? The megacap dominance concentrates market risk. Price action is influenced by only a few key names!
3. ETF Traders May Misjudge Exposure
Many retail investors buy QQQ because they think this can give them broad exposure to 100 different companies in the Nasdaq 100.
However, this is false. The harsh truth is that due to Nasdaq 100 concentration and QQQ index weighting, a huge chunk of that investment, sometimes exceeding 40%, gets tied up in just three megacap stocks. If those top three stocks face heavy selling, the entire QQQ can drop sharply, even if the other 97 companies are stable or rising.
This hidden megacap dominance becomes particularly important during a sector rotation, especially when money moves out of tech into other areas. Watch what happens when megacaps lead the charge — track order flow in real time with Bookmap.
The Risks and Opportunities for Traders
As a trader, you must realize that due to the Nasdaq 100 concentration and mega-cap dominance, index movements don’t reflect the health of all 100 companies. Thus, you need to know where the weight and liquidity are concentrated. This allows you to:
- Steer clear of misleading signals,
and
- Spot profitable setups.
Let’s understand in detail:
1. Illusion of Breadth
A rising QQQ doesn’t always mean the entire market is strong! In the Nasdaq, the index can climb just because a few megacap stocks are rallying.
So, how do you spot it? Take these two actions:
| Action I: Compare QQQ to an equal-weight Nasdaq index | Action II: Look at market internals |
|
|
Both these actions can reveal whether the rally is broad-based. Always remember that poor breadth often signals fragility. With poor breadth, even one stumble in a top stock can lead to a sharp correction.
2. Fragile Liquidity in Other Components
When attention and trading volume concentrate on the biggest names, smaller Nasdaq components suffer from thinner order books. In these less liquid names,:
- Price levels are less reliable,
and
- Moves are more erratic.
If you’re trading non-mega-cap stocks in the Nasdaq 100, you must account for this increased volatility.
3. Megacap Order Flow = Index Direction
The QQQ index weighting system is dominated by a few giants. The order flows in AAPL, NVDA, or MSFT often dictate the direction of the entire index. For example,
- Say a large passive buy order in Apple gets absorbed, and selling begins.
- In that scenario, NQ futures may follow downward, even if the smaller names are stable.
To spot such trends, you can use our avant-garde market analysis tool, Bookmap. Watch heatmaps and volume dots of these leaders. You can get early clues about the index’s next move.
How to Trade in a Concentrated Nasdaq Environment
Till now, you must have understood that trading in a concentrated Nasdaq means a few giant companies can steer the whole market. Let’s see what happens due to this:
Want to trade smarter in such an environment? Below are some steps you can follow to spot real participation:
1. Focus on What’s Driving the Index
Don’t trade the index alone. Instead, trade what actually moves it! Adopt these four strategies:
| S. No. | Strategy | Benefit |
| I) |
|
|
| II) |
|
|
| III) |
|
|
| IV) |
|
|
Want to see how large players move inside the Nasdaq microstructure? Watch liquidity shifts in real-time with Bookmap.
2. Use Order Flow to Detect Real Participation
Utilize our advanced order-flow tool, Bookmap, to analyze whether a move is driven by genuine buying or selling or just thin liquidity. On Bookmap, you can detect real participation by doing the following,
| Do this on Bookmap | Why do this? |
|
|
|
|
|
|
|
|
3. Stay Nimble Around Earnings and Events
Events are magnified in a concentrated index! Sometimes, they are almost like single-stock events. Keep these pro tips in mind:
- Size down before big megacap events. With megacap dominance, trading NQ during Apple or Nvidia earnings is basically trading that stock’s reaction.
- Consider using defined-risk trades like option spreads.
- Avoid carrying large directional overnight risk into macro events, FOMC, or clustered earnings weeks. Why? That’s because volatility can spike and liquidity can vanish after the print.
Lastly, if you prefer clearer setups, wait for 10 to 30 minutes after a major release for the initial washout. After this, trade the established direction!
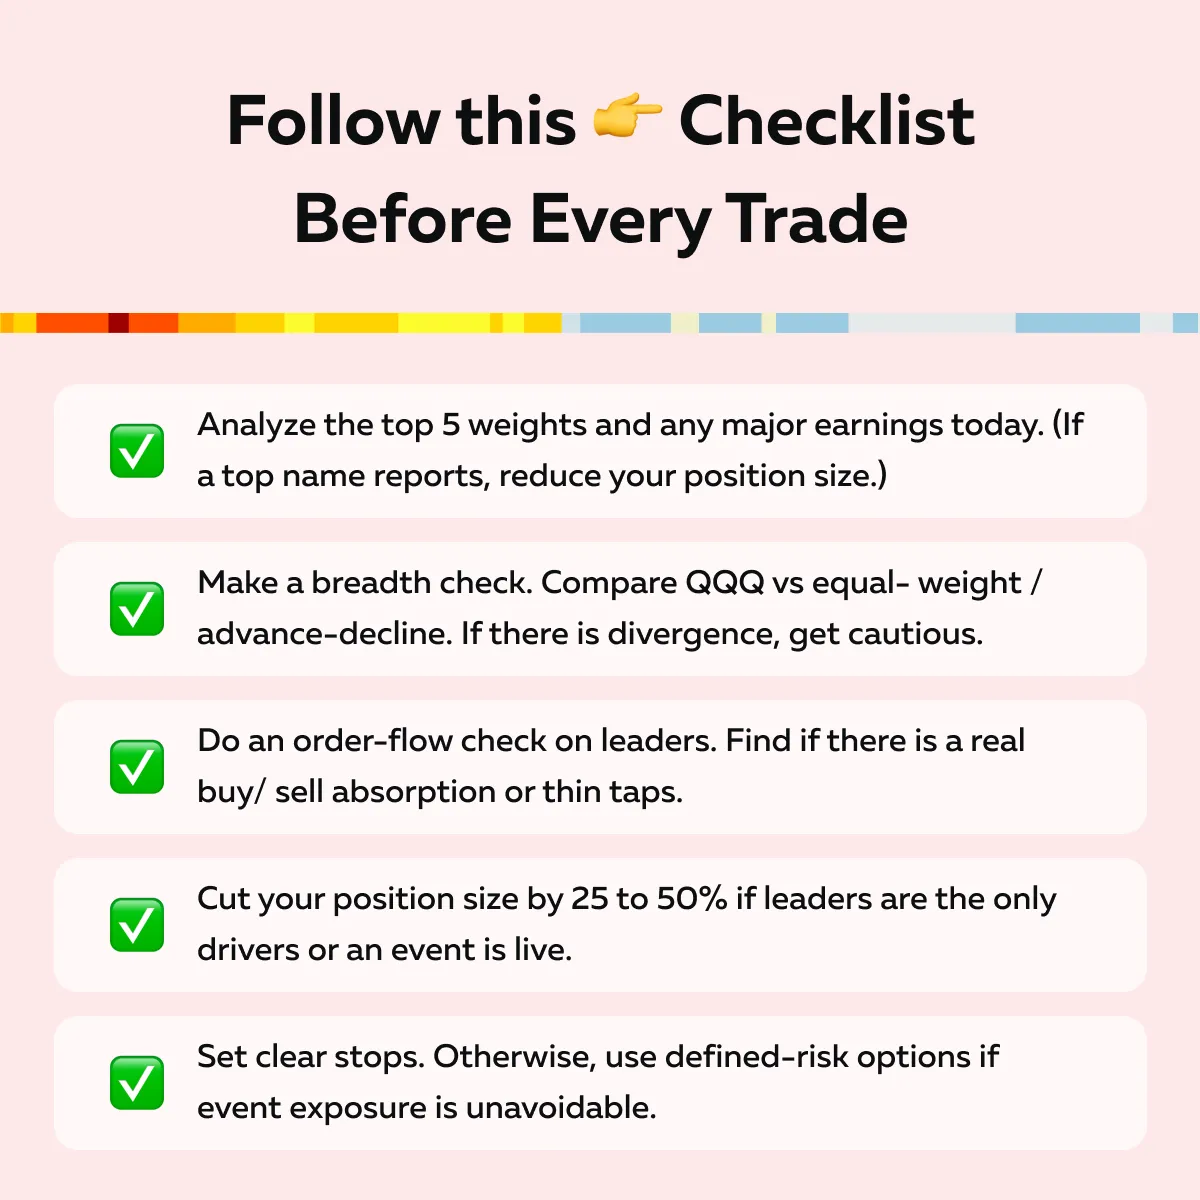
Need a checklist you can follow before every trade? See below:
Conclusion
The Nasdaq 100 may list 100 companies! But in today’s Nasdaq, only a few megacap stocks dictate the entire index’s direction.
As the Nasdaq 100’s concentration grows, movements in NQ and QQQ often reflect the action of these heavyweights rather than that of the broader market.
For traders, this knowledge is highly important. It allows you to read market signals more accurately. Also, you can manage risk better and do not mistake narrow leadership for broad strength.
Want to gain a market edge? Our avant-garde real-time market analysis tool, Bookmap, makes this visibility possible! Don’t just follow QQQ. See what drives it with real-time order flow in the top Nasdaq names. → Start Trading Smarter
FAQs
1. Why is the Nasdaq 100 so concentrated?
That’s because it’s market-cap weighted! Bigger companies get more influence in the index. As a trader, you must be aware that in recent years, giants like Apple, Microsoft, and Nvidia have grown much faster than others. Thus, their share of the index has ballooned.
This has led to “megacap dominance”, where a handful of stocks have outsized control over the entire Nasdaq 100 performance.
2. Does this affect QQQ’s performance?
Yes! QQQ tracks the Nasdaq 100. Thus, if the largest stocks fluctuate sharply, QQQ moves the same way.
Even if most of the other companies in the index stay flat, big swings in just a few megacaps make QQQ appear stronger or weaker. This sometimes gives you a false perception of the market.
3. Isn’t there a cap on how much weight one stock can have?
There are limits, but they’re not strict enough to stop Nasdaq 100 concentration. The index provider sometimes does a special rebalance to reduce extreme weight in the biggest stocks. However, this is rare!
Over time, strong growth in megacaps lets them reclaim dominance in the index weighting.
4. Can Bookmap help me trade NQ more effectively?
A big yes! In a top-heavy Nasdaq, NQ futures often follow the order flow of the biggest stocks, such as Apple and Microsoft. Our marketing tool, Bookmap, lets you visualize:
- Real-time buying and selling pressure,
- Large hidden orders, and/or
- Liquidity changes in these leaders.
In this way, you can spot these signals early and anticipate when a megacap is likely to move the index. When you trade with this insight, you gain a stronger edge and a better chance at executing profitable trades.
Sign Up Now