See low liquidity more clearly in real time.
Compare plans to access deeper market visibility for low liquidity.
Education
December 26, 2025
SHARE
How to Trade Low-Liquidity Sessions with Order Flow
 For most traders, low-liquidity sessions feel like a completely different world. Why? The pace slows, the price drifts aimlessly, and familiar patterns stop behaving the way they usually do. In such conditions, even a single aggressive order can move the price several points.
If you are a trader who depends on rhythm and price levels, it can feel confusing and almost random. Relatable? But underneath this, there’s always a pattern. Even in thin conditions, liquidity shows when real participants are active, when they’re passive, and when they’re just waiting on the sidelines.
Understanding this “hidden rhythm” is what makes you a successful trader. Don’t want to get caught chasing noise? Read this article to learn how order flow behaves in low-liquidity sessions, the common traps that catch traders off guard, and how to adapt your strategy to trade with confidence when the market goes quiet.
What Low Liquidity Really Means
For most traders, low liquidity just means there are fewer trades. But that’s not true. In reality, it means the market’s structure is thin. As a trader, when you’re trading low liquidity markets, there aren’t enough buy and sell orders resting in the order book to absorb new activity smoothly.
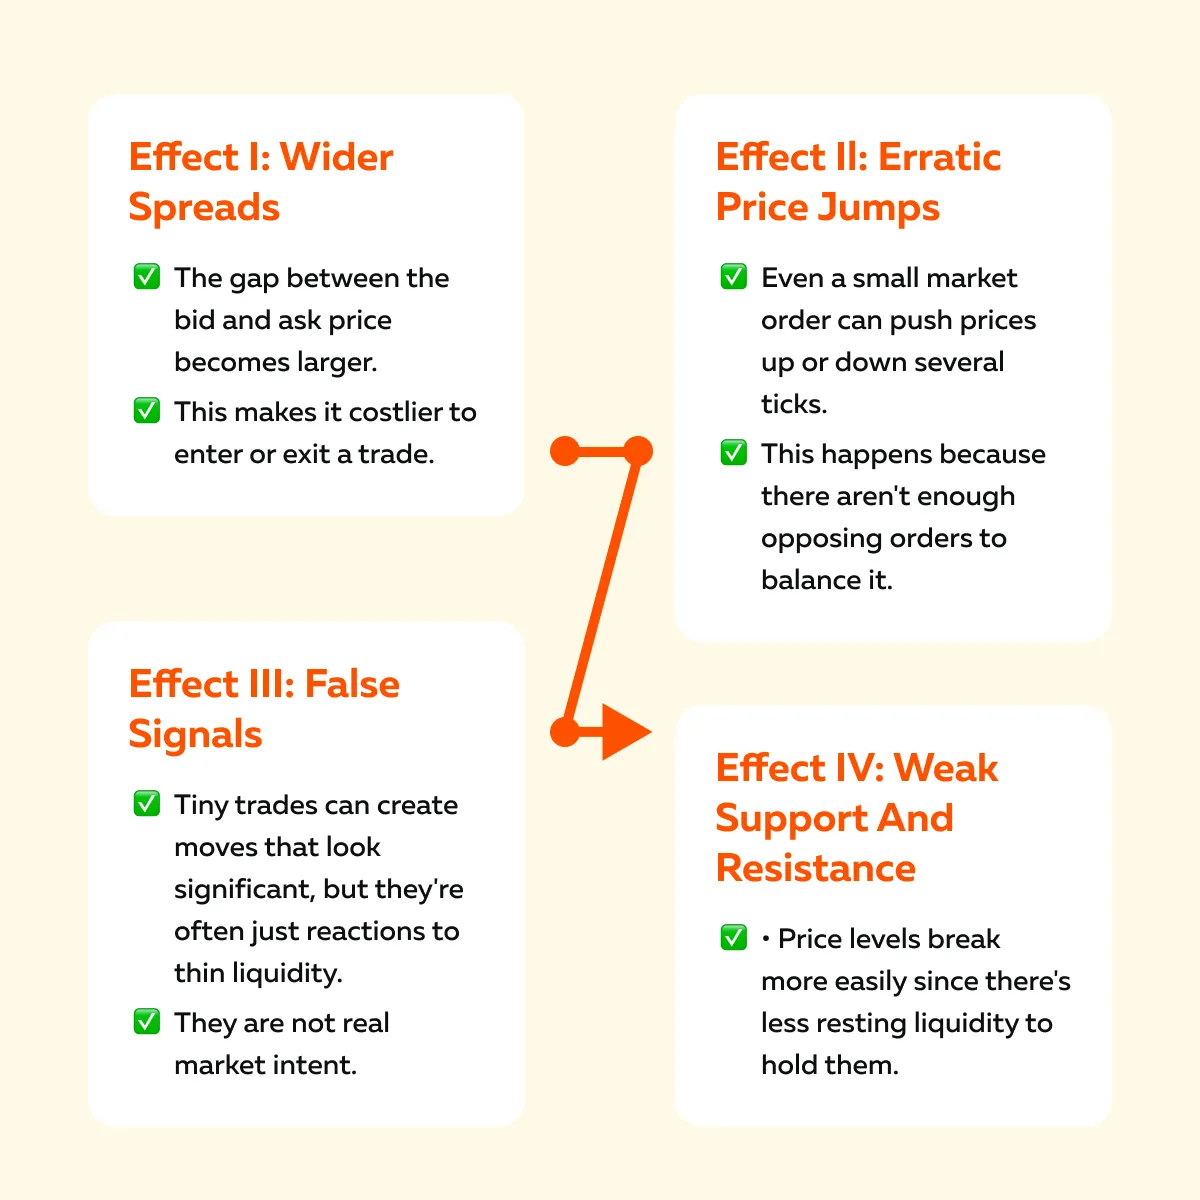
Now, this creates several effects:
For more clarity, let’s study an example:
- In ES futures (E-mini S&P 500), liquidity changes drastically depending on the trading session.
- During regular U.S. trading hours (RTH) (roughly 9:30 AM to 4:00 PM EST), the ES order book is deep.
- You might see 10,000 to 20,000 contracts resting across multiple price levels.
- If someone places a 100-lot market order, it gets absorbed almost instantly because there are plenty of buy and sell orders waiting.
- The price might move by just 0.25 to 0.5 points (barely noticeable).
Now, if we talk about low-liquidity sessions, such as the Asian session (around 7:00 PM to 11:00 PM EST) or after the U.S. close, the order book becomes much thinner. There might be only 500 to 1,000 contracts spread across the same range. In this environment, a single 100-lot market order represents a significant portion of available liquidity. It can easily push the price 3 to 5 points (12 to 20 ticks) in seconds.
The interpretation? As Tom B. from TraderLab explains, when you’re trading low liquidity, even small trades can cause exaggerated price moves. The market appears more volatile, not because demand or supply suddenly changes, but because there are fewer participants to balance each order.
Adapt your execution to low-liquidity behavior using Bookmap’s order flow → Compare Packages.
Why Low-Liquidity Markets Behave Differently

When you’re trading low liquidity markets, the behavior of price changes because the main players are missing. During these quiet periods, several market participants pull back their activity, such as:
- Institutional traders,
- Market makers, and
- Liquidity providers.
As a result, the balance of power shifts! And that changes how the market moves. Let’s see what usually happens:
| Retail Dominance | Algorithmic Probing | Passive Drift |
|
|
|
To further your understanding, read this example:
- Let’s say it’s 1:00 AM New York time.
- You’re watching ES futures during the Asian session.
- At this hour, liquidity is thin.
- There might be only 500 to 800 contracts resting on each side of the order book.
- Because of that, the price can drift slowly upward [maybe 10 to 20 ticks (2.5 to 5 points)].
- This can happen even though there’s no strong buying volume behind it.
- It just moves because there’s not enough selling pressure to stop it.
Then, around 3:00 to 4:00 AM EST, when the London session opens, large institutional traders and liquidity providers come back online. The order book suddenly deepens, and now it is showing 5,000 to 10,000 contracts at each level.
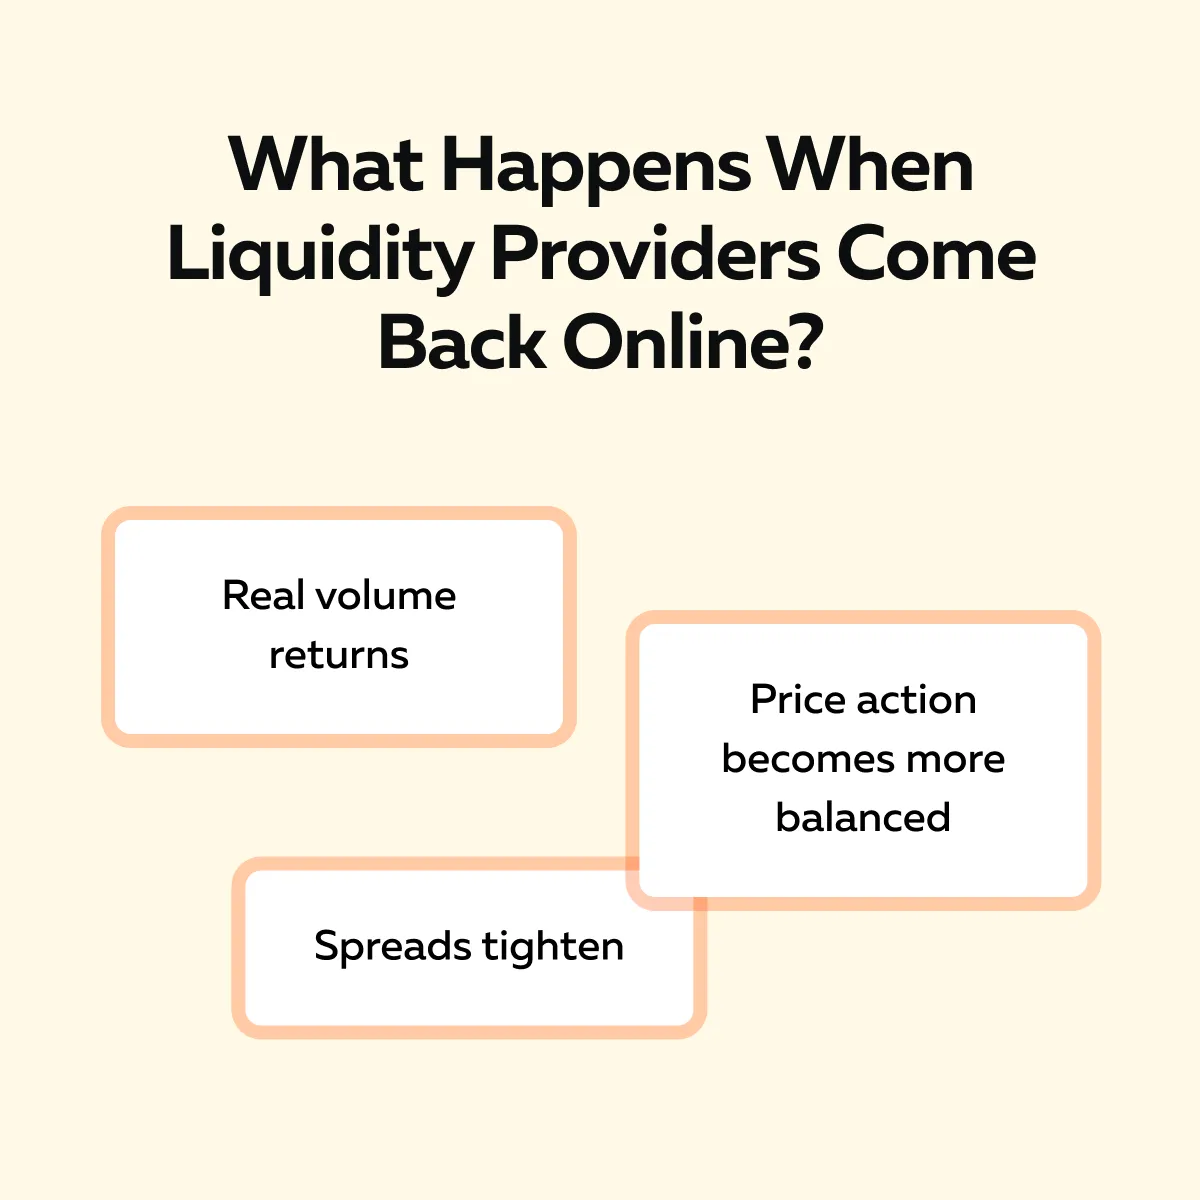
That’s when you see whether the earlier move was real or just a low-liquidity drift. If it were fake, the price quickly snaps back once genuine participation enters.
So, what can you learn? Low-liquidity markets don’t eliminate opportunity, but they demand a different mindset. Additionally, confirmation signals can’t rely solely on volume or large candles. You need to read the flow and context to understand what’s real and what’s just noise.
How Order Flow Reveals True vs False Moves
When you’re trading low liquidity markets, almost every price move looks big. But realize that not every move is real. How can you differentiate between them? You can start using order flow. It allows you to see what’s truly happening behind the candles by showing who is actually buying or selling.
Below are four signs that you can use to separate genuine intent from fake movement:
- Absorption:
- Let’s say you see multiple bursts of selling, yet the price doesn’t drop.
- Now, it means someone is quietly buying and absorbing the pressure.
- This is a sign of real strength, even in thin conditions.
- Spoofing:
- Sometimes, large orders appear in the order book and then vanish before execution.
- These are often tricks to provoke emotional reactions or fake momentum.
- Delta Without Follow-Through:
-
-
- When aggressive buying or selling shows up in delta (volume imbalance) but the price doesn’t continue in that direction, it’s usually a false move.
- That’s not true conviction.
-
- Liquidity Shifts:
-
- When new liquidity starts rebuilding at key levels, it often signals that genuine interest is returning.
- Also, there are high chances that the next move may have real backing.
For example, on a Bookmap chart, you might notice a 40-lot iceberg order. It is quietly absorbing multiple sell orders in an otherwise empty book. On a slow and low-liquidity day, even that small clue can tell you where real intent lies long before price reacts visibly.
Trade quieter sessions with clarity, not guesswork → Compare Plans
Adjusting Strategy and Expectations
Do you know the secret to success when you’re trading low liquidity markets? For most traders, it is about doing more. But in reality, it is about doing less, but professionally!
Below are the five techniques that can help you adapt effectively:
| Techniques | Meaning |
| Lower Your Trade Frequency |
|
| Reduce Your Position Size |
|
| Broaden Your Targets |
|
| Trade During Session Overlaps |
|
| Be Patient |
|
For example, traders often avoid pre-market entries unless they see an active participant providing liquidity. They wait for confirmation from the order flow, not just price movement.
Learn how to identify real intent in thin markets → Compare Packages
Case Study: Overnight Drift and the False Break

To gain more clarity, let’s look at a common example of what happens when you’re trading low liquidity markets.
-
- Let’s say the ES futures are trading quietly overnight.
- There’s very little resting liquidity!
- For those unaware, it means not many buy or sell orders are sitting in the book.
- Due to this thin structure, the price drifts slowly upward by about 20 ticks.
- To many traders, this appears to be the start of a breakout, prompting breakout buyers to jump in.
- But they might be wrong! As soon as they enter, liquidity disappears.
- There’s no real absorption or follow-through from larger players.
- With no depth to support the move, the price quickly reverses and falls back down.
- The result? It traps those who chased the breakout.
Now, later, when real volume returns during the London or New York session, genuine buyers step in. They rebuild liquidity at those same levels, and this time the move holds and pushes higher.
As a trader, you can clearly learn from this scenario that context and timing matter more than direction in thin markets. When trading low liquidity, you can’t rely on every breakout or sharp move. Instead, you have to confirm whether real participation is behind it.
Conclusion
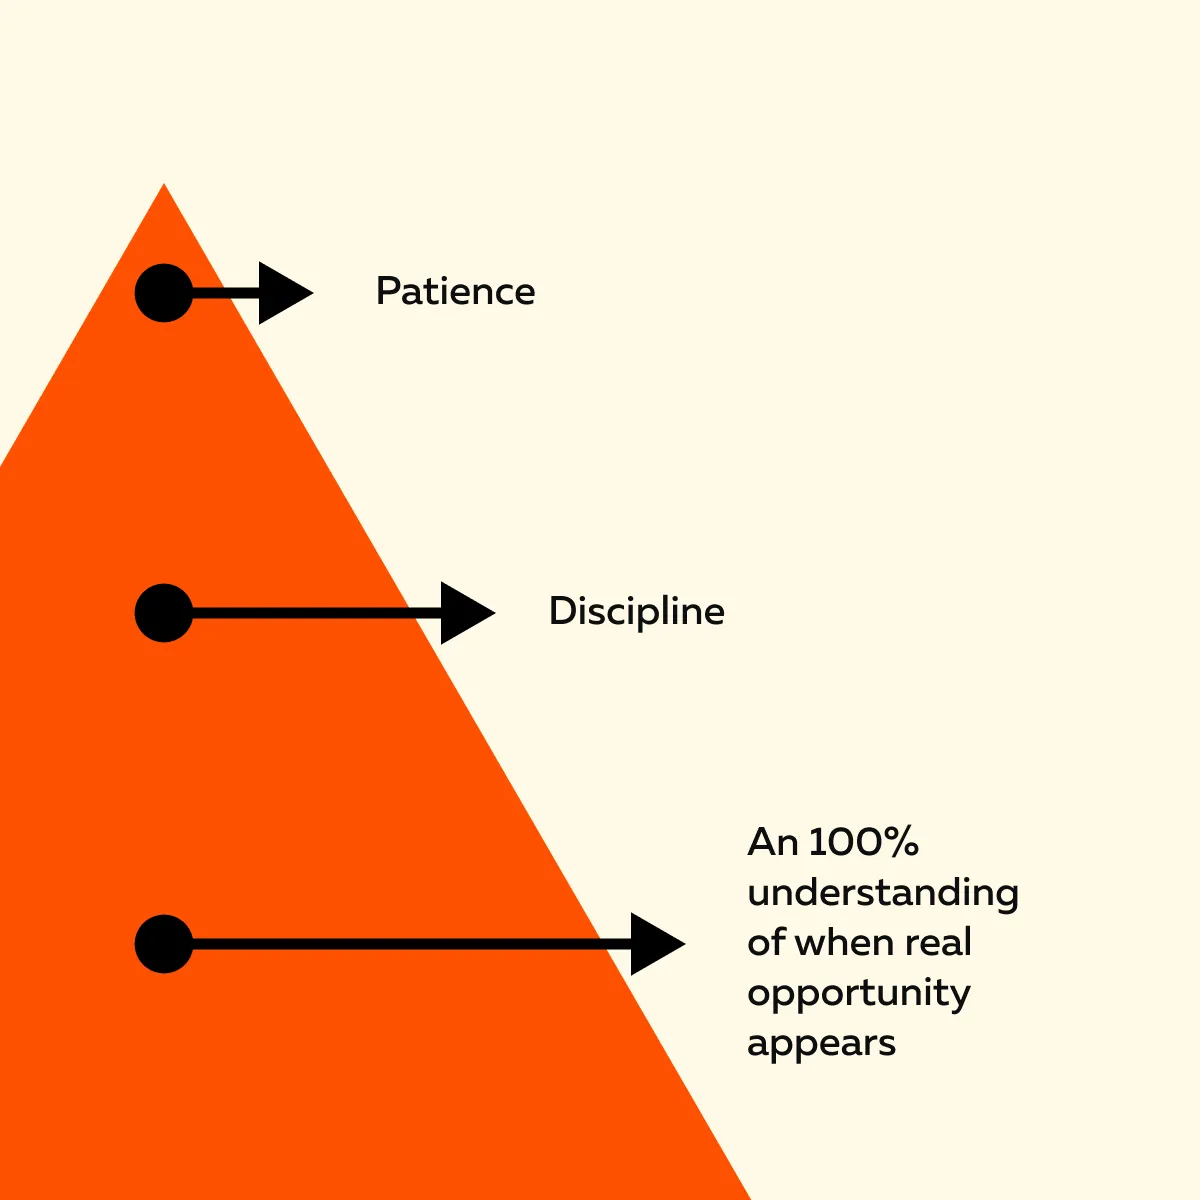
Now you know that trading low-liquidity sessions is about patience, control, and awareness. When the order book is thin, small details can tell big stories, such as:
- A minor absorption,
- A brief delta shift, and
- A quiet rebuild of liquidity.
All these can signal real intent long before price reacts. So, what should be your ideal approach? Instead of chasing every move, try to read the order flow. And, wait for moments when genuine participants step in.
Want to make this easier? With Bookmap, traders can visualize liquidity, volume, and order flow in real time. This visualization allows you to separate random moves from real participation. Compare Packages to learn how Bookmap reveals market intent, even in the quietest sessions.
FAQs
1. When is liquidity typically lowest?
Liquidity is usually lowest during:
- Overnight sessions,
- Pre-market hours, and
- Holidays or major market events.
During these times, fewer participants are active, and there are fewer resting buy and sell orders in the book. This scarcity of orders makes the price more sensitive. As a result, even small trades can fluctuate prices sharply because there’s not enough depth to absorb them.
2. Can you still trade profitably in low-liquidity markets?
Yes, but you must have a strong mindset. In low-liquidity markets, focus on quality over quantity. You should:
- Use a smaller size to manage slippage risk,
- Wait for clear signs of real participation, and
- Avoid chasing quick price moves.
Always remember that profit comes from timing and patience, not from frequent trades. Also, the best setups often appear when liquidity briefly returns.
3. Why do false breakouts happen more in low liquidity?
In low-liquidity markets, the order book is thin. There aren’t enough buy or sell orders to resist sudden moves. This scarcity allows even small bursts of buying or selling to push prices through key levels. The result? Most traders start to interpret it as a “breakout”.
But since real traders aren’t behind the move, it quickly fails and price reverses. This traps late participants.
4. How does Bookmap help during slow sessions?
Bookmap gives you a visual view of the market’s depth and activity in real time. You can see:
- Where liquidity is building,
- Where it disappears, and
- When genuine buyers or sellers enter.
This allows you to spot false moves and avoid traps. Also, this knowledge lets you wait and rightly identify “true participation” before taking a trade. This is particularly valuable when trading low liquidity sessions.
Sign Up Now