See price more clearly in real time.
Compare plans to access deeper market visibility for price.
Market Analysis
February 4, 2026
SHARE
Inside the Auction: What It Means When the Market Rejects a Price

Have you ever been to a “live auction”? That’s how the market works. Every small price fluctuation happens because buyers and sellers are constantly testing each other. How?
- Buyers push prices higher to find sellers
while
- Sellers drive prices lower to find buyers.
As a result, the price keeps moving until one side finally pushes back. And that pushback is where market “price rejection” begins. It happens when price tests a new level but fails to hold there. Why? That’s because instead of continuing, the price meets strong absorption, fading momentum, and disappearing liquidity.
So how can you, as a smart trader, handle this market situation? You must learn to spot rejection early. Through it, you can identify high-probability reversals, pinpoint session highs and lows, and define range boundaries.
Read this article to learn how price rejection functions within the auction process, how it shows up in order flow, and how to trade it using Bookmap’s liquidity maps and delta.
The Market as an Auction
As a trader, what should you think of the market? It is a “live auction” that never stops. Let’s see what happens in it:
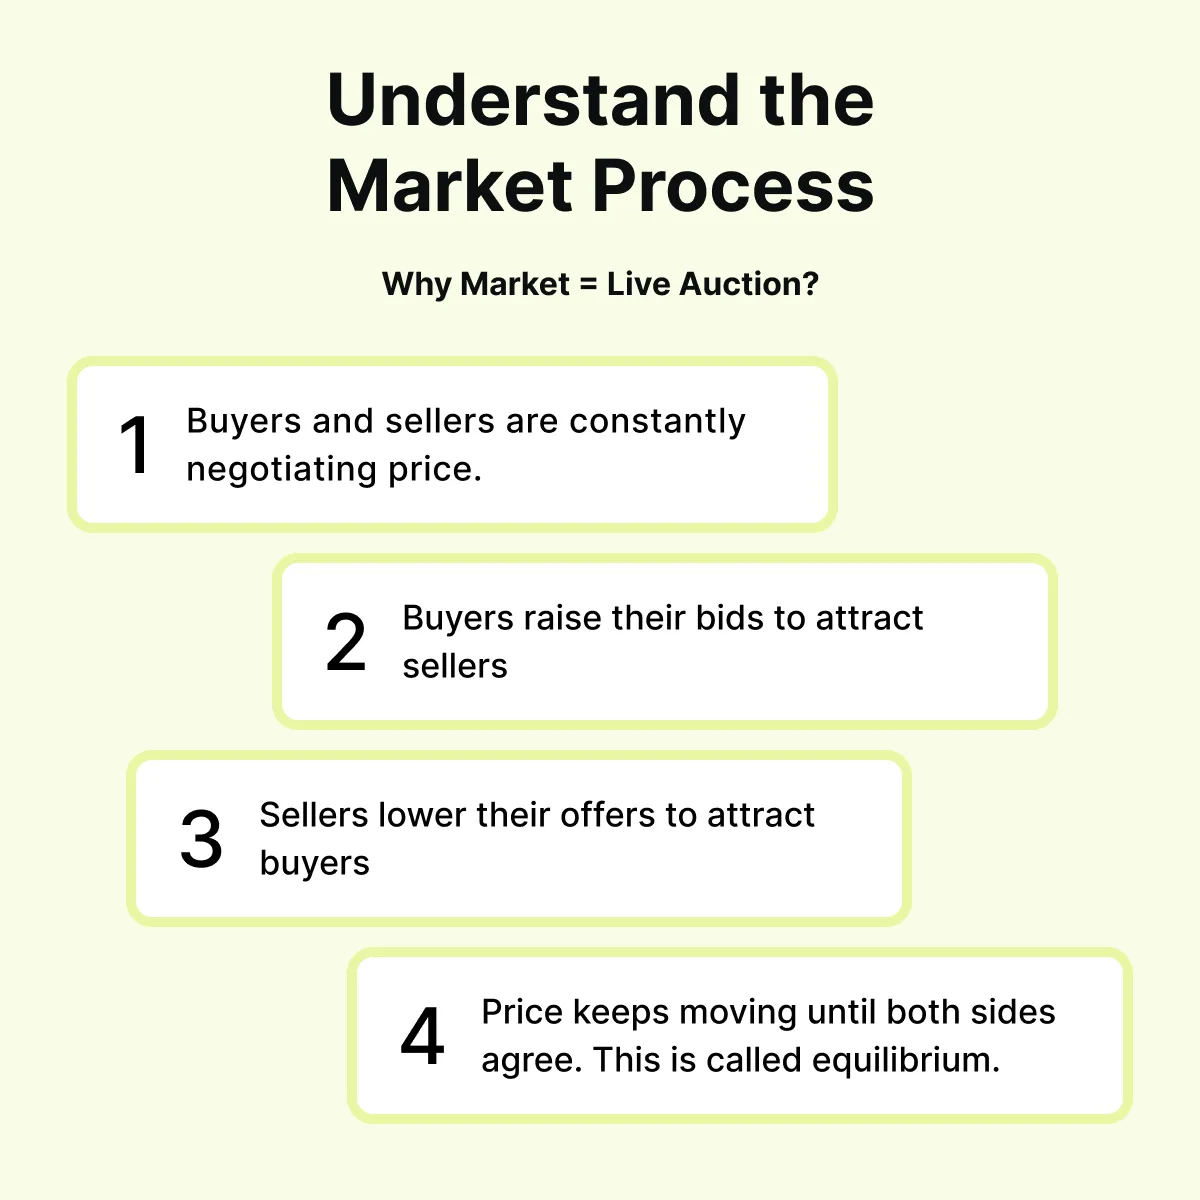
This process happens all day! When buyers and sellers are comfortable trading at certain levels, those prices become “areas of acceptance”. In contrast, when one side strongly disagrees and refuses to trade, the price moves away. This move is what we call “market price rejection”.
For more clarity, let’s study an example:
-
- On an ES chart, you find that the price breaks above a previous range.
- This suggests buyers are in control.
- But then sellers step in aggressively.
- They push price back into the range on strong volume.
- Now, this shows that the higher level was rejected.
- The market tested the price level and decided the value belonged lower, not higher.
What Price Rejection Actually Means
Price rejection is the market’s way of saying, “This price doesn’t make sense right now.” It happens when the market tries to move into a new area but fails because traders do not support that price. Interpretation? An attempted breakout gets rejected.
This process can be seen clearly through various order flow signals. Check them below:
| Order Flow Signal | What You See in the Market | Interpretation |
| Liquidity Absorption | Price trades into a large cluster of buy or sell orders, but stops moving forward. |
|
| Exhaustion (Delta Stall or Flip) | Aggressive buying or selling slows down, stalls, or reverses direction. |
|
| Liquidity Pullback | Resting orders disappear after price tests a level. |
|
| Speed Reversal | Price moves quickly away from the tested area. |
|
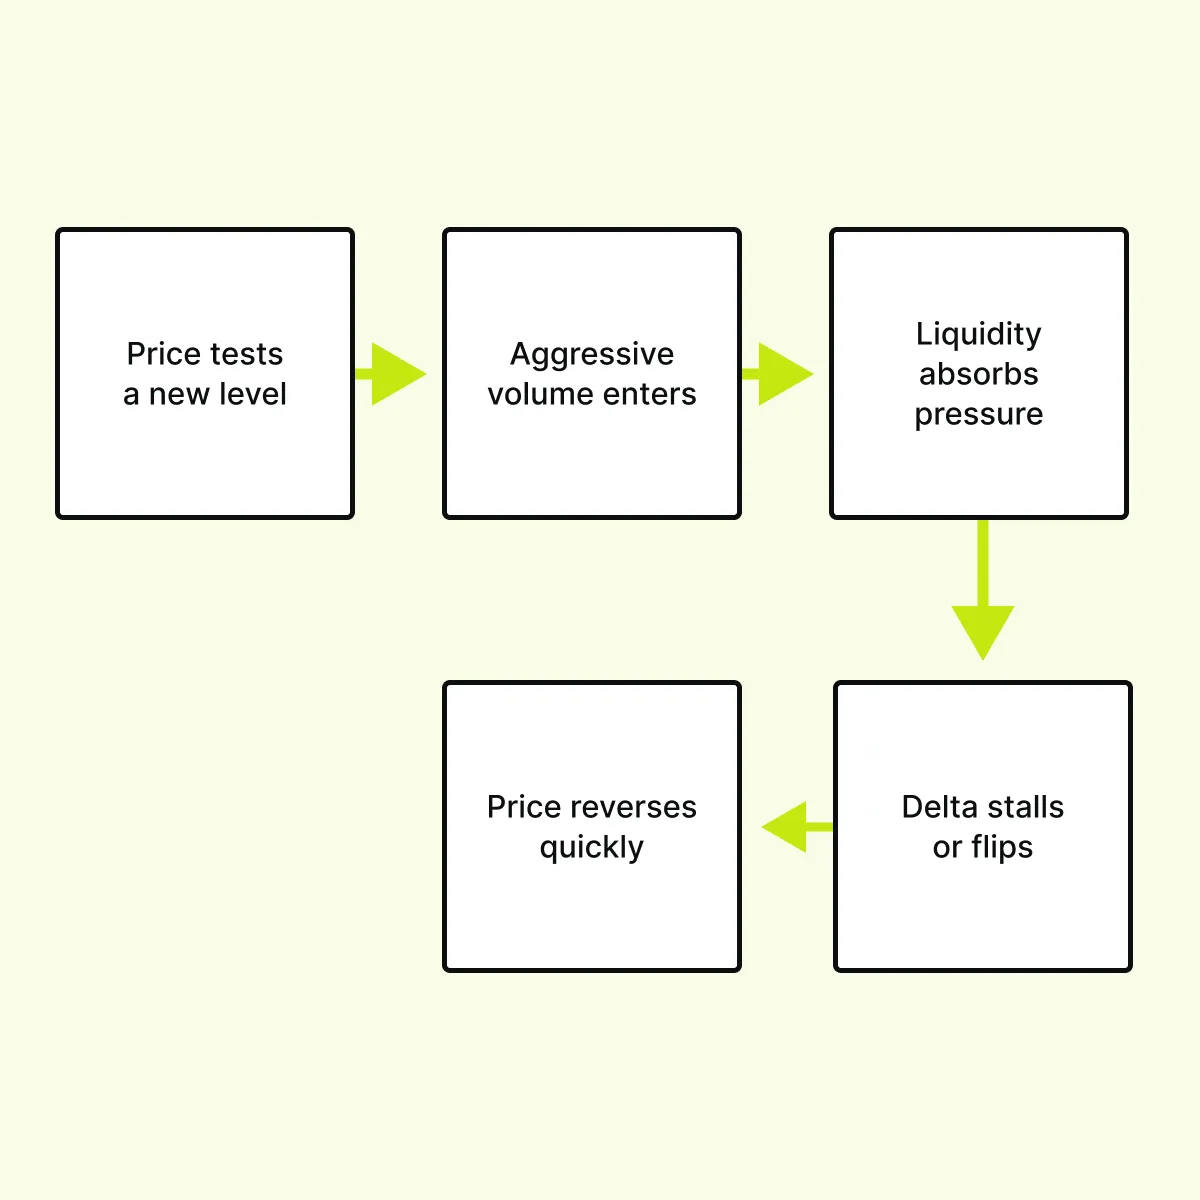
For a better understanding, check out this process flow and the subsequent example:
Example,
- Let’s say price pushes into the 4700 level.
- Thousands of contracts trade aggressively at the offer.
- Then, instead of breaking through, the price drops immediately.
- Why? That’s because sellers absorbed the buying pressure, “stacking” the offer and refusing to let the price move higher.
- Now, that level becomes a market price rejection zone.
Spot real rejection zones before the crowd reacts → Compare Packages
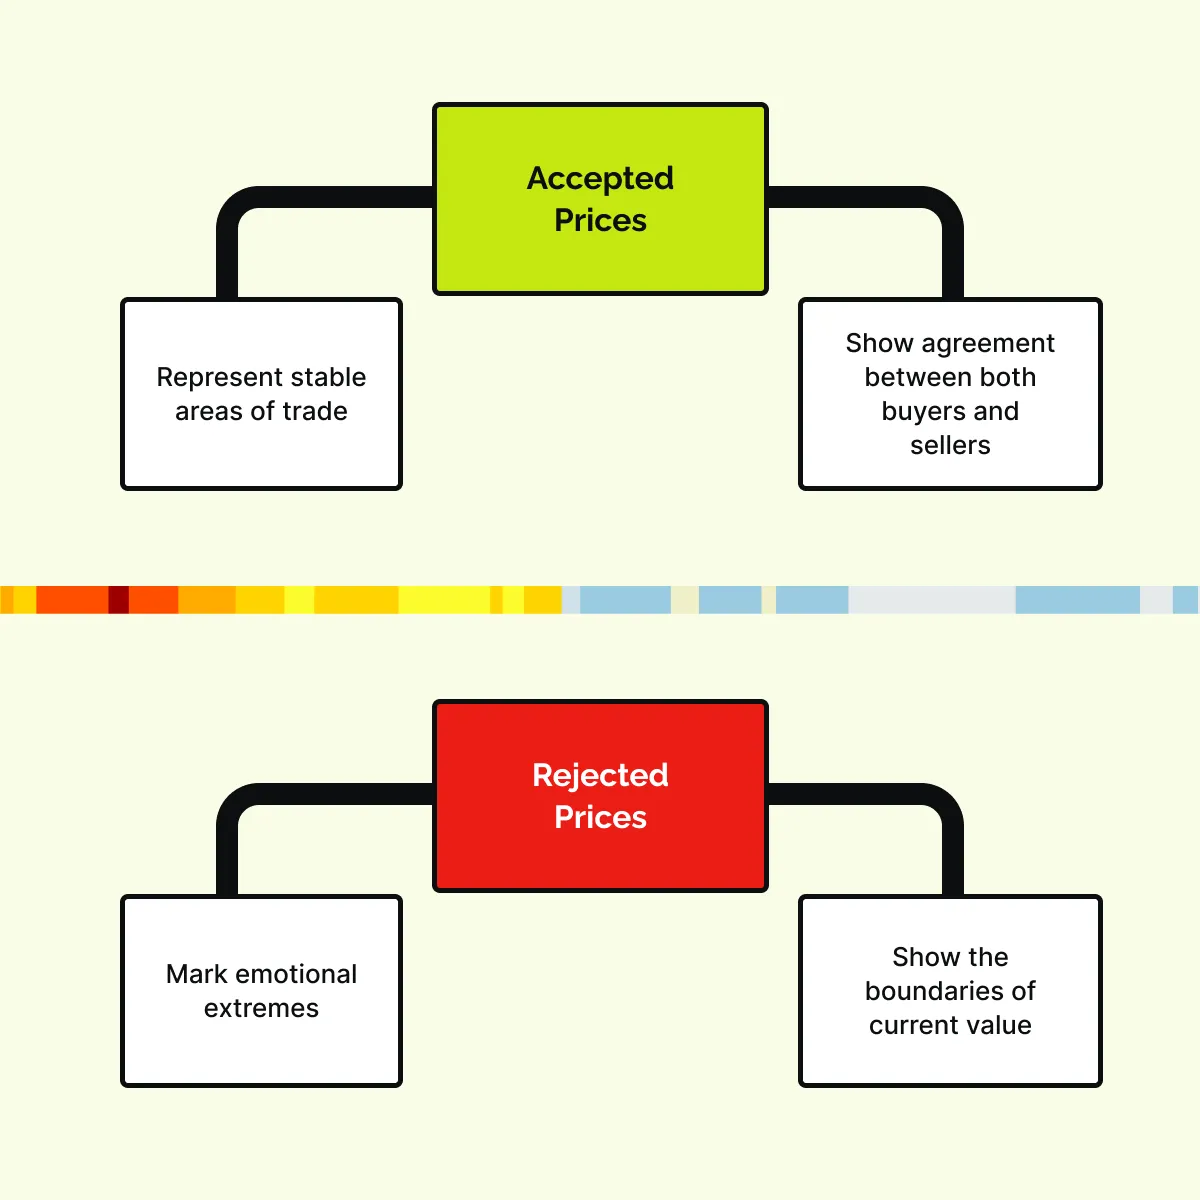
Acceptance vs Rejection: The Core of Market Structure
Did you know? The market is constantly deciding whether a price is accepted or rejected. And this decision influences future movement. Let’s see how:
| Acceptance | Rejection |
+
|
+
|
Okay, so what happens over time?
For example,
- Let’s say during an intraday trend, the price makes an aggressive move in one direction.
- Price reaches an extreme.
- It shows a strong market price rejection.
- So, what does this mean?
- It shows that participants are no longer willing to trade at those levels.
- Sellers or buyers absorb the pressure, and the price quickly rotates away.
This rejection is important because it usually happens when momentum is exhausted. Usually, that rejected level becomes the session high or low. Learn how to read auction behavior through liquidity and delta → Compare Plans.
Reading Rejections Through Order Flow
Rejections usually follow a sequence that repeats across markets. Want to easily see that sequence? You can start using Bookmap’s heatmap. Let’s see what you can observe step-by-step:
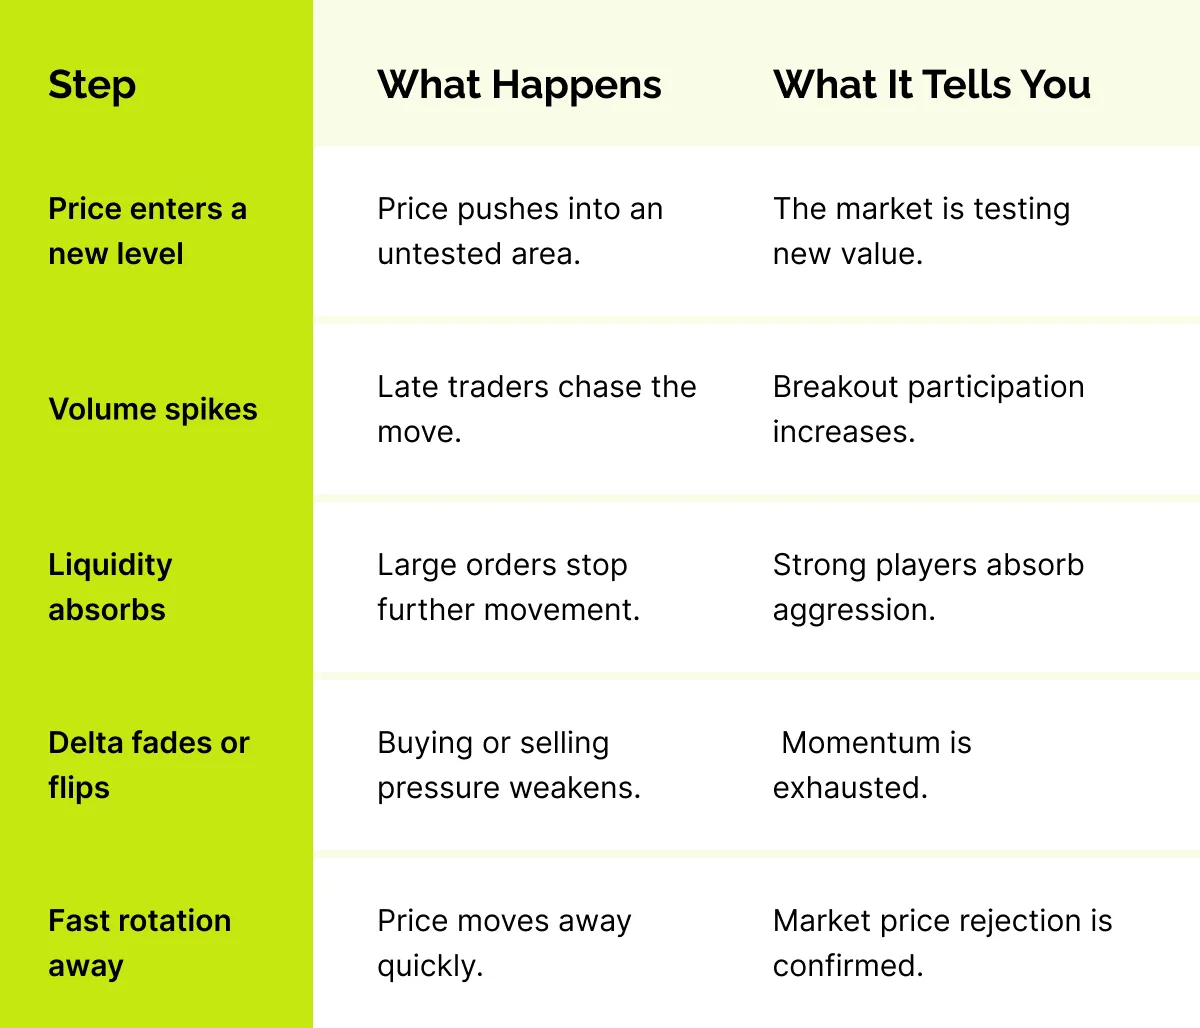
On Bookmap, all these steps look very visual.
- You will see strong liquidity sitting at a price level and not moving.
- At the same time, many volume dots appear as traders aggressively buy or sell into that level.
- However, even with all that activity, the price cannot go further!
- Soon after, the price quickly moves in the opposite direction.
- This visual pattern shows market price rejection happening in real time.
So, what can you, as a trader, do next? Mark these rejection zones on your chart. That’s because they serve as important reference points in future sessions. Realize that the market always remembers where it clearly said “no.”
How to Trade Rejections with Context
For several new market participants, trading rejections are about fading every price move. But that’s a myth! The key is “confirmation”. Ideally, you should wait for the order flow to show that the move is failing. And this can be spotted by looking at these three signs:
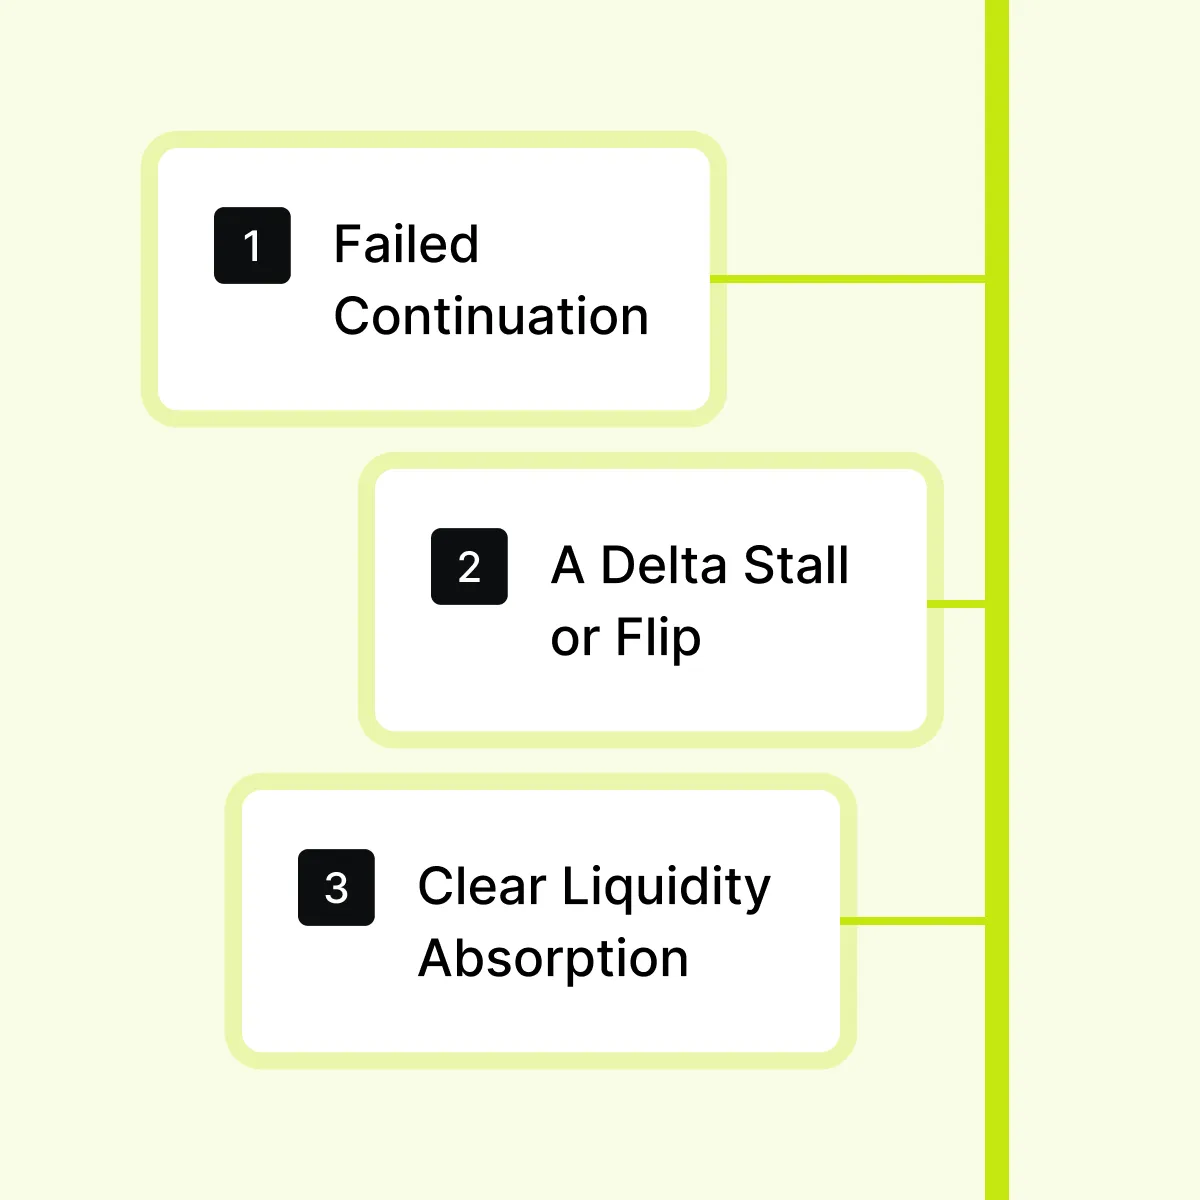
These signals tell you the market is likely forming a “market price rejection” rather than just a small pullback. Additionally, you must manage risk and understand the true market context. Let’s learn about both in detail.
Risk Management is Highly Important
Always define your risk clearly. A common approach is to place your stop just beyond the rejected area. Now, let’s say price trades back through that level and holds. This means:
- The rejection has failed.
+
- Your trade idea is no longer valid.
Now, keep in mind that previous rejection levels are “valuable targets”. When price returns to these zones, reactions could be fast and decisive. That’s because traders remember those areas.
Lastly, Context Matters Most
Rejections carry more weight when they occur at:
- Prior highs or lows,
- Session extremes, and
- Major liquidity clusters.
These areas are highly important because many traders are already watching them. When market price rejections occur at these levels, it signals strong disagreement over value.
For more clarity, let’s study an example,
- The ES price reaches the highest level of the day.
- Buyers try hard to push the price higher.
- However, sellers absorb those buy orders.
- As a result, the price does not move up.
- Then, buy orders start disappearing.
- This happens because there is less interest at that level.
- Soon after, selling becomes stronger, and delta turns negative.
So, what does this scenario tell us? The market rejected that high. A short trade makes sense here, with a stop just above that rejected level.
Case Study: Failed Breakout and Rejection Confirmation

Do you know when the market reveals its true intent? Usually, it is not during the initial breakout, but during what happens after it. A failed breakout is one of the most reliable ways to identify market price rejection, particularly when you have order flow data to confirm the “trap.”
Let’s see how this process happens step by step through a hypothetical example:
- Price Expands Higher:
- After a period of consolidation, let’s assume that price breaks above a key level, e.g., 4620.
- It signals a potential breakout.
- Late Participation Appears:
- Volume + delta spike
- This happens because breakout traders rush in.
- They are expecting continuation.
- Liquidity Holds Firm:
- Despite aggressive buying, large sell orders remain in place.
- This shows liquidity absorption, where sellers quietly absorb the demand.
- Momentum Fades:
- Delta begins to slow down.
- After that, it flips negative.
- This signals exhaustion from buyers.
- Rejection Confirms:
- Price drops back below the breakout point (e.g., 4615) and stays there.
- This shows the market refuses to accept value above that level.
Okay, so what does this sequence confirm? Sellers defended the upper prices. Yes! The area above 4620 becomes a rejection zone and a key reference level for future sessions.
Conclusion
By now, you must have understood that “price rejections” are how the market draws its boundaries. They show where traders are unwilling to do business and where the price is unlikely to hold. When market price rejection occurs, it often marks the edge of current value and often serves as the launchpad for the next major rotation.
So now, the question is, how can you read these moments? You must observe the order flow, such as delta stalls, flips, and strong liquidity holding firm. Through such an analysis, you can gain insight into who is in control and where risk lies.
Furthermore, you should try to understand the delicate balance between “acceptance” and “rejection”. This can save you from emotional trading. Want to make this process easier? You can start using Bookmap. Through it, you can watch both liquidity and delta in real time. Such an observation lets you identify opportunities where price is truly being accepted or rejected. See price acceptance and rejection unfold live with Bookmap → Compare Packages.
FAQs
1. What causes a price rejection?
A price rejection happens when the market tests a new level but cannot stay there. In such situations:
- Buyers or sellers try to push the price forward, but
- The opposite side absorbs that pressure.
As a result, follow-through fails, and the market decides that the price is not fair value. And eventually, it moves away.
2. How can I identify rejection early?
Usually, early rejection shows up when heavy buying or selling does not move the price much. In these markets, you will observe these two major signs:
- Delta may stop rising or falling.
+
- Price reverses from a high-volume area.
Both these signs suggest market price rejection is forming.
3. Are all rejections tradable?
No! Some rejections are only “short pauses” before the price continues. You must realize that the best setups come when:
- Rejection is confirmed by strong rotation,
- Volume is shifting away, and
- Price is holding away from the tested level.
4. How does Bookmap help with reading rejections?
Bookmap is a real-time market analysis tool. It shows liquidity, volume, and absorption in real time. As a trader using Bookmap, you can see market price rejection as it develops, instead of realizing it only after the price has already moved.
Sign Up Now