4th of July Sale
50% Off Bookmap Global+, Data & Add-Ons
Save on Global+, market data, and add-ons from July 3–13.
Trading Basics
January 15, 2026
SHARE
Liquidity Isn’t Volume: Why They’re Not the Same Thing
Most traders are introduced to volume early in their journey. You were also probably told that if a lot of contracts trade hands, something big must be happening. Right? Not quite!
Realize that volume only shows what has already happened. It tells you how much was traded, but not why or where traders wanted to trade. That’s where liquidity comes into the picture! Liquidity reveals “intent”. It displays the orders waiting to be executed, besides the footprints of big players preparing to act. That’s why liquidity gives you a forward-looking view of the market. It shows what’s likely to happen next, while volume only tells you what just happened. So, you can say – Volume is history and liquidity is anticipation. Hence, if you confuse the two, you’ll often misread price behavior or enter at the wrong time.
Don’t want to make this blunder? In this article, you will learn the key differences between liquidity and volume and why tracking them is essential. Also, you will understand how mastering both can significantly improve your order flow strategy and trade execution. Let’s begin!
Liquidity vs Volume: A Fundamental Distinction
In trading, liquidity and volume are closely connected. Many traders confuse them because both relate to market activity. However, they describe very different things and operate on different timelines! Let’s see how:
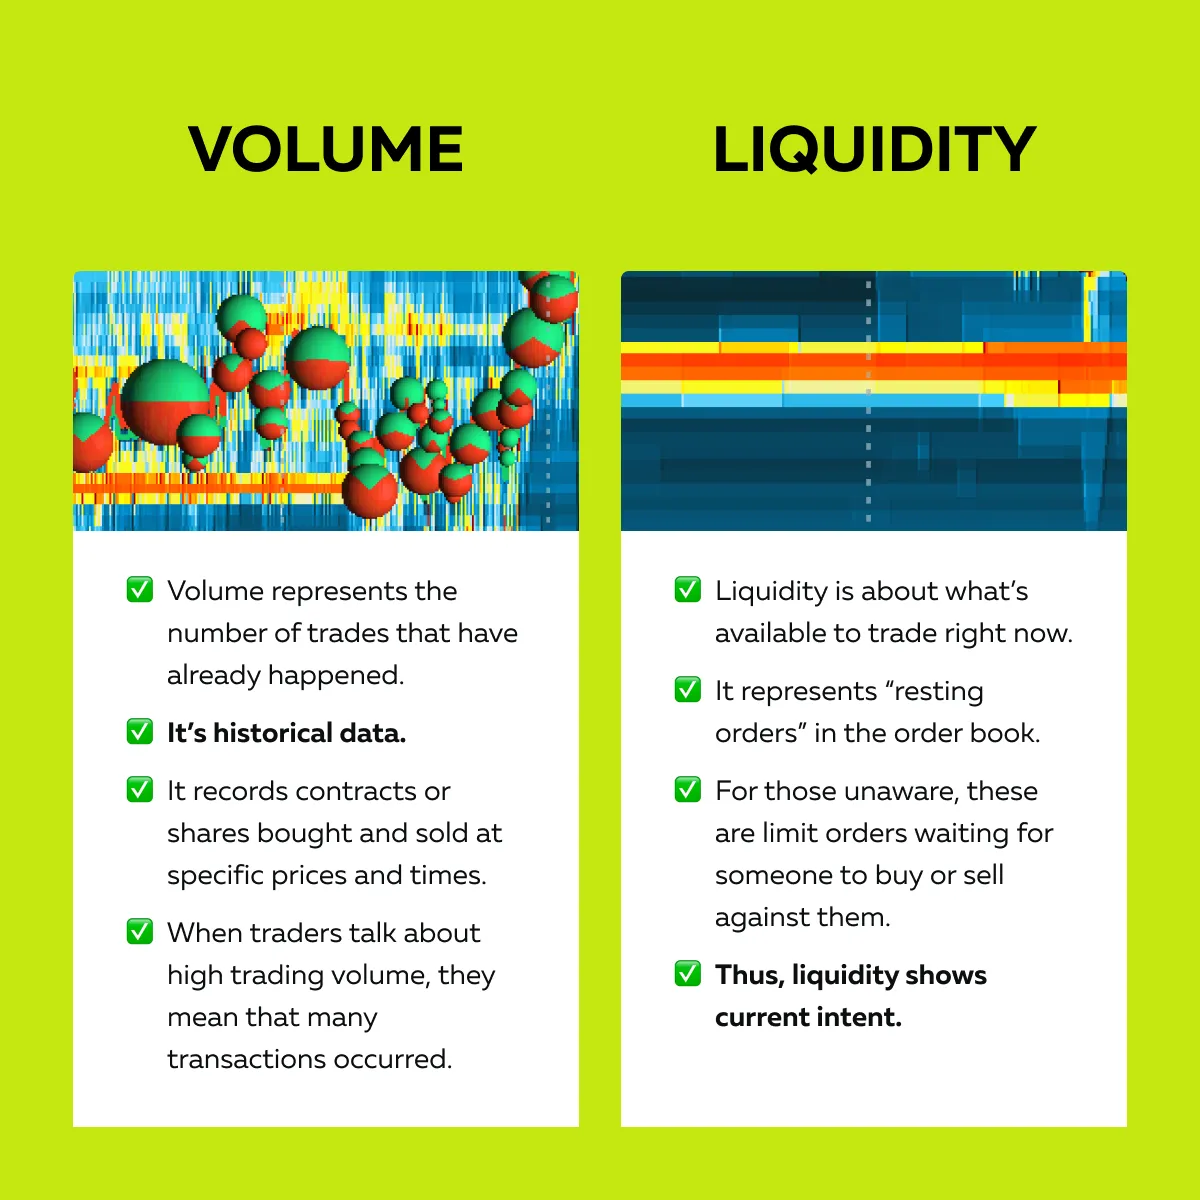
For more clarity, let’s study an example:
-
- Say 10,000 contracts have already traded at a certain price.
- Now, that’s high volume.
- But let’s assume there are still 20,000 contracts resting on the other side (limit orders waiting to be filled).
- Due to this, the price may not move much!
- Why? That’s because there’s plenty of liquidity to absorb those trades.
Thus, if you don’t understand liquidity and look at volume alone, you may gain a false impression of market strength. To put it simply:
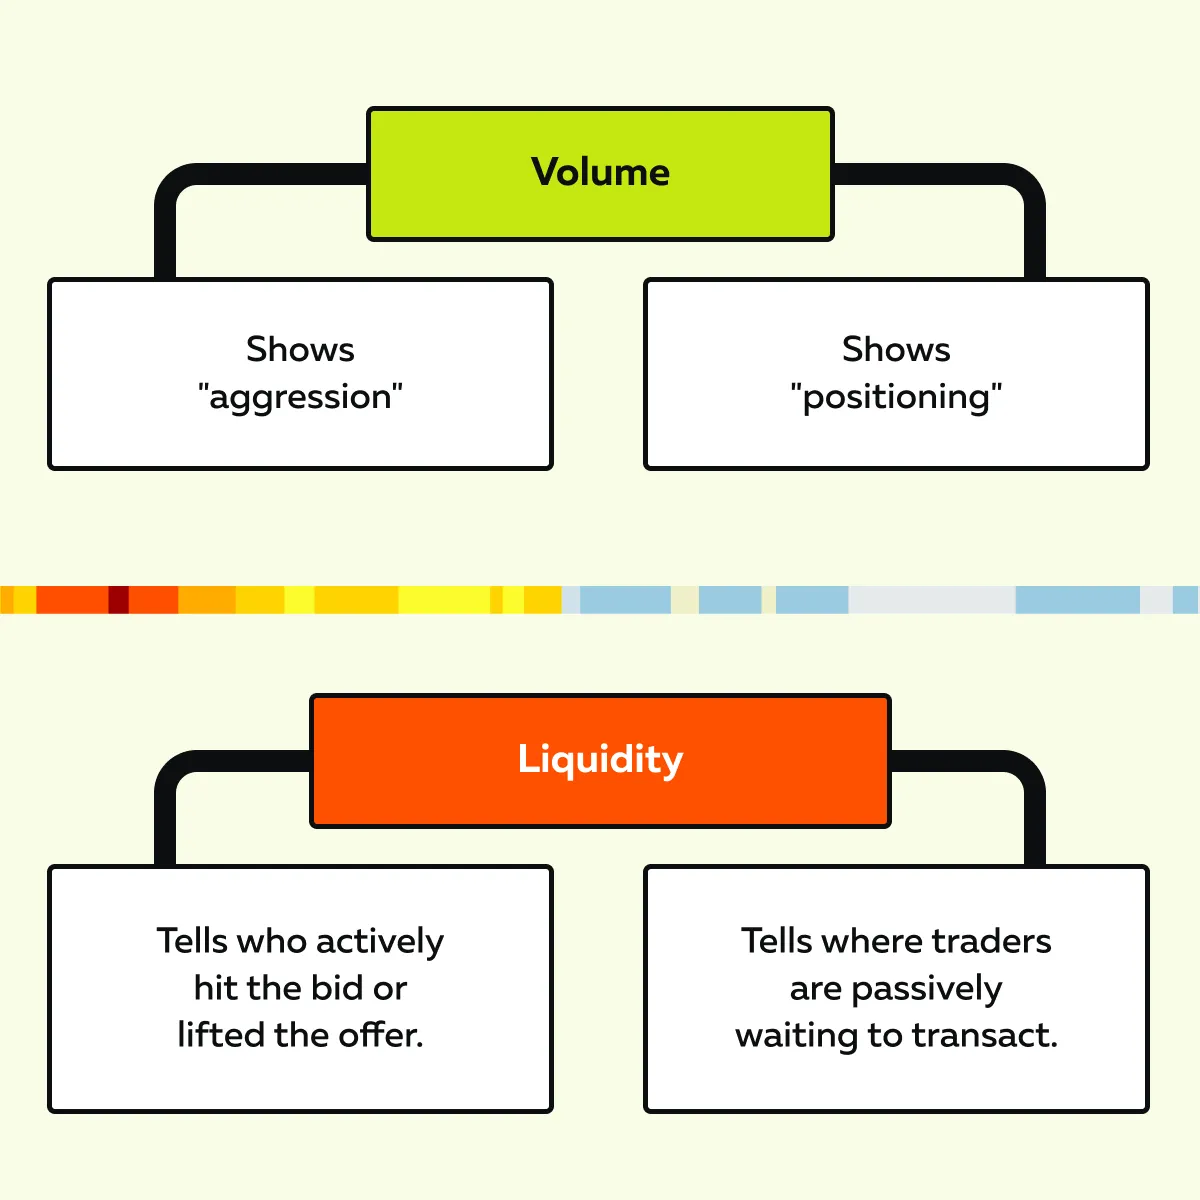
So when you know the difference between liquidity and volume in trading, you don’t just see what has happened; instead, you can predict what might happen next! Want to see liquidity and volume side by side? Compare Bookmap packages →
Why Liquidity Shapes Price Before Volume Even Appears

Need to know a trading secret? Liquidity often influences price movement before you ever see changes in volume! That’s because price moves when liquidity is consumed, not when trades are completed. In other words, volume follows liquidity (not the other way around)!
Let’s gain more clarity and understand how it works:
-
- Let’s assume large limit orders are sitting in the order book.
- They create strong areas of “trading liquidity”.
- These resting orders act like barriers!
-
- They slow the price movement because many contracts must be filled before the price can increase.
- Later, when that liquidity is suddenly pulled (orders removed), the price moves quickly through that space.
- Why? Because there’s nothing left to absorb new orders!
In this way, sometimes, heavy concentrations of liquidity act like magnets. They attract prices toward them. The result? Traders often react to these levels! Some front-run (enter early) or avoid large blocks, which can lead to short-term chop or slippage. For a deeper understanding, check out this scenario:
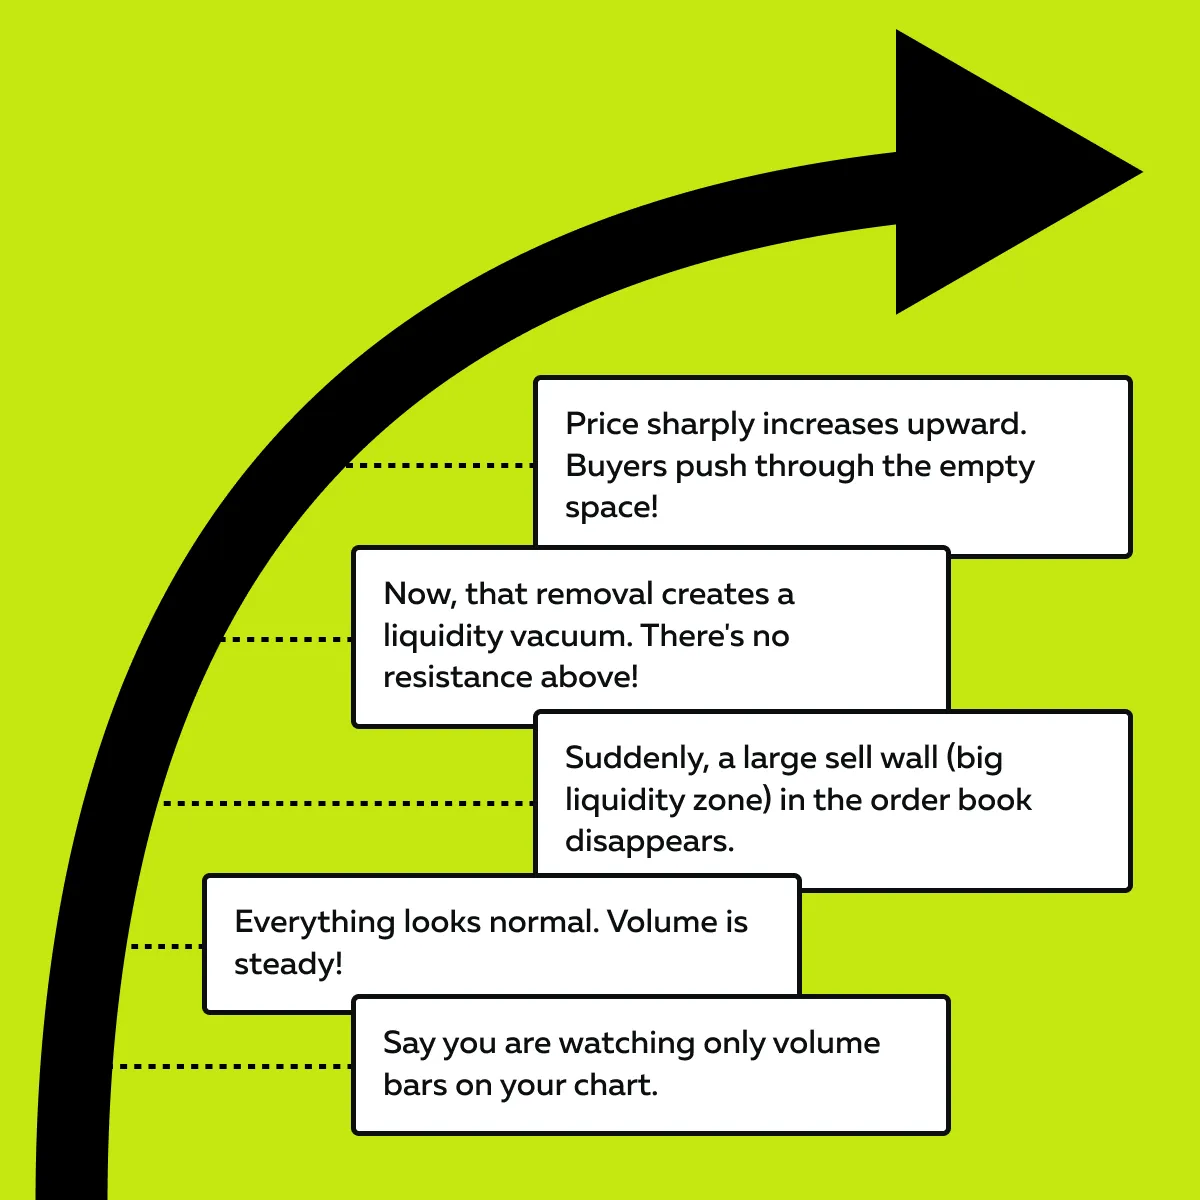
What must you observe here? – The liquidity change happened first; volume appeared after the move. That’s why liquidity is a leading indicator. It shows potential price movement before it even happens. On the other hand, volume is lagging and only reflects trades that have already occurred.
If you want to learn how to read order flow and the difference between liquidity and volume in trading, check out the Bookmap Education Course on Market Mechanics. It’s an excellent resource for understanding order flow vs volume in real market conditions.
Common Misconceptions About Volume and Liquidity
Many new traders misunderstand how liquidity vs volume actually influences market movement. That’s largely because several misconceptions and myths surround them. Always remember that while volume and liquidity are essential, they tell different parts of the story!
To let you trade better, let’s clear up some common myths traders often believe:
| Misconceptions | Reality |
| #1: High volume means strong price movement. |
|
| #2: Liquidity is always visible. |
|
| #3: Volume histograms show you where trades happened. |
|
| #4: Volume drives price. |
|
Volume tells you what happened. Liquidity tells you what might happen. Get Bookmap and read both in real time →
The Danger of Trading Volume Without Liquidity Context
Many traders rely only on volume-based indicators, such as:
- Volume bars,
- VWAP, and
- Standard momentum tools.
But that’s not the right approach! When you focus only on volume without liquidity context, you get an incomplete + misleading market picture. Let’s understand why through these three reasons:
| Reason I: False Volume Signals | Reason II: Fragile Price Moves | Reason III: Illiquid Market Risks |
|
|
|
In all these trading environments, you must understand what’s behind the move, not just how many trades occurred. For more clarity, let’s study a real-world example:
- Let’s assume a trader sees a sudden surge in trading volume.
- They decide to go long.
- Unknown to them, a large iceberg sell order (hidden liquidity) was sitting in the order book.
- It was quietly absorbing all those buy orders.
- As a result, the price doesn’t move higher, and the long trade fails.
- Did it happen because the volume was weak? Nope!
- It happened because hidden liquidity dominated the market.
So, when you understand liquidity vs volume, you see the real intent behind market moves (not just the result). This is what most smart traders do:
Stop trading blind—see where orders are actually waiting →
How to Analyze Liquidity and Volume Together
Okay, so in the liquidity vs. volume debate, do the most skilled traders prefer to study the liquidity side? Nope! They don’t pick any sides! Instead, they study both together.
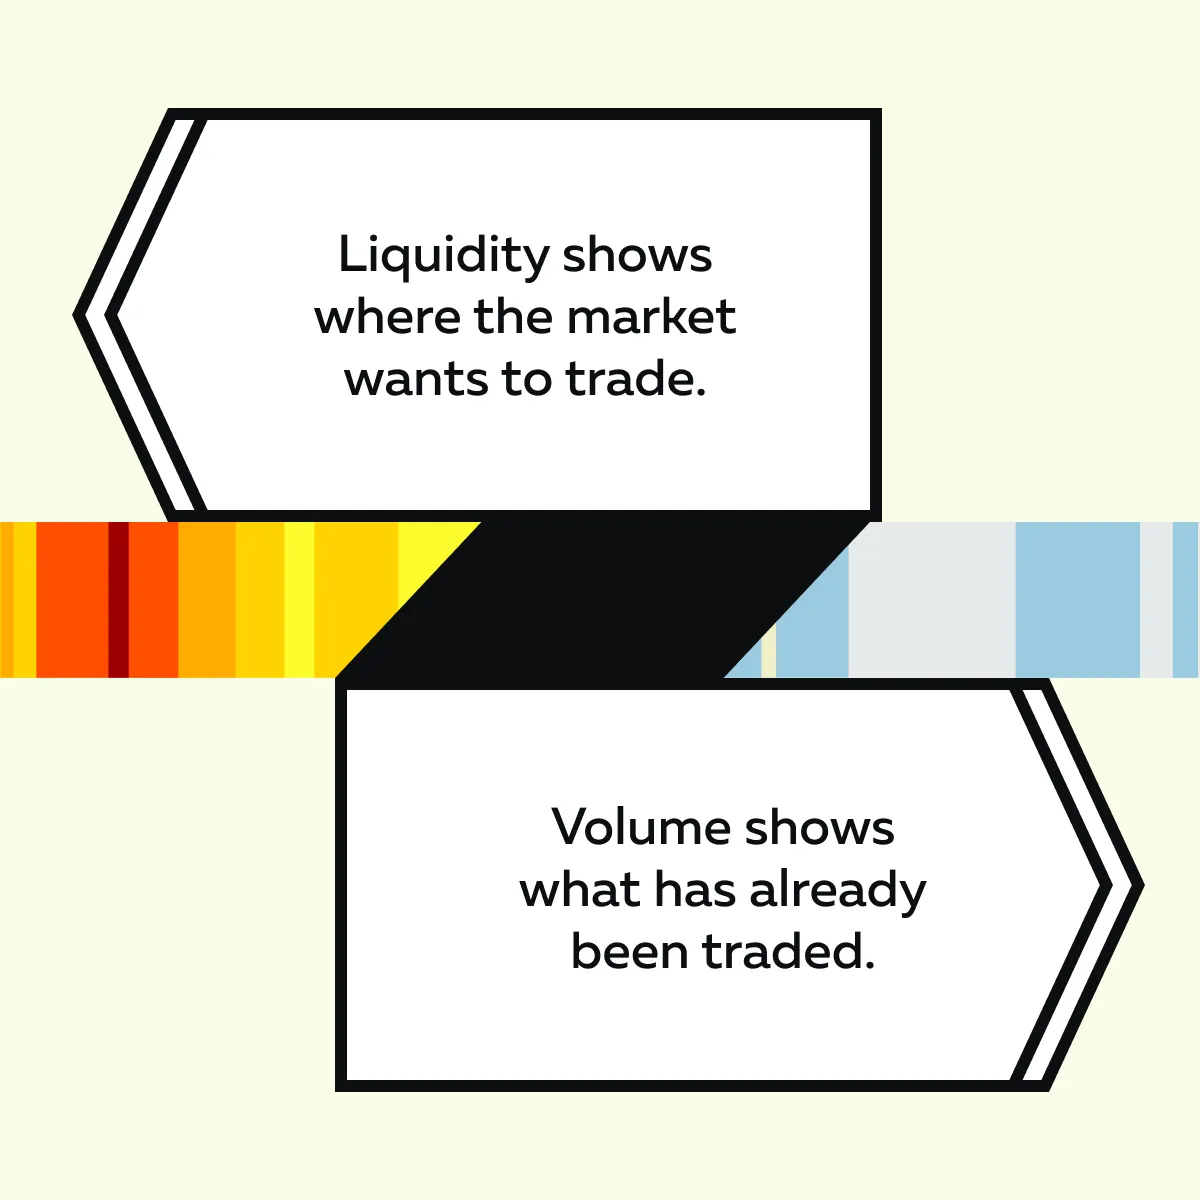
As mentioned, liquidity shows where the market wants to trade, while volume shows what has already traded. When you combine them, you get a complete picture of market intent and execution.
Okay, but how do we make such a combined study? Below are four liquidity signals you can try to identify while trading:
| Liquidity Signal | Meaning | Importance |
| Aggressive Volume Breaking Through Resting Liquidity | Strong buying or selling pressure pushes through large resting orders in the order book. |
|
| Stacked Liquidity Zones | Areas where many limit orders are grouped together at nearby price levels. |
|
| Liquidity Getting Pulled | Large resting orders disappear just before the price reaches them. |
|
| Hidden or Absorptive Liquidity (Detected via Tools) | Big players use iceberg orders or absorption techniques to hide actual trade size. |
|
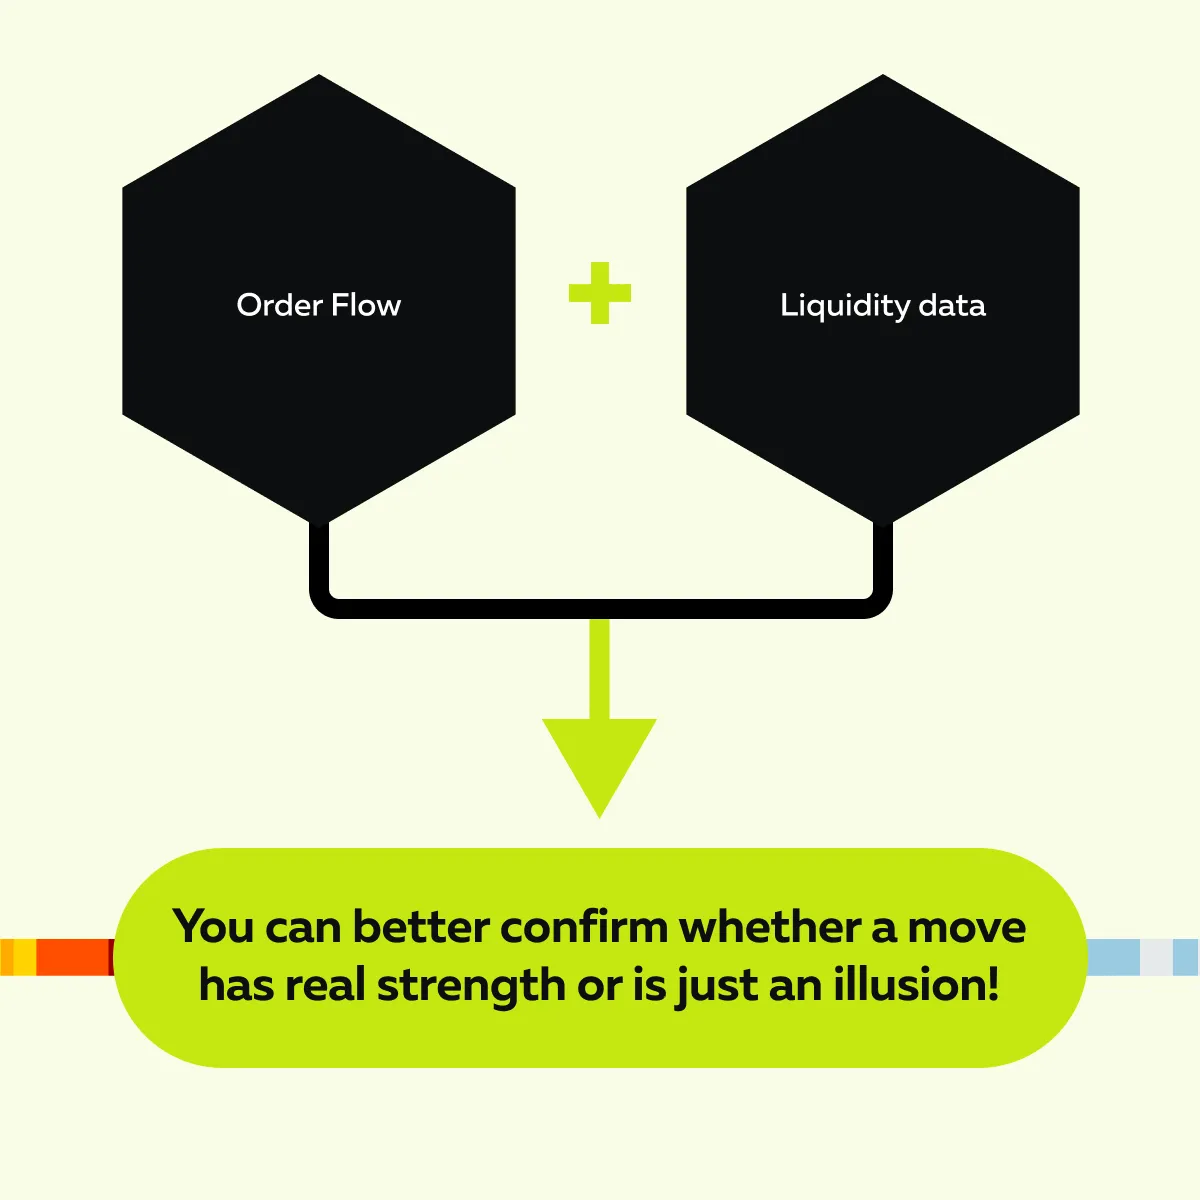
Do you feel this method of analysis is too tough? It has some major advantages, though! By making a combined analysis of trading liquidity vs volume, you, as a trader, can:
- Guess where the price is likely to move.
- Spot fake breakouts early and avoid being trapped.
- Differentiate real momentum from low-liquidity drifts that look strong but aren’t.
- Cut down on false signals that come from relying only on volume-based indicators.
When you understand the difference between liquidity and volume in trading, you gain a strategic edge. You can see both the intent and the execution behind every market move.
Conclusion
So by now, you must have understood that liquidity and volume are different concepts! They represent completely different market data. Volume shows what has already happened in the market, while liquidity reveals what’s likely to happen next.
Thus, if you rely only on volume, you’re merely reacting to past activity. However, when you also study liquidity, you begin to anticipate future price movement.
So, you can think of it this way! Volume leaves “footprints” of where traders have been, while liquidity shows the “terrain” of where they might go. By combining both, you can:
- Gain a deeper understanding of order flow vs volume,
- Spot genuine momentum, and
- Avoid fake breakouts.
So, want to start reading the market like professional traders? Compare Bookmap packages to find the best tools for visualizing liquidity and volume → Bookmap Packages Comparison.
FAQs
1. What’s the difference between liquidity and volume in trading?
Liquidity shows where traders want to buy or sell. It displays the resting limit orders waiting in the order book. On the other hand, volume shows what trades have already happened.
As a trader, you must realize that liquidity influences price movement before trades occur. In contrast, volume only records the result of those trades.
2. Why do traders say liquidity is a leading indicator?
That’s because liquidity reveals intent before trades even occur! Let’s understand through some market scenarios:
- Let’s assume large buy orders suddenly disappear before price rises. Now, it signals buyers are preparing to lift the market.
- Let’s assume heavy sell liquidity builds just above the price. This event often hints at upcoming resistance or a trap for late buyers.
- Let’s assume there is a quick liquidity pull on one side. Now, this can expose which direction big players intend to push.
- When orders stay firm and absorb aggressive trades, it reveals real strength (either buyers or sellers are defending that level).
Please note that these changes happen before volume reacts. Through liquidity analysis, traders can predict what’s likely to happen next.
3. Can I see liquidity on traditional platforms?
Usually not! Most trading platforms only show volume bars. They do not display the whole order book or live liquidity changes. Only some advanced real-time market analysis tools, like Bookmap, display real-time liquidity and order flow using heatmaps and detailed depth-of-market views.
4. How does hidden liquidity affect trading?
Hidden liquidity (like iceberg or passive absorption orders) doesn’t appear in the visible order book. However, they still absorb trades or slow price movements!
These tactics make it hard to see true market intent. Also, they can cause surprise reversals or failed breakouts.
5. Why is “volume at price” more useful than “volume over time”?
Volume at price shows exactly where buyers and sellers are active. It displays key support or resistance zones. On the other hand, volume over time only tells you how much was traded in a time period. It aggregates all trades within a time bar.
So, you can’t see where or why the volume occurred. In thin markets, this hides whether trades came from genuine participation or were just due to brief noise spikes.
Sign Up Now