Ready to see the market clearly?
Sign up now and make smarter trades today
Education
October 16, 2024
SHARE
Understanding Market Moves: The Principles of Auction Market Theory

The financial markets are an ever-shifting landscape, where information
travels at lightning speed, and technologies evolve in the blink of an eye.
Auction Market Theory (AMT), often abbreviated as AMT, stands as a timeless
pillar in this whirlwind of financial dynamics. It traces its roots back to
the pioneering work of Richard D. Wyckoff, a name etched in the annals of
trading history. Wyckoff’s insights, later refined by eminent traders and
theorists like Jesse Livermore and Richard Ney during the early to mid-20th
century, continue to serve as guiding stars for modern traders.
Despite the decades that have passed since its inception, AMT retains its
relevance in the world of trading. In this article, we will not only
highlight the enduring significance of AMT but also offer a deep dive into
its core principles and explore its versatile applications across different
marketplaces.
Join us as we unravel the practical aspects of Auction Market Theory and
discover how it can empower you to craft more effective trading strategies.
What is Auction Market Theory?
At its core, AMT elucidates the mechanics of price determination within
auction-style marketplaces. It postulates that market prices are the result
of continuous auctions where buyers and sellers engage in competitive
interactions. Its understanding helps traders comprehend how supply and
demand interact to establish equilibrium prices.
AMT has several uses when it comes to
financial markets
. These are:
|
How AMT Helps: |
What is the Meaning? |
How Is It Used Practically By Traders? |
|
Gauging Market Price |
|
It helps traders and investors to:
|
|
Probes Market Behavior |
|
It sheds light on how different players influence market
|
|
Volume Analysis |
AMT emphasizes the importance of trading volume. |
Traders use it to assess the:
|
|
Identification of Market Phases |
It identifies various market phases, such as |
This helps in timing trades or investments. |
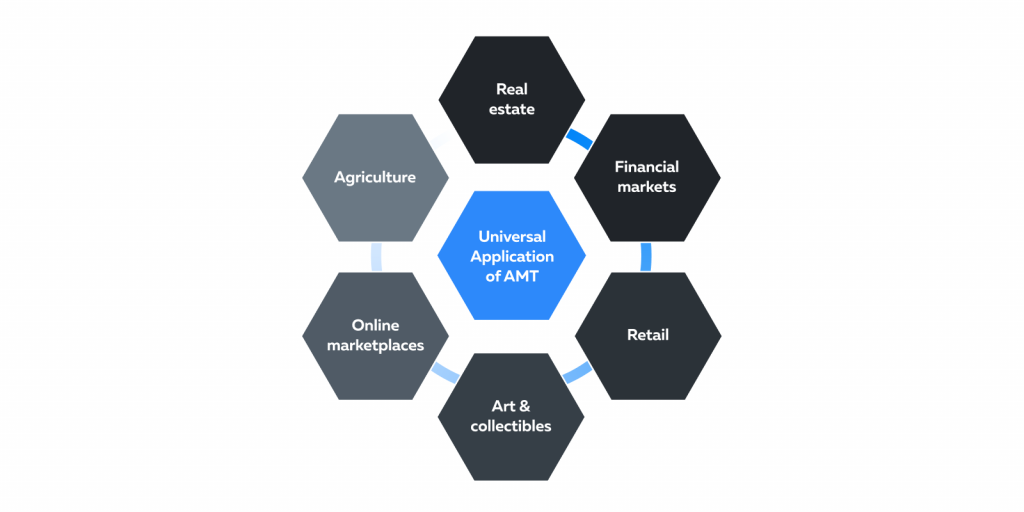
AMT Beyond Financial Markets
What sets AMT apart is its universal relevance; it extends beyond financial
markets. It can be applied to a wide range of marketplaces. Here are several
domains where AMT’s insights hold relevance:
-
Real Estate:
-
AMT helps real estate professionals understand:
-
various nuances of property price
-
buyer-seller dynamics
-
emerging market trends
-
-
-
Retail:
-
AMT principles can help retailers to make informed decisions
related to:-
pricing strategies
-
inventory management
-
sales forecasting
-
-
-
Art and Collectibles:
-
In this industry, AMT provides a framework that helps collectors
and dealers:-
gauge the value of items and
-
anticipate market shifts.
-
-
-
Online Marketplaces:
-
AMT’s principles are valuable for e-commerce platforms and
online auctions. -
By leveraging AMT insights, online marketplaces can fine-tune
their pricing strategies to align with market conditions,
thereby increasing profitability. -
They can optimize pricing and manage supply and demand.
-
For example, if a product suddenly experiences increased demand,
AMT principles suggest that the platform should ensure an
adequate supply to prevent stockouts and meet customer needs.
-
-
Agriculture:
-
AMT is a valuable tool for participants in agricultural markets,
helping them:-
understand commodity price movements
-
assess the impact of weather events
-
analyze the behavior of producers and consumers
-
-
Auction Market Theory, with its enduring relevance and broad applicability,
stands as a cornerstone of understanding and navigating the intricate
dynamics of diverse marketplaces, making it an indispensable asset for
traders and professionals across various industries.
The Core Principles of Auction Market Theory
Auction Market Theory (AMT) offers insights into the inner workings of
markets. Most traders and investors often use it to make informed
decision-making in any market, regardless of its size or complexity.
While studying AMT, it is crucial to understand the distinction between
value and price, as it helps in the identification of potential market
inefficiencies.
Value vs Price
|
What is the meaning of value? |
What is the meaning of price? |
|
|
|
How is the value determined? |
How is the price determined? |
|
|
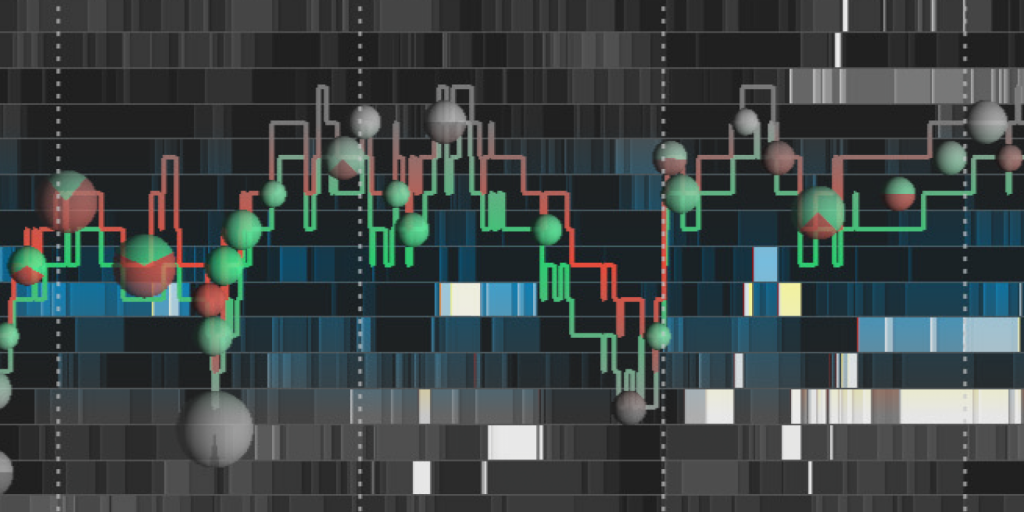
In this Insight, Tom B. showcases how auction market theory looks in practise on the ES (S&P 500). https://bookmap.com/insights?id=185
What are the different implications of value and price?
-
Differing Perceptions:
-
Differences in value and price can lead to market
inefficiencies. -
For example,
-
A stock may be undervalued based on fundamental analysis
(high value). -
However, due to market sentiment or short-term factors, it
is trading at a lower price.
-
-
-
Long-Term vs. Short-Term:
-
Understanding the difference between value and price determines
which type of trader you are.
-
|
How do long-term investors think? |
How do short-term investors think? |
|
|
-
Determining Market Efficiency:
-
Efficient markets are those where prices closely align with
values. There is little room for
arbitrage opportunities
. -
Inefficient markets exhibit larger gaps between value and price.
They offer more potential profit-earning opportunities.
-
Practical Understanding
To solidify our comprehension of value and price, let’s explore a practical
scenario:
Imagine a tech company, XYZ Inc., with strong fundamentals and a promising
growth trajectory. Expert analysts have pegged its intrinsic value at $100
per share based on their financial models. Yet, a sudden adverse news
development precipitates a swift stock price plunge to $80 per share.
What is the Value and Price of XYZ Inc. in this Scenario?
|
Value = $100 |
Price = $80 |
|
|
Acceptance and Rejection
In the context of AMT, understanding value areas and areas of rejection is
crucial for making better trading decisions. It provides insights into:
-
Where market participants perceive fair value and,
-
How price movements trigger reactions and shifts in trading
activity.
Let’s explore further.
|
Parameters |
Value Areas (Accepted Prices) |
Areas of Rejection (Non-accepted Prices) |
|
What does it mean? |
|
|
|
How does it impact the current market price (CMP)? |
|
|
How Do Value Areas Influence Price Movements?
|
Within Value Areas |
Entering Value Areas |
Outside Value Areas |
|
|
|
Balance and Imbalance
Gaining an understanding of balance and imbalance in AMT is essential for
traders and investors to effectively navigate changing market conditions.
|
The State of Balance |
The State of Imbalance |
|
|
What are the different scenarios causing the state of market imbalance?
Different market scenarios can create market imbalances, such as:
-
News Events:
-
Positive or negative news regarding a company, industry, or the
broader economy can upset the market balance. -
For instance, when a company’s earnings announcement either
exceeds or falls short of expectations. -
Positive news tends to attract more buyers, driving prices
upward until they reach a point where sellers are willing to
offer more shares. -
Conversely, negative news triggers selling pressure until buyers
perceive the asset as undervalued.
-
-
Sentiment Shifts:
-
A sudden shift in market sentiment, often influenced by factors
like geopolitical events or investor sentiment, can lead to an
imbalance. -
In such a situation, traders rush to either buy or sell,
creating a price gap until a new equilibrium is established.
-
-
Liquidity Shocks:
-
A lack of liquidity in the market, mostly due to a large
sell-off by a major investor, causes an imbalance. -
This leads to sharp price fluctuations as the market attempts to
find a level where buyers are willing to enter.
-
These principles of balance and imbalance are fundamental to understanding
how market dynamics evolve and play a crucial role in the strategies of
traders and investors across various markets.
The Role of Volume in AMT
Volume in financial markets serves as a barometer of trading activity. It
indicates the intensity of buying and selling and often precedes or
accompanies significant price movements. An elevated volume suggests
heightened interest or urgency among market participants.
In the context of AMT, volume and price maintain a close-knit relationship.
In an auction-like market, such as a stock exchange, volume plays a crucial
role in determining prices. When buyers outnumber sellers, prices typically
ascend, and vice versa.
When explored deeper, high-volume nodes and low-volume nodes serve as
important indicators for traders and help them identify:
-
Support and resistance levels
-
Potential breakouts or breakdown points in the market
High Volume vs. Low Volume Nodes
|
Parameters |
High-volume Nodes |
Low-volume Nodes |
|
What is the meaning? |
These denote price levels or zones on a price chart
|
These represent areas of price vulnerability or scant
|
|
How is it used by traders? |
|
|
Let us understand this concept through a practical example:
Stock XYZ Inc. is trading in a range between $50 and $60. On a volume
profile chart, you observe the following situations:
|
Situations |
What did you observe? |
What does it indicate? |
|
A |
There is a prominent peak in the volume profile chart at |
|
|
B |
There is a gap in the volume profile between $57 and
|
|
What predictions will traders make for Stock XYZ?
-
Upon observing high-volume nodes:
-
Traders may expect $55 to act as a strong support or resistance
level. -
If the price approaches $55, there might be increased buying or
selling activity.
-
-
Upon observing the low-volume node:
-
The low-volume node between $57 and $58 may be viewed as a
potential breakout point. -
Traders will monitor this area for signs of a significant price
move if the price approaches these levels.
-
Practical Implications for Traders
Transitioning from a state of balance to imbalance is a critical concept in
AMT as it helps traders determine advantageous entry and exit points.
Here are practical methods for using AMT principles to spot these
transitions:
|
Practical Spotting Methods |
What does it mean? |
How to spot it? |
|
Increase in Volume |
A surge in volume suggests that more participants are |
|
|
Rapid Price Change |
Sudden and significant price movements, especially those |
|
|
Breakout of Support and Resistance Levels |
When prices break through well-established support or |
|
Why is Detecting Transitions Important?
Detecting shifts from balance to imbalance is crucial for traders for
several compelling reasons:
-
Facilitates strategic entry and exit points:
-
Identifying these shifts allows traders to time entry or exit
positions. -
For example, entering a trade as the market transitions from
balance to imbalance can offer a better entry price.
-
-
Promotes effective risk management:
-
Recognizing shifts in market dynamics helps traders manage risk.
-
If the market is rapidly shifting into an imbalance against a
position, it may be wise to consider an exit to limit potential
losses.
-
-
Assists in exploring volatility opportunities:
-
Imbalance often begets heightened volatility, offering
opportunities for traders who thrive on price fluctuations. -
Understanding when and why imbalances occur can help traders
capitalize on volatility for potential gains.
-
Strategizing with AMT
Traders commonly integrate AMT principles into their trading strategies to
maximize their advantages. Discover how you can do the same:
|
What to do? |
How to do it: |
|
|
|
|
|
|
|
|
|
|
|
|
Auction Market Theory in Modern Trading Tools
In the modern trading landscape, technological advancements have made it
easier than ever for traders to apply AMT principles effectively. Discover
how market analysis tools like Bookmap facilitate the visualization and
utilization of AMT principles:
-
Visualize Market Data Using Depth of Market (DOM) Tools:
-
Platforms like Bookmap offer
advanced DOM data visualization
that automatically identifies high-volume nodes and low-volume
nodes. -
They provide a visual representation of order book depth,
showing the distribution of buy and sell orders at various price
levels. -
This helps in identifying:
-
Where liquidity is concentrated
-
High-volume nodes, and
-
Price rejection zones
-
-
-
Obtain Real-Time Market Data:
-
Major market analysis tools like Bookmap offer live data feeds
and real-time market data, including price and volume
information. -
Traders can monitor these feeds to spot shifts in volume and
price.
-
-
Algorithmic Trading:
-
Advanced market analysis tools, like Bookmap, support the
development and execution of algorithmic strategies that
seamlessly integrate AMT principles. -
Traders can create algorithms that respond to:
-
Shifts in volume
-
Trade around value areas, or
-
React to sudden market imbalances.
-
-
Conclusion
Despite its development many decades ago, Auction Market Theory (AMT) still
holds relevance irrespective of market conditions or technological
advancements. AMT’s core concepts, such as value areas, price rejection
zones, volume analysis, and the dynamics of balance and imbalance, remain
fundamental in deciphering market behavior.
These time-tested principles continue to guide traders in making informed
decisions, and their applicability extends far beyond the world of financial
markets. AMT offers valuable insights across diverse marketplaces, from real
estate and retail to the art world and more, underscoring its universal
importance.
Are you ready to leverage insights from Auction Market Theory in real time?
Take a deeper dive into live market dynamics with Bookmap. Join us now and
gain an edge in your trading journey.
Discover Bookmap today
.