


See market structure more clearly in real time.
Compare plans to access deeper market visibility for market structure.
Education
September 11, 2026
Updated
What Is Market Structure in Trading?

Market structure is one of the most important ways traders interpret price. Instead of relying on indicators, it focuses on how the price actually moves, forming trends, ranges, and transitions over time.
By understanding market structure, traders can identify direction, key levels, and when conditions are shifting. These principles apply across all markets, including forex, futures, stocks, and crypto.
What Does Market Structure Mean?
Market structure refers to how price organizes itself over time through trends, ranges, and transitions. Traders analyze patterns such as higher highs, higher lows, lower highs, and lower lows to determine whether a market is trending or consolidating.
What Is the Definition of Market Structure?
The definition of market structure in trading focuses on price behavior rather than company fundamentals. Traders use market structure to identify trend direction, key levels, and potential turning points by analyzing swing highs, swing lows, support, and resistance.
Different Types of Market Structure Explained
There are three primary types of market structure in trading: bullish, bearish, and sideways. A bullish structure forms higher highs and higher lows, a bearish structure forms lower highs and lower lows, and a sideways structure forms equal highs and equal lows.
If you’re wondering why market structure is so relevant or how you can use it, read on. We’ll go through all the fundamentals in this post.
Sign up for FREE to Bookmap and start putting your market structure understanding to use.
What this article covers:
1. What Is Market Structure?
2. Key Factors That Determine Market Structure
3. Break of Structure (BOS) and Change of Character (CHOCH)
4. Liquidity, Order Blocks & Fair Value Gaps
5. Order Flow, Supply & Demand, and Price Discovery
6. Why Is Market Structure Important in Trading?
7. Market Microstructure: Order Books, Spreads & Market Makers
8. Market Structure vs. Support and Resistance
9. How to Use Market Structure?
10. How to Identify a Trend Reversal vs. a Pullback
11. Which Assets Work Best With Market Structure?
12. What Is the Best Time Frame to Identify Market Structure?
13. Examples and Trade Setups Using Market Structure
14. Advantages
15. Limitations
16. Market Structure vs. Other Trading Strategies
17. Market Structure FAQ
Watch a video summary on What is Market Structure (with added examples)
What Is Market Structure in Trading?
Market structure definition: The framework or structure that any given market is currently trading in. Market structure can help you understand the behavior, condition, and current flow of the market. It highlights support and resistance levels, swing highs, and swing lows.
Types of Market Structure
Market structure can be broadly classified into three distinct categories:
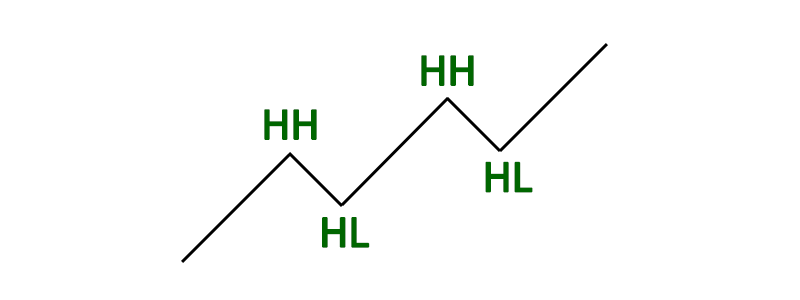
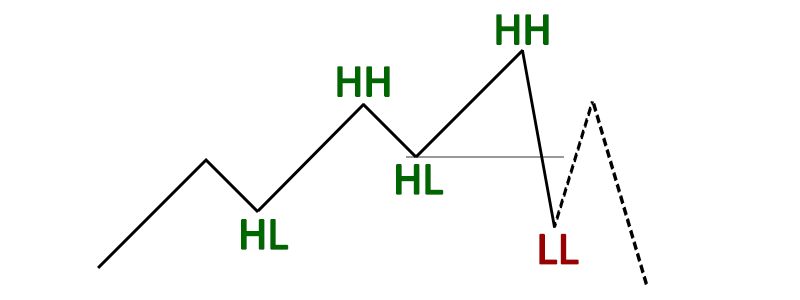
Bullish Market Structure: A bullish structure is defined by a series of higher highs (HH) and higher lows (HL). The trend continues in the same direction until the asset price records a lower low (LL).
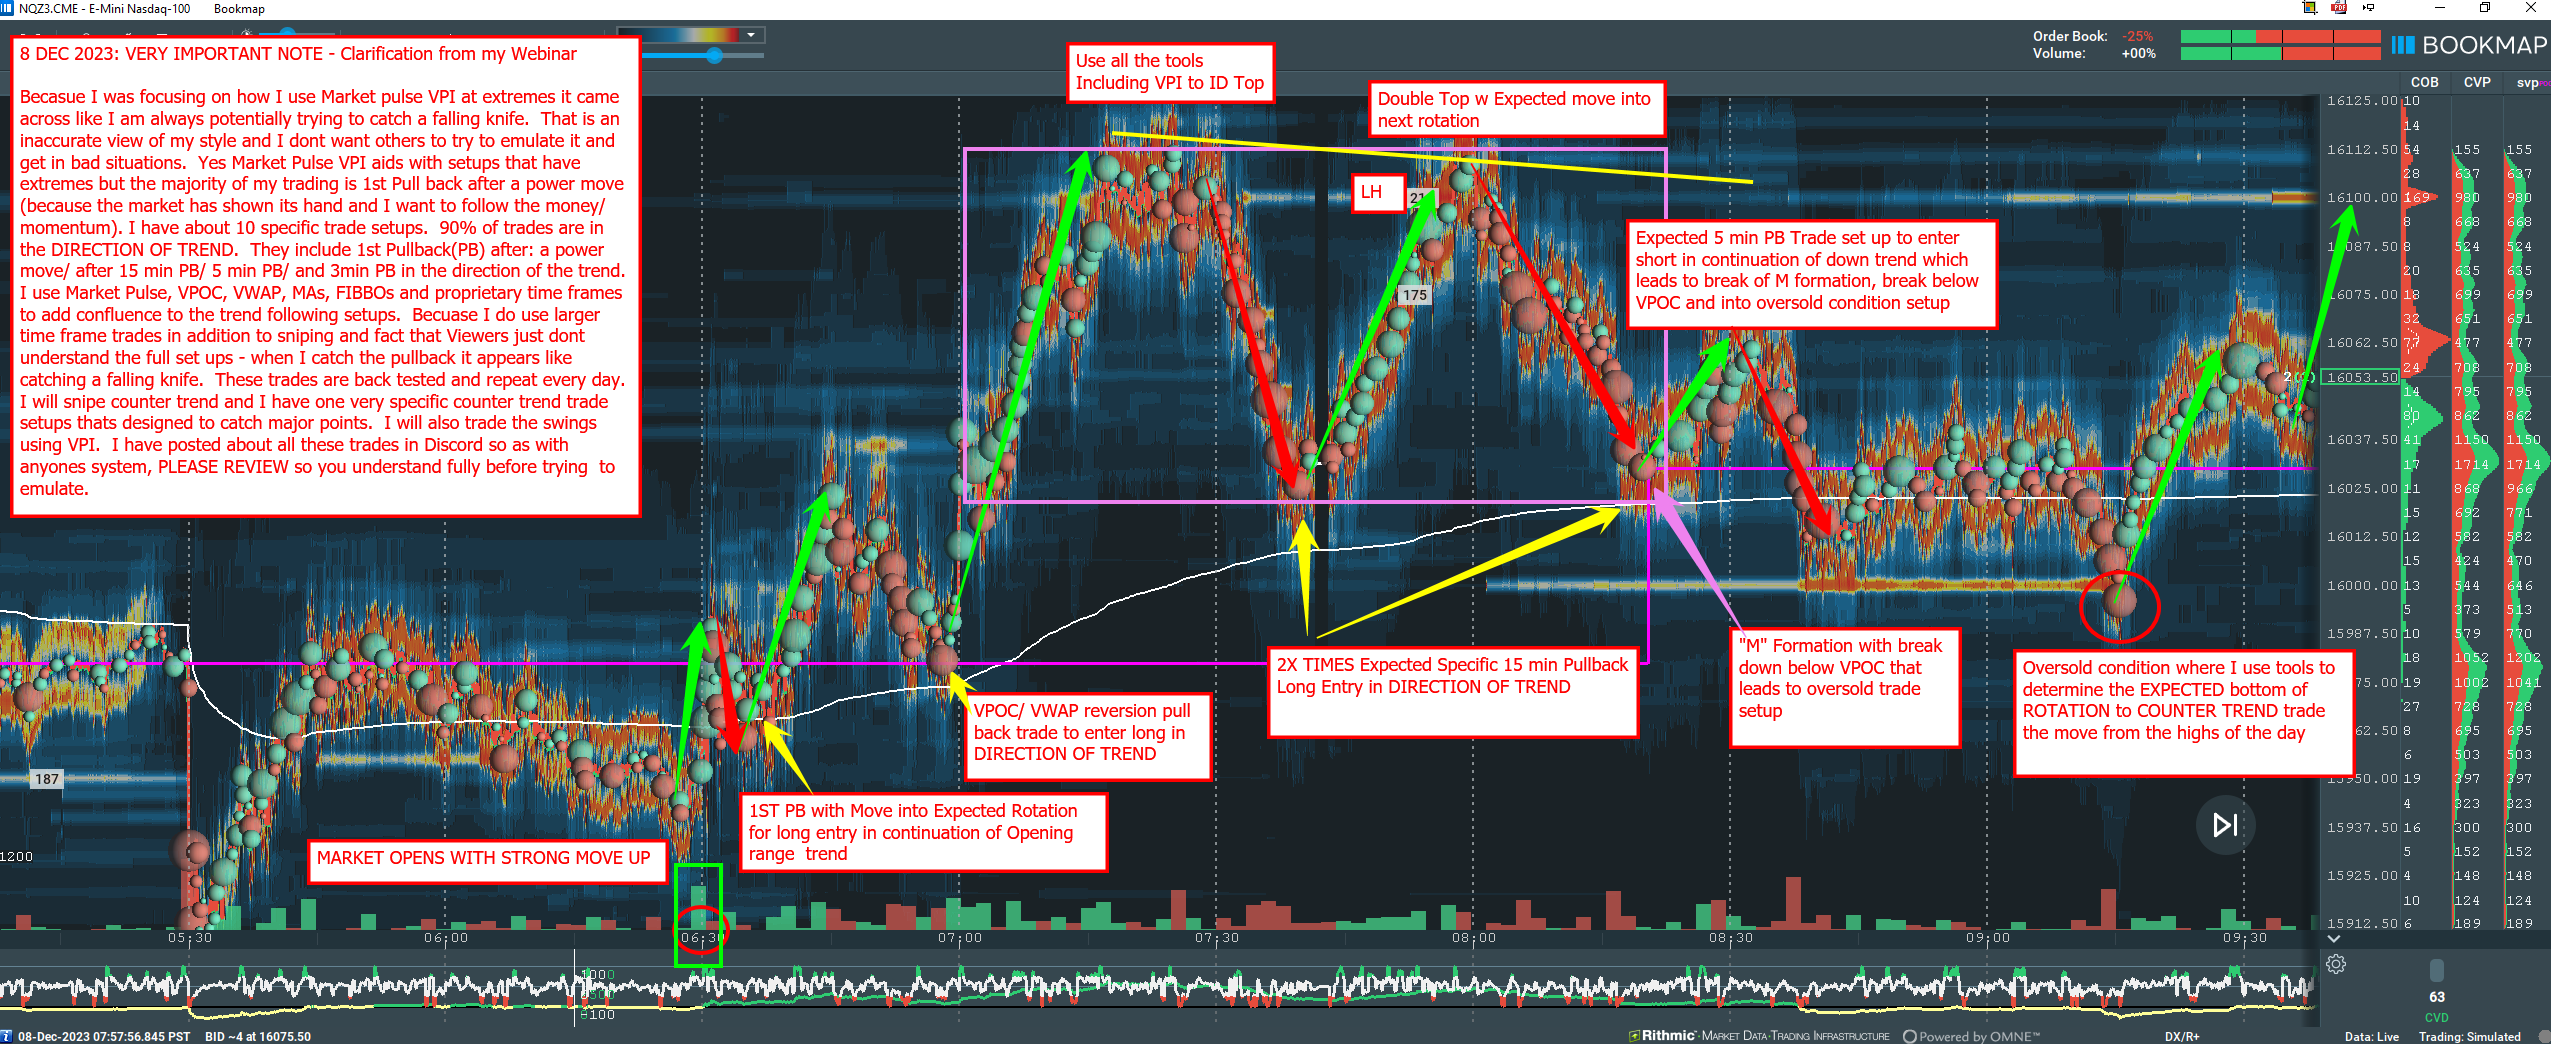
In this example from the Blue Jacket, CrashF16 displays how he uses market structure in conjuncture with other tools such as the Market Pulse add-on to identify high-probability trading setups.
Discover more trading Insights.
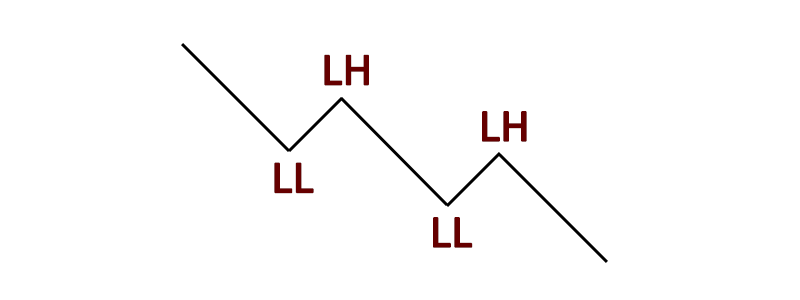
Bearish Market Structure: A bearish structure is defined by lower lows (LL) and lower highs (LH). The price trend continues as long as lower highs (LH) are being printed and until a higher high (HH) is created.
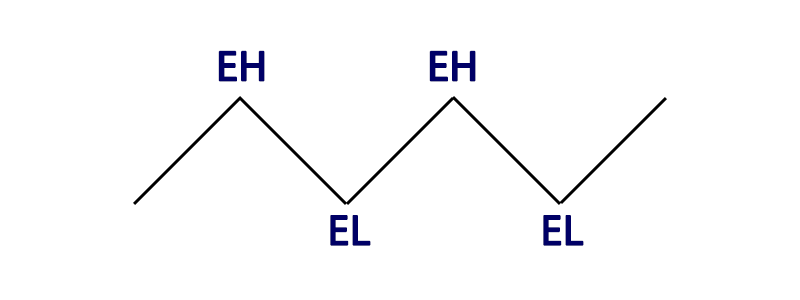
Sideways Market Structure: The horizontal movement of price shown by equal highs (EH) and equal lows (EL) is called a sideways trend or sometimes referred to as chop.
Key Factors That Determine Market Structure
A handful of underlying factors determine how clean or chaotic a market’s structure looks on the chart:
- Liquidity and participation — markets with deep, active participation (major forex pairs, index futures, large-cap stocks) tend to form cleaner, more readable swing structure than thin or illiquid markets, where a single large order can distort the pattern.
- Volume — structure formed on strong volume is generally more reliable than structure formed on thin volume, since it reflects broader participant agreement rather than a handful of trades pushing price around.
- Timeframe — the same instrument can show a clean uptrend on one timeframe and a choppy range on another; structure is timeframe-relative, not an absolute property of the asset.
- News and macro catalysts — scheduled events (economic data, earnings, central bank decisions) can override existing structure abruptly, producing a structure break driven by a catalyst rather than a gradual shift in supply and demand.
These factors are why the same structural framework can look dramatically more reliable on, say, EUR/USD on a 4-hour chart than on a low-cap altcoin on a 1-minute chart — the framework doesn’t change, but how much confidence to place in it does.
Break of Structure (BOS) and Change of Character (CHOCH)
Break of Structure (BOS) describes a continuation event: price breaks beyond the most recent significant swing high (in an uptrend) or swing low (in a downtrend), confirming the existing trend is still in control. A BOS doesn’t signal a reversal — it signals that the prevailing structure is holding.
Change of Character (CHOCH) describes the opposite: the first break in the opposite direction of the prevailing trend’s swing pattern — for example, in an uptrend, price breaking below the most recent higher low. A CHOCH is an early warning that the trend may be shifting, though it’s not itself confirmation of a new trend — it’s typically treated as the first sign worth paying attention to, with a full structural reversal (a new sequence of swings in the opposite direction) confirming it.
The practical distinction: BOS tells you the trend you’re already in is continuing; CHOCH tells you to start paying closer attention to whether that trend is ending, without yet assuming it has.
Liquidity, Order Blocks & Fair Value Gaps
Two concepts frequently discussed alongside BOS and CHOCH in smart money concepts (SMC) trading:
- Order blocks refer to a candle or cluster of candles just before a strong, decisive price move — the theory being that large participants placed significant orders there, and that zone may act as support or resistance if price returns to it later. This is a pattern-based inference about where institutional activity likely occurred, rather than a direct observation of actual resting orders.
- Fair value gaps (FVG) are price gaps left behind by a sharp, fast move — typically identified as a gap between the wicks of three consecutive candles where the middle candle’s range isn’t overlapped by the first and third. The theory holds that price often returns to “fill” this gap before continuing, since the fast move left an area where limited trading actually occurred.
Both concepts are inferred from candlestick patterns after the fact, which is a meaningfully different approach from watching the order book directly. A liquidity heatmap shows genuine resting order data in real time; order blocks and FVGs are retrospective, pattern-based approximations of where that activity might have been. They’re not contradictory approaches — many SMC traders use both — but it’s worth being clear about which one is showing you an actual order and which one is showing you an inference.
Order Flow, Supply & Demand, and Price Discovery
“Supply and demand” trading is closely related to, but distinct from, the auction-theory framework already covered on this page. Where auction theory talks about value areas and balance/imbalance, supply-and-demand trading identifies specific zones where a strong imbalance previously formed — a sharp rally from a “demand zone” or a sharp selloff from a “supply zone” — and treats those zones as likely to produce a similar reaction if price returns to them.
Price discovery is the broader mechanism underlying both frameworks: the continuous process by which buyers and sellers, through their actual order flow, arrive at a price that reflects current supply and demand. Order flow tools make this process directly observable — rather than inferring a supply or demand zone from candlestick shape after the fact, order flow shows the actual buying and selling pressure as it happens, which is what created that zone’s reputation in the first place.
How to Read Price Action Structure in Real Time
Reading market structure in real time means tracking how price behaves around key swing points.
In an uptrend:
- Price forms higher highs and higher lows
- Pullbacks hold above previous lows
In a downtrend:
- Price forms lower highs and lower lows
- Rallies fail below previous highs
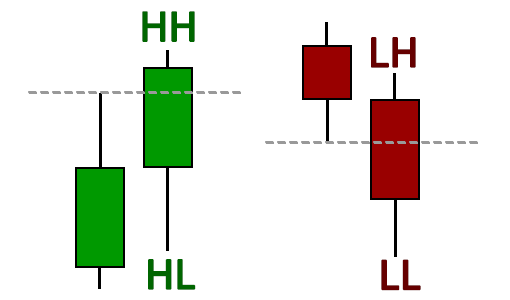
A key concept is structure confirmation. For example:
- A bullish continuation requires price to break and close above a previous high
- A bearish continuation requires price to break and close below a previous low
This helps traders distinguish between continuation and potential reversal.
Price Continuation
To confirm a trend it’s important to see candlesticks close above the previous higher high (in an uptrend) or below the previous lower low (in a downtrend).
This shows the continuation of buying as the price increases or the continuation of selling as the price decreases.
Price Failure
If price action sweeps above the previous higher high but then closes below, this shows weakness and could be the early sign of a reversal:
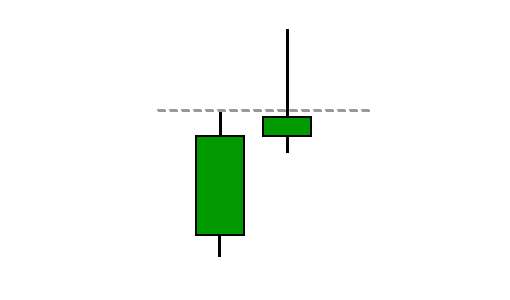
Many traders refer to these failed continuation moves as structural breaks or market structure shifts. In some trading communities, particularly smart money concepts (SMC), this may also be described as a Break of Structure (BOS) or Change of Character (CHOCH). Regardless of terminology, the key idea is observing when the market fails to maintain its existing trend behavior.
Support and Resistance in Market Structure
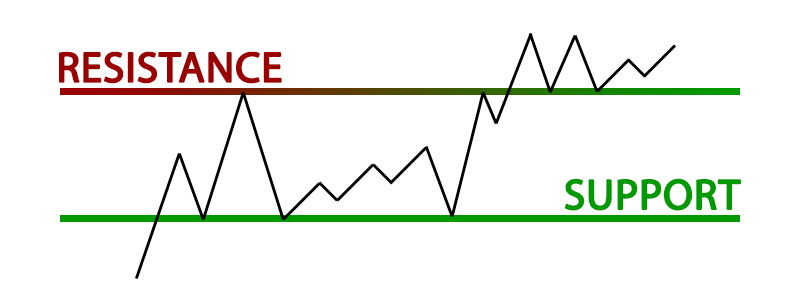
Price movement is often restricted within the limits of support and resistance levels. Price can cross these levels and shift to other areas of support and resistance.
- Support: A price level that can halt a downtrend due to a concentration of demand or buying interest. Support levels usually contain a large number of buy orders in the order book from major market participants.
- Resistance: A price level that repels an uptrend due to the emergence of an increased number of sellers. Resistance levels contain a high volume of sell orders in the order book.
While traditional support and resistance are based on historical price levels, many traders now look at liquidity and order flow to understand why these levels hold or break. This provides more context than price alone.
Why Is Market Structure Important in Trading?
Market structure is important for both new and professional traders since it can influence the liquidity and price action of a market. It’s also one of the most commonly used techniques to understand trends, identify potential reversal points, and get a feel for current market conditions.
Because market structure is a reflection of the two-way auction process and psychological changes of market sentiment, it provides incredible insight into how the market is behaving. It can provide vital clues about where the price action is heading next.
Market Microstructure: Order Books, Spreads & Market Makers
above market microstructure — the actual mechanics of how orders get matched, priced, and filled. Understanding both matters: structure tells you where price has been and where it might react; microstructure explains why those reactions actually happen at the order level.
The core microstructure concepts:
- The order book — the live list of resting buy and sell orders at each price level, which is what actually determines where a market’s next trade will occur.
- The bid-ask spread — the gap between the best available buy and sell price, which widens or narrows based on liquidity and directly affects execution cost.
- Market makers — participants who continuously quote both sides of the market, providing the liquidity that allows other traders to execute without waiting for a matching counterparty.
For a deeper look at spread mechanics specifically — including fixed vs. variable spreads, and how market maker inventory risk affects pricing — see Bookmap’s guide to spreads in trading. The swing highs and lows that define market structure are, at bottom, the visible result of this microstructure playing out over time.
Market Structure vs. Support and Resistance
These two concepts are closely related and often discussed together, which leads many traders to treat them as interchangeable — they’re not quite the same thing. Market structure describes the sequence of swing highs and lows over time (is the market making higher highs and higher lows, or the reverse?). Support and resistance describes specific price levels where buying or selling pressure has previously been strong enough to pause or reverse price.
In practice, most support and resistance levels form at prior swing highs or lows — which is exactly why the two concepts overlap so heavily in everyday trading discussion. But market structure can shift (a CHOCH, covered above) without price ever reaching a major support or resistance level, and a support/resistance level can hold or break independently of what the broader swing structure is doing. Treating them as the same concept works most of the time; the distinction matters most when they disagree with each other.
Market Structure in Economics vs Trading
Market structure can also have a different meaning outside of trading. In economics, market structure describes how industries are organized, how firms compete, and how pricing power is distributed. This is separate from trading market structure, which focuses on price movement and liquidity behavior.
This distinction is important because some traders searching for “market structure” are referring to price trends and liquidity behavior, while others may be researching the economic regulation and organization of financial markets and exchanges.
What Does Market Structure Mean in Economics?
In economics, market structure refers to how many firms operate in a market, how competitive that market is, and how prices are determined. Common economic market structures include perfect competition, monopolistic competition, oligopoly, and monopoly.
What Are the Four Main Types of Market Structure?
The four main economic market structures are perfect competition, monopolistic competition, oligopoly, and monopoly. These classifications help explain pricing power, competition levels, and barriers to entry within an industry.
Difference Between Trading Market Structure and Economic Market Structure
Trading market structure analyzes price action, trends, and liquidity. Economic market structure analyzes competition, pricing control, and firm behavior. While both use the same term, they serve very different purposes.
Auction Market Theory in Trading
Auction market theory views the market as a constant two-way auction where buyers and sellers interact to find fair value. This perspective helps traders understand why price trends form, stall, or reverse.
Auction theory and market structure are closely connected because both attempt to explain how price discovery occurs through supply, demand, liquidity, and participation. These frameworks are commonly used in macroeconomic trend analysis and professional futures trading methodologies.
Trading with Auction Theory
Auction theory highlights the balance (or imbalance) of buying and selling pressure. By recognizing whether participants are aggressively bidding prices higher or offering lower, traders can anticipate shifts in direction.
Market Profile Auction Theory
Market Profile is a charting method built on auction market theory. It organizes price and volume into time-based distributions, showing where the market has accepted value and where imbalances may lead to future moves.
How to Use Market Structure
Market structure can help you define if-then scenarios. For example, if a structure break occurs then look to get short on a pullback.
Market structure is also useful for defining invalidation. If the structure breaks, the original trade idea is no longer valid. This allows traders to manage risk more effectively.
The Trend Is Your Friend
One of the most popular expressions in the trading world, and for good reason. If you can use market structure to identify a trend, more often than not, the price will continue in the same direction going forward.
Momentum
This is due to the simple fact that buyers (in a bullish trend) are already present. To reverse the trend, aggressive sellers must enter the market. Significant volume is required to not only put a stop to the current momentum but to then reverse the direction.
Much like reversing the direction of a speeding car, energy is first required to bring the car to a stop (breaking). Then, more energy is needed to start traveling in the opposite direction (reversing).
Patterns
Popular trading patterns like head and shoulders, inverse head and shoulders, double bottoms, and double tops are simply different types of market structures. They can represent trend breaks or trend continuation.
Patterns should never be used in isolation. What matters is how price behaves at those levels — whether buying or selling is being absorbed, whether momentum is increasing, or whether traders are getting trapped.
Market Geometry and Structural Trading Concepts
Some traders describe market structure as a form of market geometry because price often moves in repeating expansions, pullbacks, consolidations, and directional shifts. By studying how swing highs and lows develop over time, traders can map trend continuation, identify structural transitions, and better understand overall market behavior.
This approach is commonly used across forex, futures, stocks, and crypto markets.
How to Apply Auction Theory in Trading
Auction theory can be applied by identifying areas of value and imbalance. Traders often look for “excess” at the edges of a market (spikes of aggressive activity) and trade toward value areas where balance is restored.
What Are the Key Concepts of Auction Theory in Trading?
Core ideas include:
- Value areas where most trading occurs.
- Excess, which marks potential reversal points.
- Balance and imbalance, which signal consolidation versus trending conditions.
What Indicators Are Used for Auction Theory Trading?
Common tools include volume profile, Market Profile, and order flow heatmaps like those in Bookmap. These help visualize where value is being established and how aggressive orders drive movement.
How to Identify a Trend Reversal vs. a Pullback
This is one of the most common points of confusion in reading market structure, since both a pullback and the early stage of a reversal look identical in the moment — price moves against the prevailing trend. The distinction only becomes clear based on how far that counter-move goes and what happens next:
- A pullback stays within the bounds of the existing structure — in an uptrend, price pulls back but doesn’t break below the most recent higher low before resuming upward. This is the “Structure Hold” pattern already covered elsewhere on this page.
- A trend reversal begins with a genuine structural break — in an uptrend, price breaks below that same higher low (a CHOCH), and subsequently begins printing lower highs and lower lows rather than resuming the original trend.
The practical takeaway: a counter-trend move isn’t confirmed as a reversal until structure actually breaks. Treating every pullback as a potential reversal — or the reverse, assuming every dip is “just a pullback” — is one of the more common ways traders mistime entries and exits around this exact ambiguity.
Which Assets Work Best with Market Structure?
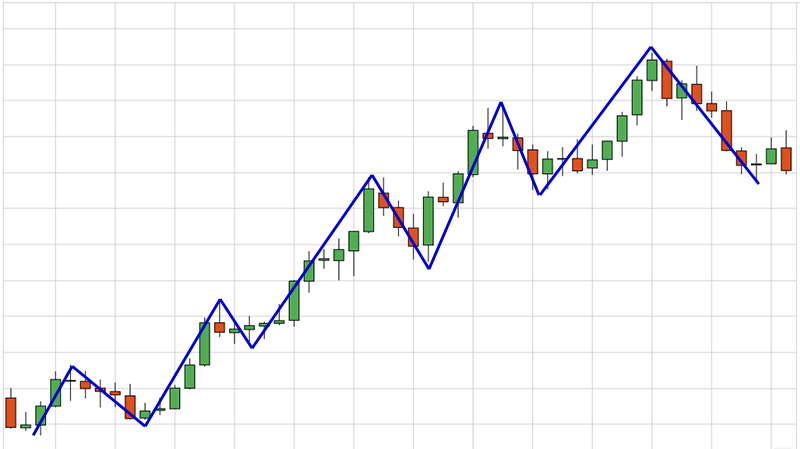
Assets and trading instruments that have high liquidity, a high number of participants, and a high volume have a smoother and more obvious market structure. Forex, futures, bonds, and stocks are ideally suited to market structure analysis.
The following market structure example is taken from the EURUSD forex market and has a well-defined bullish structure:
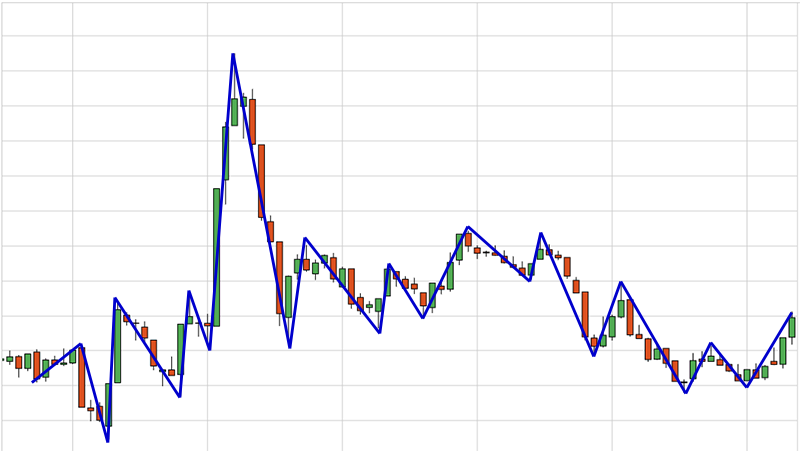
However, smaller stocks and some low-cap cryptocurrencies may lack enough liquidity to form a clean market structure, especially on low time frames:
What is the Best Time Frame to Identify Market Structure?
Market structure appears across all time frames and different time frames often display different market structures.
For example, while the overall market structure on the higher time frame may be trending up, the lower time frame structure may be in a current downtrend as the market pulls back, awaiting the influx of buyers to continue the higher time frame move.
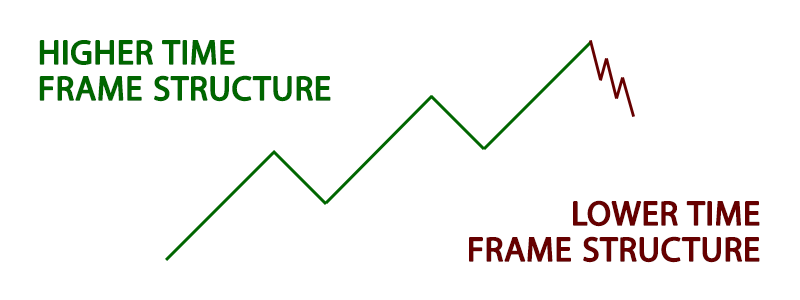
Higher volume is represented on higher time frames, which means more market participants and more reliable sentiment. This generally results in a more consistent market structure.
On lower time frames, the market structure can often be less predictable and chop from highs to lows.
The best approach is to have a clear understanding of the market as a whole. This includes low time frame, medium time frame, and high time frame structure. Think about how each time frame works together.
| Time Frame | Volume | Market Structure | Trading Style |
| Low | Low | Difficult to identify (chop) | Scalping and Day Trading |
| Medium | Medium | Somewhat identifiable | Day Trading and Swing Trading |
| High | High | Easy to identify | Swing Trading |
Common Mistakes When Trading Market Structure
Even though market structure is simple in concept, it is often misused in practice. Common mistakes include:
- Treating every break of structure as a reversal
- Ignoring higher timeframe context
- Trading patterns without understanding overall structure
- Entering trades without confirmation
- Not defining clear invalidation levels
Market structure works best when combined with context, volume, and execution discipline.
Volume Profile Trading Strategies
Volume profile is often used alongside auction theory. By mapping where the majority of trades occur, traders can identify high-volume nodes (acceptance) and low-volume nodes (rejection) to guide trade entries and exits.
Market Dynamics in Finance
Auction theory and market structure both reflect the underlying dynamics of supply and demand. Together, they offer a lens into how financial markets function and why certain price behaviors repeat across different assets.
How Market Structure Influences Pricing and Competition
Market structure plays a direct role in how prices form. In trading, price changes reflect shifts in supply and demand. In economics, pricing decisions are influenced by competition levels, market concentration, and barriers to entry.
How Does Market Structure Influence Pricing Decisions?
In highly competitive markets, prices are driven by supply and demand with limited pricing power. In concentrated markets, such as monopolies or oligopolies, firms can exert greater control over pricing due to reduced competition.
What Factors Affect Competition?
Competition is influenced by regulation, access to capital, technology, market concentration, and the ease of entering or exiting a market. These factors determine how freely prices can adjust.
What Are the Fundamental Elements of a Market?
Every market consists of buyers, sellers, a pricing mechanism, and rules that govern transactions. In trading, these elements interact continuously through auctions that form market structure.
Examples and Trade Setups Using Market Structure
Market structure is not a trading strategy or specific setup. It’s more of a high-level concept that allows you to identify and understand overall market conditions.
It can be used to help with trade entries or more importantly, set invalidation levels and know when you’re wrong. You can also manage trades and babysit positions using market structure principles.
Here are some market structure examples:
Pullback or Retracement: When the market is in an up or downtrend, this pattern indicates that the price will push back and collect orders (producing a candle in the opposite direction) before continuing the trend.
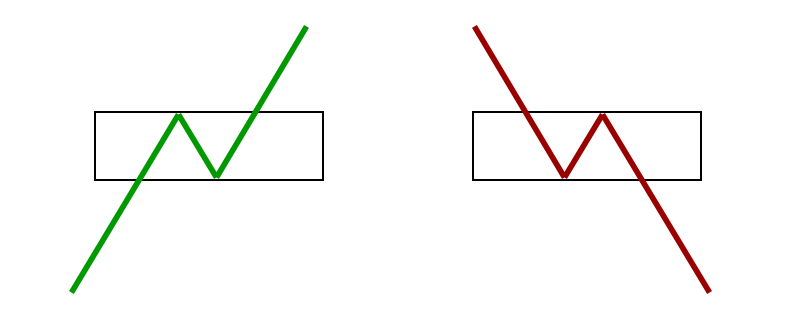
Structure Hold: This is essentially a return to a previous pullback, then the continuation of the prevailing trend. It can result in trapped traders that expect the market to reverse but note how the trend remains intact. No lower lows (in the bullish example) or higher highs (in the bearish example) are created.
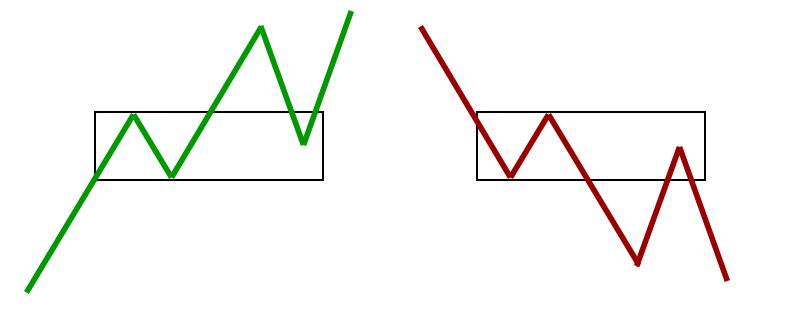
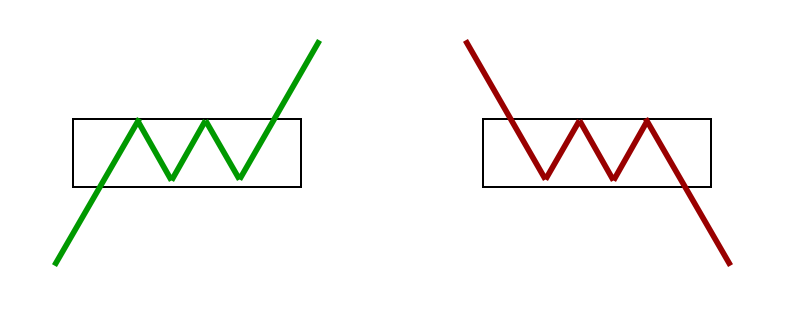
Continuation: This is a bullish or bearish structure where price forms a short consolidation or base before pushing higher. During the base period, traders reaccumulate or redistribute their position in anticipation of the next rally or drop. This can form a triangle or pennant pattern.
Advantages
Not only does market structure provide you with a clear overview of current market conditions and trends, but it can also help you identify support and resistance levels.
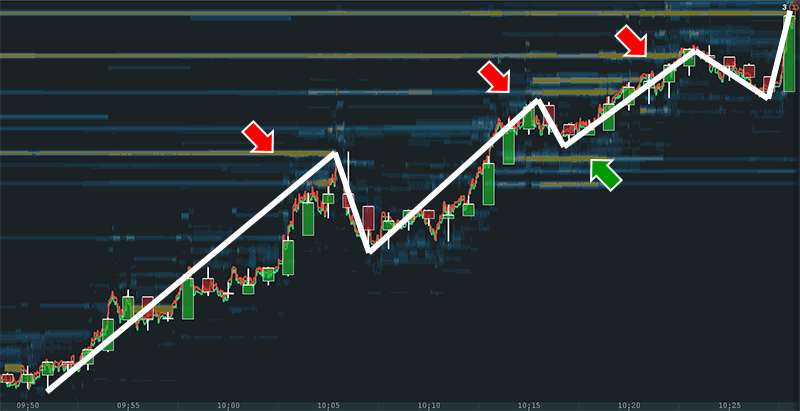
When using market structure to find support and resistance, look left and try to identify areas that have been consistently respected over time. If multiple tests have been performed at the same level there is a higher chance the level will be respected again.
Looking at the historical order book and identifying persistent resting liquidity can be a more reliable approach for identifying support and resistance levels. It removes the guesswork by showing the actual resting orders from other traders.
Understand Market Sentiment
Another benefit of using market structure in trading is that the market brings together the collective wisdom of multiple participants, weights it according to the size of the trades they make, and allows analysts to understand the collective sentiment.
Market structure has the advantage of defining when and at what price to buy and sell through trendlines and price goal targets, which has a significant benefit. After deciding on and marking out the borders of a possible formation, these boundaries correspond to a certain price and time coordinates that can be used to build specific trading and risk control strategies.
Auction Theory Trading in Forex
Forex markets, with their high liquidity and constant global activity, provide a clear environment for auction theory. Traders can analyze value areas and imbalances across pairs like EURUSD or GBPUSD to plan trades.
Auction Theory Trading for Futures
Futures markets are particularly well-suited for auction theory. High participation and centralized exchanges mean value areas and imbalances stand out clearly on tools like Bookmap’s heatmap or volume profile.
Day Trading Strategies with Auction Theory
Day traders use auction theory to time entries around intraday value areas. A common approach is fading excess at extremes and trading back toward balance, or joining breakouts when price leaves a value area with strong volume.
Limitations
Remember that the market can do anything at any given moment. Uncertainty of the market must be embraced and accepted. While market structure can provide clues, there are absolutely no guarantees and it only takes one significant aggressive buyer or seller to break the trend.
Market structure principles may appear quite simple, but the intricate details can take many years to master.
Market Structure vs. Other Trading Strategies
Market structure is a framework for reading price, not a standalone strategy — it’s commonly combined with, or compared against, other approaches:
- Indicator-based trading (moving averages, RSI, MACD) generates specific, rule-based signals. Market structure is more interpretive, requiring the trader to read swing patterns directly rather than following a calculated output — some traders combine both, using structure for context and indicators for timing.
- Pure price action patterns (head and shoulders, double tops, flags) are specific chart formations. Market structure is the broader framework those patterns exist within — most classic patterns are really just particular ways a structural break or continuation happens to look.
- Order flow analysis operates at a different level of granularity entirely — where structure describes the pattern of swing highs and lows over time, order flow shows the real-time buying and selling pressure at a specific price level right now. As covered elsewhere on this page, combining the two (structure for where to focus, order flow for what’s actually happening there) is generally considered stronger than relying on either alone.
None of these are mutually exclusive — most experienced traders layer market structure with at least one other framework rather than treating it as a complete system on its own.
Combine Order Flow With Market Structure to Increase Your Edge
Market structure tells you where to focus. Order flow shows what’s actually happening at those levels — whether buyers are absorbing sell pressure, whether momentum is increasing, or whether traders are getting trapped.
Without it, you’re trading in the dark. This is where the Bookmap comes in. Our cutting-edge platform lets you visualize the historic order book allowing you to see large market participants, identify trapped traders, and make smarter real-time decisions.
You can try it out today for free, click here to get started. We also offer lost a free education to get you up to speed. Watch the Market Education Basics playlist on Bookmap YouTube.
FAQ
What is the difference between market structure and trend?
Market structure refers to the underlying framework of how price moves, identifying swing highs, swing lows, support, and resistance levels. A trend is the consistent directional movement of price within that structure. Market structure tells you whether a market is trending, ranging, or transitioning.
How is market structure different from price action?
Price action focuses on individual price movements over time, while market structure organizes those movements into a broader pattern. For instance, multiple higher highs and higher lows in price action reveal a bullish market structure, helping traders understand the bigger picture.
How do you analyze market structure in trading?
Analyzing market structure starts with identifying whether the market is making higher highs and higher lows (bullish) or lower highs and lower lows (bearish). From there, traders map support and resistance zones, recognize shifts in momentum, and use patterns like pullbacks or continuations to guide entries, exits, and risk management.
Can market structure be combined with order flow analysis?
Yes. Combining market structure with order flow analysis gives traders a powerful edge. Market structure shows where important levels exist, while order flow (through tools like Bookmap) shows how participants behave around those levels. This fusion helps confirm breakout strength, detect false moves, and time entries more precisely.
Are you looking for a specific market to trade?
Auction theory can be applied across futures, forex, stocks, and crypto. The key is focusing on markets with enough liquidity for value areas to form clearly.
Are you interested in trading indicators based on auction theory?
Yes, indicators like volume profile and Market Profile are designed directly from auction market theory. Bookmap also provides order flow visualizations that complement these concepts.
Are you a beginner looking for an introduction to auction theory?
Auction theory can seem complex, but at its core it’s about buyers and sellers finding balance. Beginners can start by learning how value areas form and how imbalances often precede directional moves.
Auction Theory Trading
Auction theory provides a framework for interpreting market structure beyond simple patterns. It explains why support and resistance form and how price transitions between balance and imbalance.
Auction Market Theory for Trading
By understanding markets as auctions, traders can better anticipate where price will gravitate. Bookmap’s order flow tools make this process more transparent, showing how large participants influence auction outcomes in real time.
What is the difference between market structure in finance and economics?
Market structure in finance focuses on price behavior, trends, and liquidity. In economics, market structure describes competition, pricing power, and industry organization.
Are you referring to price trends or the economic regulation of exchanges?
The term “market structure” can refer to two different concepts. In trading, it describes how price moves through trends and liquidity behavior. In economics, it refers to how industries and exchanges are organized and regulated.
Do you want to focus on micro-level liquidity or macro swing points?
Some traders use market structure for short-term execution and liquidity analysis, while others focus on higher timeframe swing structure and broader trend direction. Both approaches rely on understanding how price organizes itself over time.
What is a market structure shift indicator?
A market structure shift indicator attempts to identify when a trend changes direction by tracking breaks of swing highs and lows. Many traders prefer reading structure manually rather than relying entirely on automated indicators.
What are BOS and CHOCH in smart money concepts?
BOS (Break of Structure) and CHOCH (Change of Character) are terms used in smart money concepts trading to describe shifts in trend behavior and market momentum.
Sign Up Now
Latest Articles