See single stock futures more clearly in real time.
Compare plans to access deeper market visibility for single stock futures.
Futures
June 26, 2025
SHARE
What Are Single-Stock Futures? A Lower-Cost Way to Trade Big Names Like Apple and Nvidia

Ever tried pushing a door that won’t budge? Trading single-stock futures (SSFs) can feel the same when you are up against a massive sell wall. SSFs are different from traditional stock trading. They let you speculate on individual stocks with leverage. This amplifies both your risk and reward. But in volatile markets, timing is everything!
Most traders use our advanced market analysis tool, Bookmap, to perfect it. With it, you can reveal hidden layers of market activity and see where large players are placing big buy and sell orders.
Want to spot these liquidity zones precisely? In this article, we will learn how to identify these key levels, understand absorption, and spot potential reversals. Read until the end to stop wondering why that door just won’t open!
What Are Single-Stock Futures?
Single-stock futures (SSFs) are contracts that allow you to:
- Buy or sell shares of a specific company,
- On a future date, and
- At a set price.
Unlike index futures, which cover a group of stocks, SSFs focus on just one stock! For more clarity, let’s study its characteristics through the graphic below:

Key Features of SSFs
After understanding the characteristics, now study these key features of SSFs:
| Contract Size | Trading Hours | Settlement |
|
|
|
Want leveraged exposure to top stocks? Explore single-stock futures using Bookmap’s tools.
Why Single-Stock Futures Appeal to Low-Capital Traders?
Single-stock futures (SSFs) are a practical choice for retail traders with limited funds. They provide access to leverage and allow you to bypass certain equity trading rules while trading them. In a way, SSFs let you trade stock movements without dealing with complex option strategies.
Let’s gain more clarity and study why they appeal to low-capital traders:
Lower Margin Requirements
When you trade SSFs, you don’t need the full capital to buy 100 shares of a stock. Instead, you only need to deposit a fraction of the total value as margin.
For Example:
-
- Suppose Apple shares trade at $180 each.
- A standard SSF contract represents 100 shares.
- This means a total value of $18,000.
- To buy these shares outright, you’d need the full $18,000.
- However, with SSFs, you only need 10% to 20% of the contract value as margin.
- If the margin requirement is 10%, you’d only need $1,800 to open the position.
This leverage allows small traders to control more shares with less capital. However, please note that leverage also amplifies both gains and losses (so risk management is important).
No PDT Rule (Pattern Day Trader)
In the U.S., equity traders using margin accounts need at least $25,000 to avoid the Pattern Day Trader (PDT) rule. For the unaware, PDT limits the number of day trades within a 5-day period.
Be aware that SSFs do not fall under the PDT rule. This means you can make multiple intraday trades without maintaining a $25,000 account balance. It provides more flexibility for traders who prefer frequent and smaller trades without being restricted by equity market regulations.
Straightforward Leverage Without Options Complexity
In options trading, you have to consider multiple factors like:
- Deltas,
- Greeks,
- Time decay, and
- Expirations.
Thus, it can be complicated for traders who only want to speculate on a stock’s price direction. In contrast, SSFs offer a more straightforward approach. Let’s learn how through the graphic below:
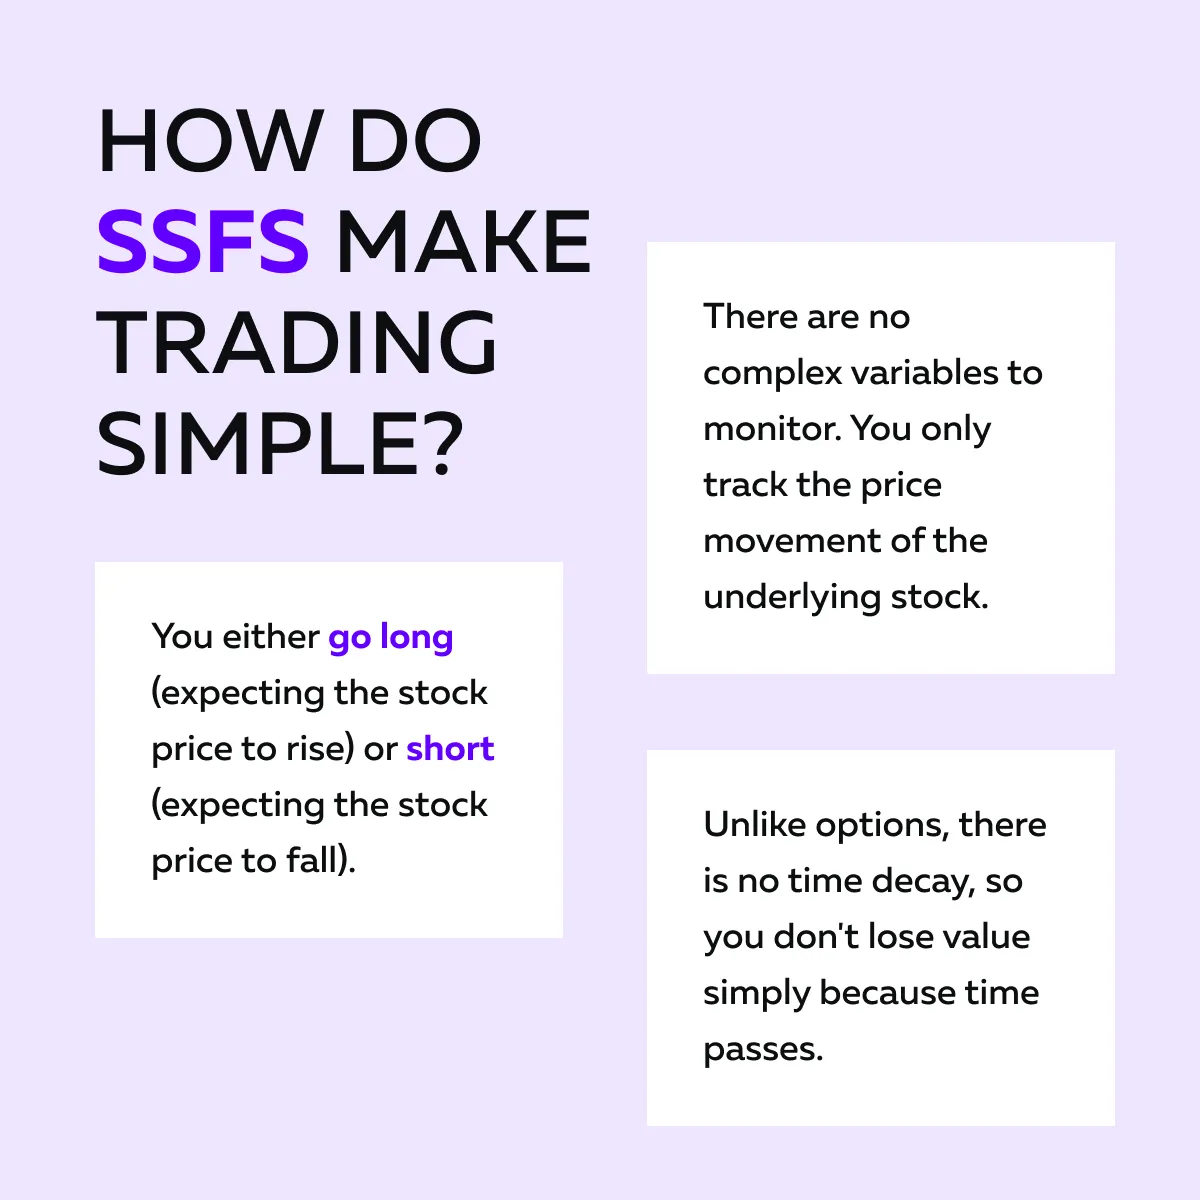
This simplicity makes SSFs attractive to traders who want leveraged exposure to a stock without managing multiple options strategies.
What Stocks Can You Trade as Futures?
Using SSFs, you speculate on the price of specific stocks without directly owning them. However, not all stocks have futures contracts, but some well-known ones do! Let’s check them out:
Common Single-Stock Futures
Below are some popular stocks that are often available as futures:
| Stocks | Nature of Company |
| Apple (AAPL) | A widely traded tech giant. |
| Nvidia (NVDA) | Known for its graphics processing units and AI chips. |
| Tesla (TSLA) | A major player in the electric vehicle sector. |
| Meta (META) | Parent company of Facebook, Instagram, and WhatsApp. |
| Amazon (AMZN) | Dominates e-commerce and cloud computing. |
Please note that each SSF contract mostly represents 100 shares of the underlying stock. As a trader, you can go long (buy) or short (sell) based on the price outlook. Trade names like AAPL and NVDA with a fraction of the capital—learn how with Bookmap.
Availability and Exchanges
The availability of SSFs depends on the broker and the exchange. In the U.S., single-stock futures were previously offered by “OneChicago,” but that exchange shut down in 2020. Since then, access to SSFs in the U.S. has been limited, and not all brokers offer them.
However, international exchanges still provide access to SSFs. For example:
- Brazil’s B3 Exchange is a key market for single-stock futures.
- It offers a wide range of stocks as futures.
- It allows traders to access leverage and hedge positions.
Ideally, before trading, always check with your broker to confirm which stocks are available as futures contracts. Availability can vary significantly based on location and exchange partnerships.
How to Trade Single-Stock Futures Using Order Flow?
Want to trade single-stock futures (SSFs) profitably? Keep in mind–it involves more than just predicting price direction! It also requires analyzing where significant buying and selling activity is occurring in real time.
So, how to identify this? By performing an order flow analysis. This technique allows you to precisely identify areas where large buy or sell orders are likely to impact price movement.
Step 1: Track Key Liquidity Zones Before and After the Open
Before the market opens, you should look for areas where substantial buying or selling occurred during the:
- Pre-market
or
- After-hours sessions.
Be aware that these zones often act as important price levels during regular trading hours. Below are some key liquidity zones you must monitor:
| Key liquidity zones to track | Explanation |
| Overnight Highs and Lows |
|
| Pre-Earnings Gaps |
|
| VWAP Zones (Volume-Weighted Average Price): |
|
| Psychological Round Numbers |
|
Why Track Liquidity Zones?
Liquidity zones are areas where large orders are likely to be placed. By spotting these areas, you can gain insight into likely reversals or breakouts. Let’s study an example scenario:
Before the Market Opens,
- Apple futures are trading near $200.
- You see large sell orders just above $200 on Bookmap.
- These are big sellers, ready to sell at or slightly above $200.
- Below $200, there aren’t many buy orders.
- This suggests there isn’t strong support to prevent the price from dropping.
When the Market Opens,
- The price moves up toward $200.
- However, it can’t break through the large sell orders.
- This shows that buyers don’t have enough power to push the price higher.
- If buyers continue to fail to break through $200, it signals that the price might drop.
After the Open,
- Now, suppose you start seeing large buy orders appear below $200.
- These buy orders hold their ground.
- They don’t disappear even as sellers try to push the price lower.
- This suggests that some big players are accumulating shares.
- Such a situation indicates a likely move upward.
How Can You Track Order Flow?
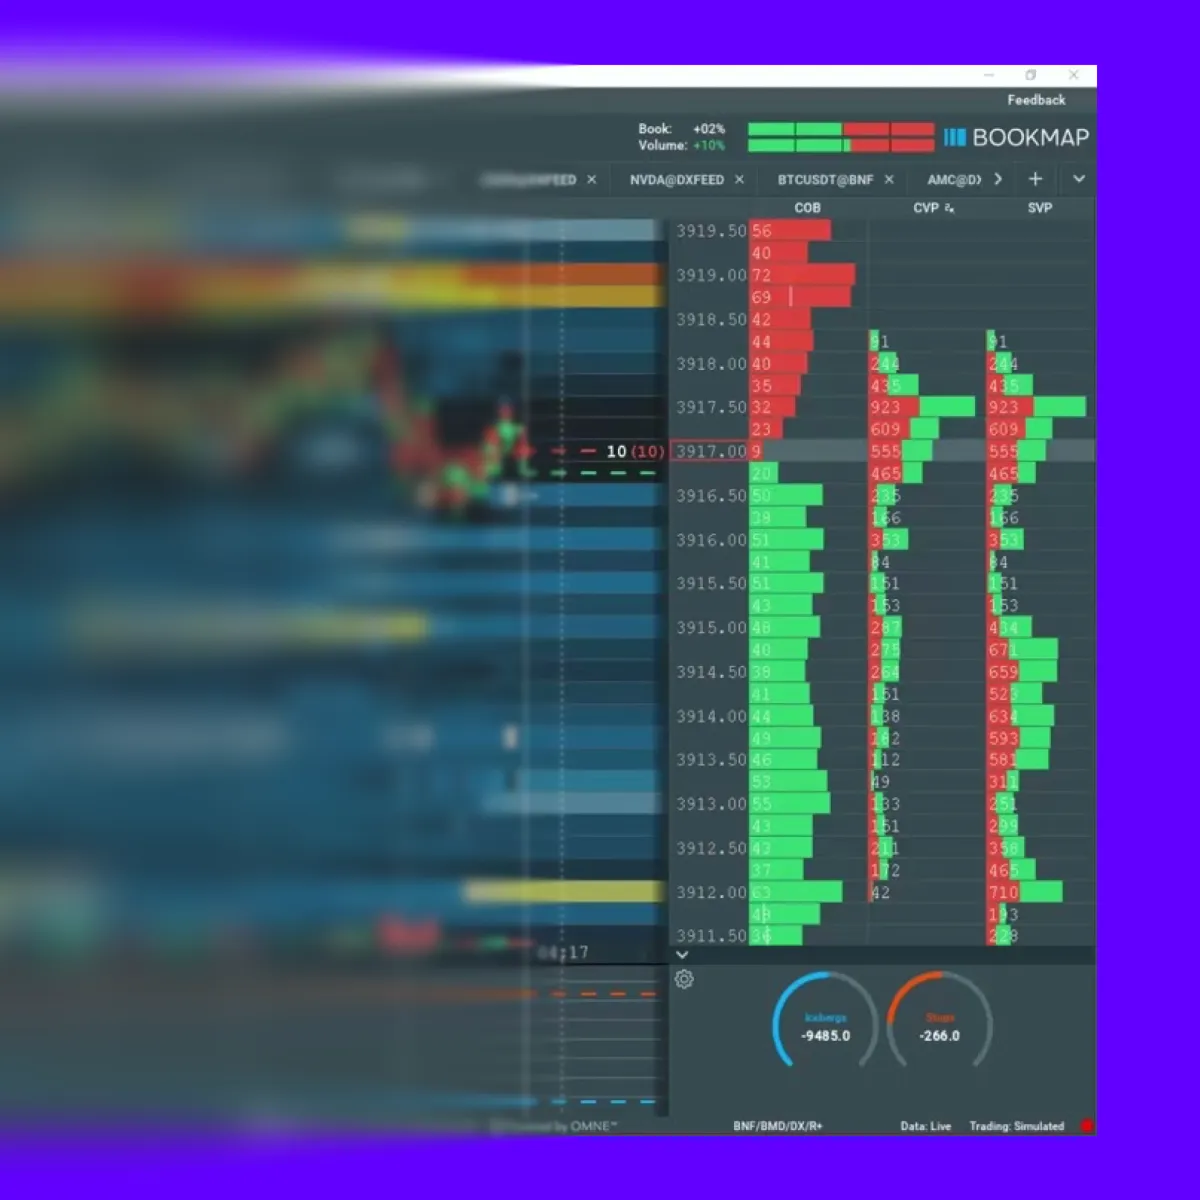
By using our advanced market analysis tool, Bookmap, and its various features, you can easily track order flow. Let’s see how:
- Visual Heatmap: Shows where large buy and sell orders are resting.
- DOM (Depth of Market): Displays real-time buy and sell orders at various price levels.
- Time and Sales: This section displays actual executed trades, allowing traders to see whether large orders are being absorbed or rejected.
How to Trade Single-Stock Futures Using Order Flow?
Once you’ve identified key liquidity zones, the next step is to monitor how the market interacts with those levels. To do this, you should:
- Analyze volume,
- Spot absorption, and
- Manage volatility.
Step 2: Use Volume and Absorption to Confirm the Move
Liquidity zones indicate where large orders are sitting. However, you also need to observe how the market reacts to those orders. This is where volume and absorption come into play! Let’s understand what you should look for:
| Aggressive Volume | Absorption |
|
|
Let’s gain more clarity through an example:
- Tesla Futures Hit $650
-
- You are monitoring Tesla futures.
- The price reaches $650.
- This is a key level you have marked as significant.
- It is important because there has been heavy trading activity around it before.
- This means it is a price point where many traders are interested in buying or selling.
- Large Buy Orders Appear
- On Bookmap, you see many large buy orders hitting the offer at $650.
- This means aggressive buyers are trying to push the price higher by placing market buy orders at $650.
- Price Doesn’t Move Higher!
- Despite the aggressive buying, the price fails to move above $650.
- This is a red flag.
- If there is heavy buying pressure, you’d expect the price to rise.
- Since it’s not moving up, it suggests something is blocking it.
- Large Sell Wall Remains Intact
-
- You notice a large sell wall at $650.
- A sell wall is a huge cluster of sell orders stacked at a specific price level.
- This sell wall is absorbing the aggressive buyers.
- The seller accepts all the buy orders but does not let the price move above $650.
- What does this mean?
- The seller is likely a big player offloading a large position.
- Despite heavy buying pressure, the seller keeps placing more sell orders at $650.
- They are absorbing all the incoming buy orders.
- Since the buy orders can’t break through the sell wall, it indicates that:
- Buyers are running out of steam
and
- The seller is still in control.
- This behavior often signals a likely reversal to the downside.
- This happens because the:
- Buyers get exhausted
and
- The price may start to drop.
Step 3: Expect and Manage Volatility Spikes
SSFs provide leverage, which can amplify price movements—especially in high-beta stocks like:
- Nvidia (NVDA),
- Tesla (TSLA), and
- Amazon (AMZN).
These stocks often experience sharp spikes during news events or earnings reports.
Why Do Volatility Spikes Occur?
| Earnings Reports | Macro News | Quarter-End Rebalancing |
|
The following events can trigger sudden moves:
|
|
How to Manage Volatility?
- Reduce Position Size
-
- Leverage can magnify losses during volatile periods.
- Lowering your position size can limit your exposure.
- Wait for Volume Clusters
-
- After a major price spike, wait for a consolidation period where volume clusters form.
- This is where large traders often reposition.
- It provides clues about the next move.
- Avoid Chasing Big Moves
-
- When the price moves sharply up or down, avoid jumping in blindly.
- Look for liquidity confirmation.
- For example, if a green candle spikes but no substantial buy orders are supporting it, it could be a false breakout.
Conclusion
Through SSFs, you can gain exposure to stocks like Apple (AAPL) and Nvidia (NVDA) without needing the full capital to buy shares outright. They offer leverage, flexibility, and a simpler structure compared to options. However, they also come with significant risk.
To minimize these risks, you must understand how liquidity and volume interact (particularly during volatile sessions). By using our advanced real-time market analysis platform, Bookmap, you can see where large orders are positioned and whether those orders are being absorbed or breaking through. Through this visibility, you can prevent costly mistakes and improve trade timing. Watch liquidity shifts in real time when trading single-stock futures.
FAQs
1. What are single-stock futures?
Single-stock futures (SSFs) are trading contracts that allow you to trade a specific stock at a set price on a future date. They work like index futures but focus on individual stocks.
You can:
- Go long (buy)
or
- Short (sell) with leverage.
While trading using SSFs, you only need to deposit a fraction of the stock’s value to trade.
2. Why use SSFs instead of options?
SSFs provide direct exposure to a stock’s price movement without the complexities of options. You don’t have to worry about options concepts like:
- Time decay,
- Volatility, and
- Greek calculations.
You simply trade based on whether you expect the stock to rise or fall. Also, you can use leverage for larger potential gains or losses.
3. Are single-stock futures available in the U.S.?
Access to SSFs in the U.S. is limited and depends on your broker. Many U.S. brokers don’t offer them.
However, international markets like Brazil’s B3 Exchange have a wider selection of SSFs. They are available for even well-known global stocks like Apple, Nvidia, and Tesla.
4. How does Bookmap help when trading SSFs?
Our advanced market analysis tool, Bookmap, shows real-time data related to where large buy and sell orders are placed in the market. This lets traders:
- See where big players are entering or exiting,
- Spot hidden selling or buying pressure, and
- Identify likely reversal points during volatile trading periods.
Sign Up Now