See volume more clearly in real time.
Compare plans to access deeper market visibility for volume.
Market Structure
January 22, 2026
SHARE
Why Volume at Price Matters More Than Volume Over Time
Are you a trader staring at a candlestick chart thinking, “There has to be more to this story?” If so, congratulations! You’re thinking like a trader who’s ready for the next level. That’s because in today’s market, price alone is just the headline.
So, where’s the real story? It hides in the volume, not just “when” it prints, but “where” it actually trades.
And here’s another catch you need to know. Most beginners start with volume bars because every platform offers them. They’re helpful, but they can also be misleading. A big red candle with high volume tells you activity was heavy. However, it does not indicate where inside the candle that activity happened. And that missing detail can be the difference between spotting a genuine breakout and falling for a fake-out.
Want to avoid fake-outs and trade with sharper precision in 2025-26? Read this article to learn the difference between volume over time and volume at price. Understand how tools like Bookmap reveal the market’s true intent, and how you can use these insights to trade smarter, with both confidence and accuracy.
What Is Volume Over Time?
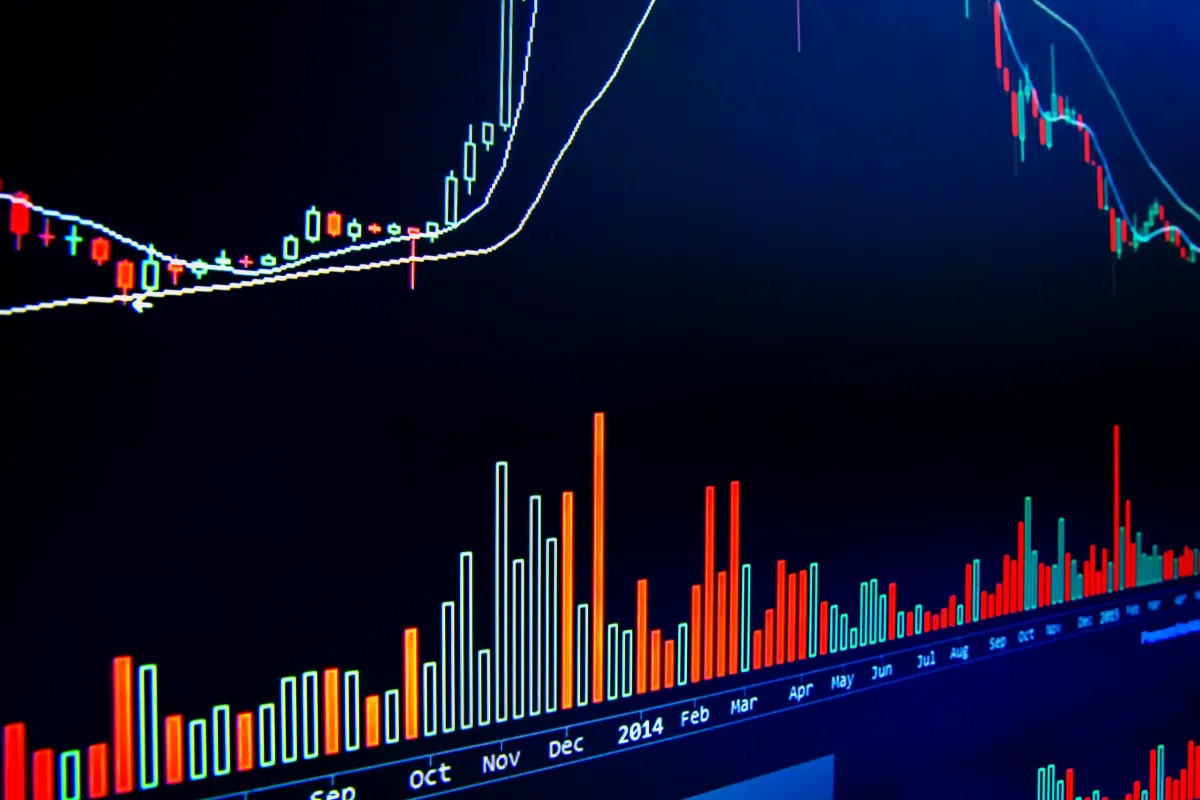
Volume over time is one of the most familiar ways traders track activity. You’ve probably seen it right below your price chart as a “series of vertical bars,” also referred to as “standard volume sub chart”. It displays the number of shares, contracts, or lots traded during each time interval (such as 1 minute, 5 minutes, or 1 hour). For example, a tall bar under a red candle tells you that a lot of selling took place during that minute.
But are such charts enough in 2025? It’s a big NO! That’s because these charts don’t tell where inside that candle the trades occurred. Let’s take another example:
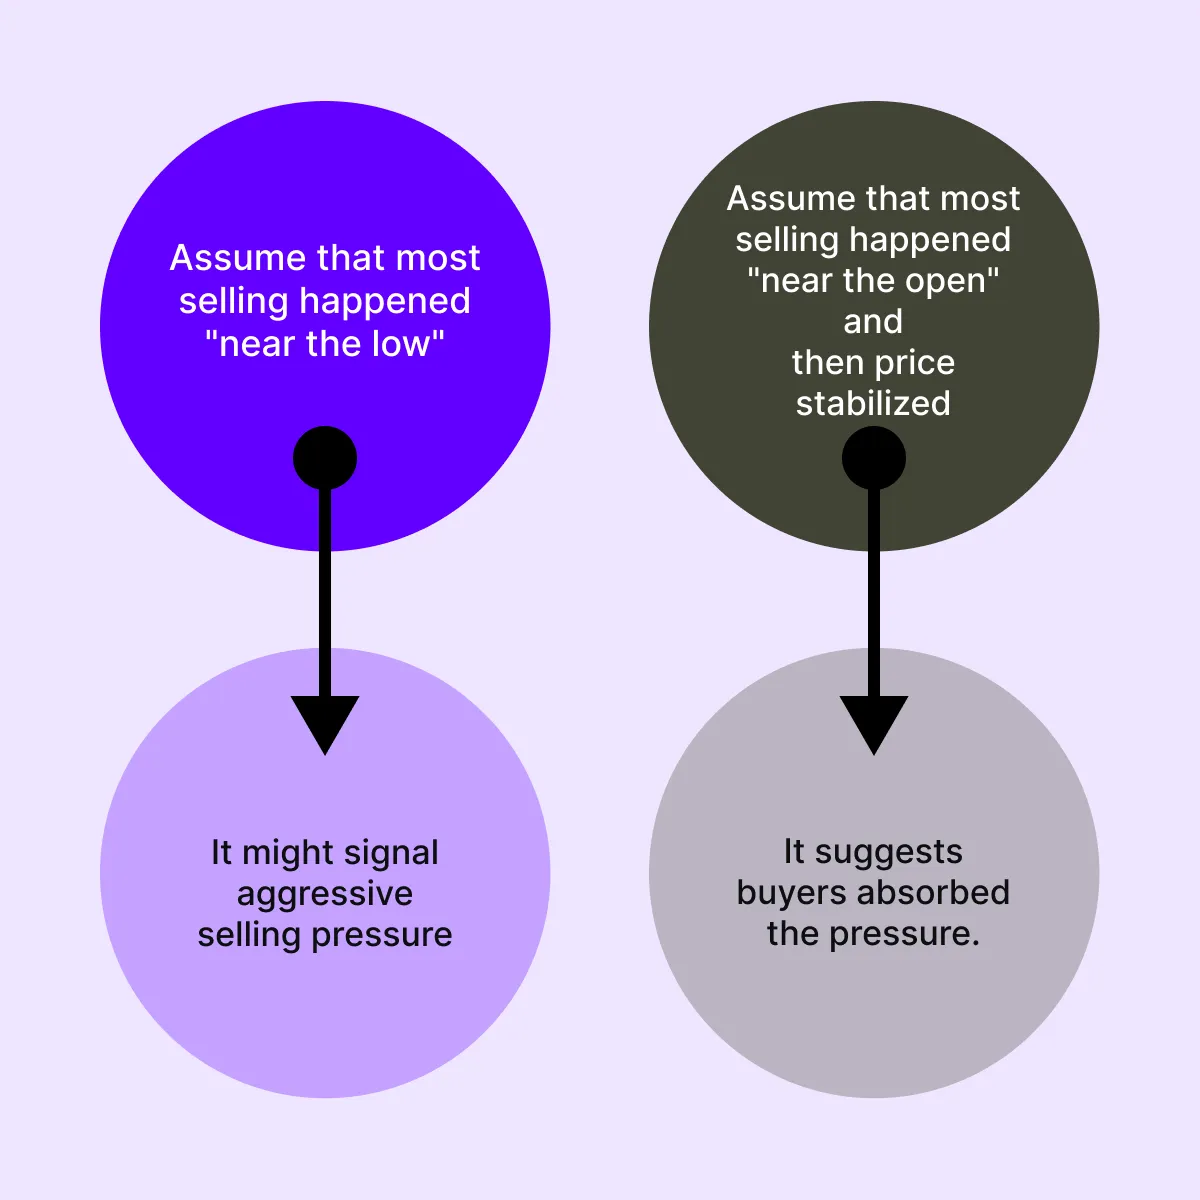
- Assume that you see a 1-minute red candle.
- It moves from 4382 to 4378 with a high-volume bar beneath it.
- Your interpretation? There is heavy activity.
- But you still don’t know if traders sold mostly at 4382, near 4378, or somewhere in between.
Now, that information can make a big difference. Let’s see how:
See how volume at price looks in Bookmap’s real-time heatmap.
The Limitations of Volume Over Time
While volume over time is helpful for a quick overview, it’s limited when it comes to execution decisions. It does not help you when you’re trying to decide where to enter or exit a trade. For more clarity, let’s check out its three major limitations:
| I) Doesn’t Show Where Traders Were Active | II) Doesn’t Separate Aggressive Buys from Passive Sells | III) Can’t Confirm or Contradict Price Moves |
|
|
|
The Solution? Traders Go Beyond Volume Over Time
Due to the limitations mentioned above, many traders explore “volume profile trading”. It is a more advanced method that looks at “volume at price” instead of “volume over time”.
What Is Volume at Price?
Volume at price gives you a price-based view of market activity. Instead of showing how much trading happened over time (like in a standard volume subchart), it displays the volume of trading at each price level.
Okay, but how does it work? When you use volume at price, the chart aggregates (or adds up) all the trades that occurred at each individual price point. For example,
- Let’s say 600 contracts were traded in one minute.
- Now, instead of showing this, the chart shows you something much more precise, breaking it down like this:
- 4,500 contracts at 5382.75,
- 5,000 contracts at 5383.00, and
- 2,500 contracts at 5383.25.
This detailed breakdown enables traders to identify specific price levels where buyers and sellers interact most frequently. If you don’t want to stare at this long list, you can use advanced platforms like Bookmap, which visualize this data through:
- Volume dots,
- Columns, and
- Volume profiles.
Through this analysis, you can see exactly where the action took place.
What Volume at Price Reveals About Market Behavior
Be aware that each cluster of high or low volume at a specific price tells a story about trader behavior:
| Event | Signal | Interpretation |
| High Volume at Price | Acceptance or absorption |
|
| Low Volume at Price | Rejection or quick movement |
|
Benefit of this insight? Understanding these signals helps you easily evaluate whether a breakout candle had real conviction. For example,
-
- Let’s say volume is concentrated away from the highs or lows of a breakout.
- Now, that can be a red flag!
- The move might lack genuine support.
In this way, when you read volume in trading, combining both views (volume at price and volume over time), you get a complete picture of market behavior.
Key Differences: Volume at Price vs Volume Over Time
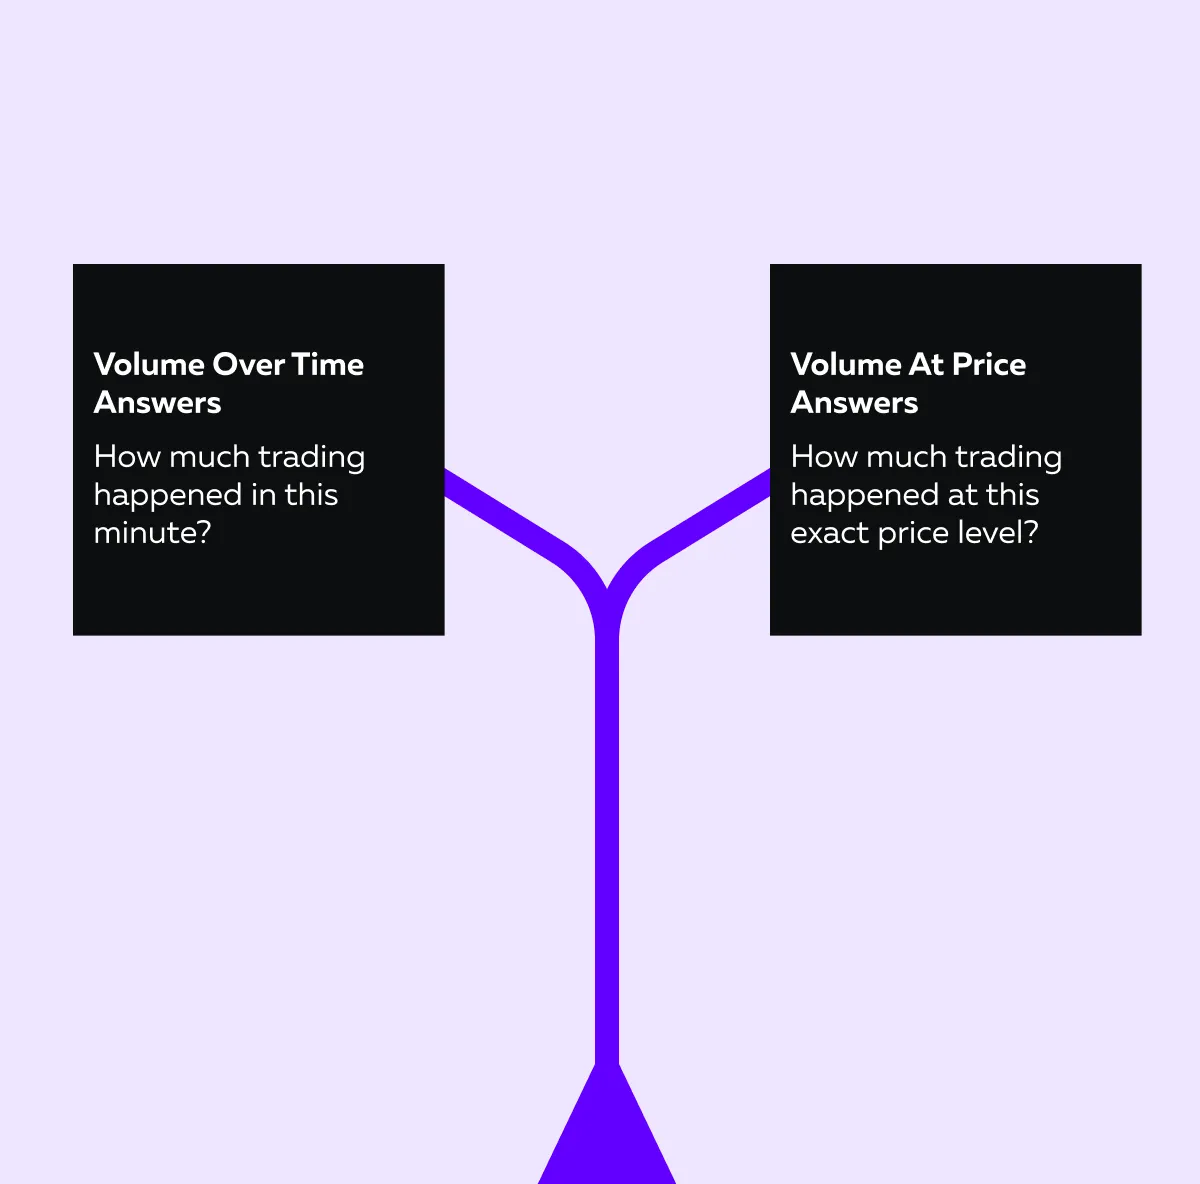
Both volume at price and volume over time help traders understand market activity, but from different angles. One focuses on where trading happens, while the other focuses on when. To improve your understanding, check out their major differences:
Spatial vs Temporal Orientation
Volume over time acts as a “timeline”. It tells you when traders were active. For example, you might see a large volume bar below a candle. It shows heavy trading during that specific minute or hour.
In contrast, volume at price is “spatial”. It shows where and at which exact price levels traders were most active. This makes it far more relevant when identifying:
- Key trading levels
and
- Support or resistance zones.
Use in Real Setups
Let’s look at how these differences play out in real trading through the two cases delineated below:
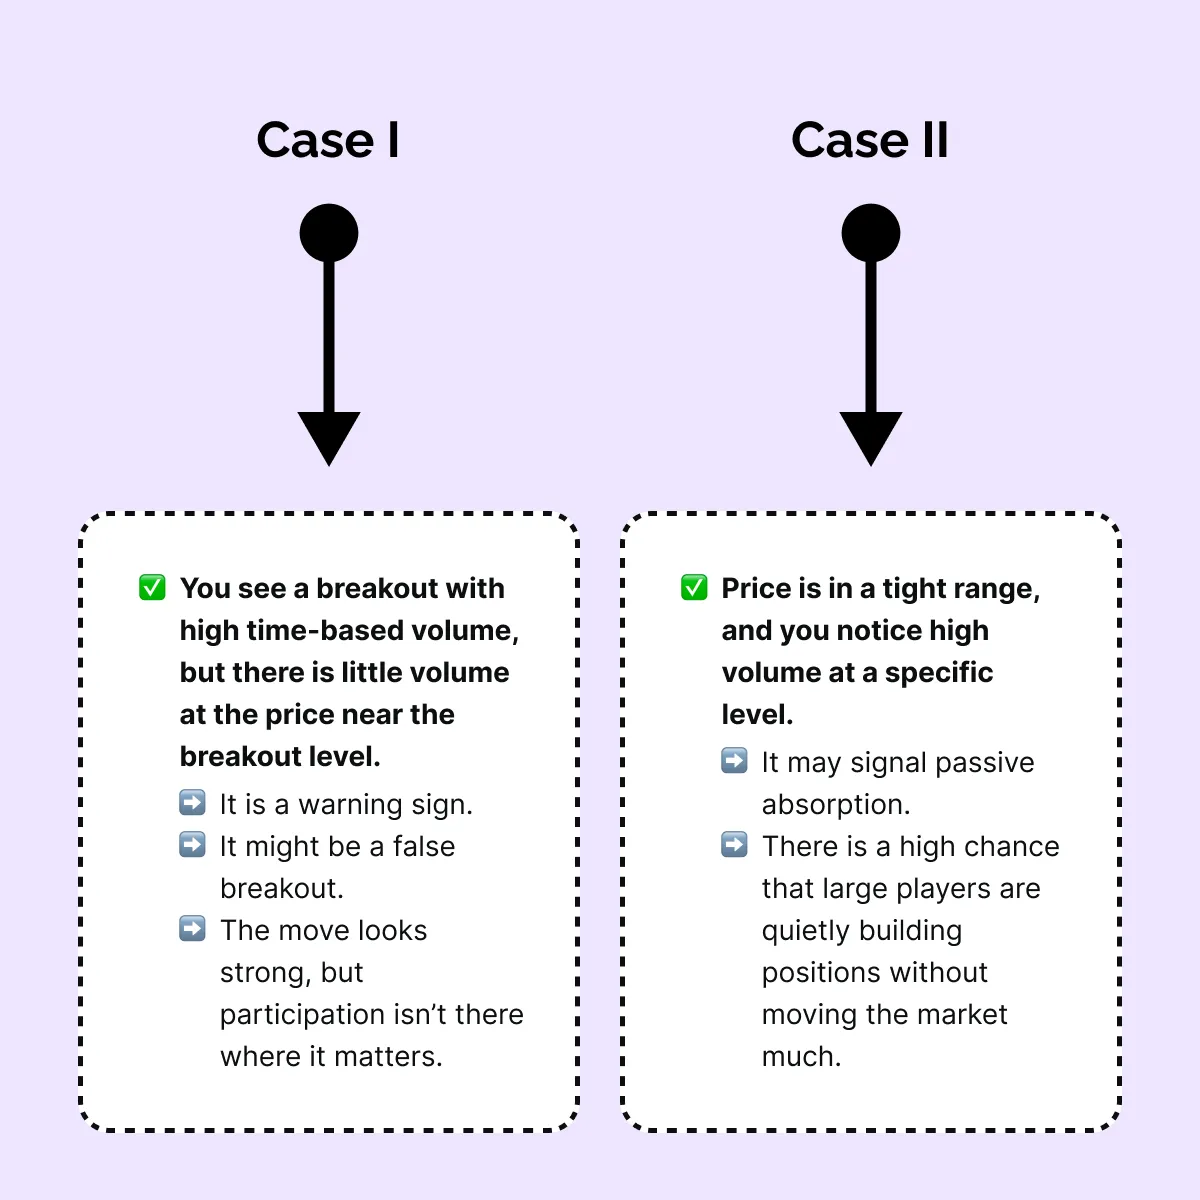
This is why many traders prefer using volume profile trading. Through it, they can pay close attention to volume concentration zones rather than just volume spikes.
Better Alignment with Liquidity
Volume at price aligns naturally with liquidity concepts. You can see if:
- Volume is building into an iceberg order, where hidden liquidity is gradually being filled.
or
- Volume is disappearing as price moves toward resting liquidity, where limit orders are waiting.
What is its advantage? By making this observation, you can easily separate “real” support and resistance levels from the levels that only appear important on a regular chart. You can know where actual buying or selling interest exists.
Trading Applications of Volume at Price
When you see volume at price, you don’t just react to candles or indicators. Instead, you start reading the real footprints of traders. Such an observation gives you two crucial insights:
- Where have traders committed their capital?
and
- How did that commitment influence the market’s next move?
Let’s learn how this insight applies directly to your trading:
1. Reading Support and Resistance with Real Context
Most traders draw support and resistance lines based on highs and lows. But do you know the major problem with those levels? They can be deceiving if they’re not backed by real trading activity.
Here, volume at price offers you a solution. Using it, you can anchor zones to actual traded volume. This means you base your levels on where traders actually bought and sold in large quantities.
2. Spotting Absorption and Market Intent
Absorption happens when large buyers or sellers absorb market pressure without letting the price fluctuate much. If you notice high volume at a price level but there is no major price change, it’s a sign that big players are either getting filled or defending that level.
Want to visualize this? You can use Bookmap’s heatmap + iceberg or stop indicators. Through them, you can easily identify whether large orders are being genuinely filled or simply used as bait to trick other traders. This level of detail gives deep insight into market intent and liquidity behaviour.
3. Filtering Out Noise in Chop or Consolidation
During sideways markets or choppy conditions, traditional volume over time usually looks high. However, that activity can be scattered across many price levels. By analyzing volume at price, you can spot whether:
- Volume is concentrated, suggesting a buildup before a move
or
- Volume is dispersed, indicating random noise.
The advantage? Such an analysis lets you avoid false signals and stay patient until true conviction appears. Compare volume over time vs volume at price live in Bookmap.
Bookmap Tools That Display Volume at Price
Bookmap is one of the most advanced trading platforms for visualizing volume at price. Instead of showing only price movement over time, it reveals how and where trading activity actually occurred.
Let’s learn about some Bookmap tools you may use:
Volume Dots and Volume Columns
In Bookmap, every executed trade appears as a volume dot on the chart:
| Blue Dots | Red Dots |
| Represent buy orders | Represent sell orders |
These dots show real-time trade flow and tell who’s hitting the bid or lifting the offer. Additionally, just next to the price axis, volume columns add up all these trades at each price level. Together, they create a “live volume profile” that displays where most trading effort is concentrated.
The major benefit of this view? You can instantly see whether activity is one-sided (mostly buying or selling) or balanced.
Integration and Confluence with Other Tools
What makes Bookmap even more powerful is how it integrates volume data with liquidity tools such as Stops & Icebergs and Liquidity Tracker Pro. With these tools, you can easily see:
- Where hidden liquidity sits (iceberg orders)
and
- How volume reacts when price approaches those zones.
For more clarity, let’s study an example:
Let’s say you notice a high volume at a certain price, along with an iceberg order. Even though a large resting size is sitting there, the price isn’t moving much. This usually signals absorption and shows that a big player is quietly getting filled and absorbing market orders.
Now, consider the opposite scenario:
- Let’s say price moves toward a resting liquidity zone and the volume suddenly thins out.
- In response, traders stop participating, and nobody is willing to hit those orders.
- What does this indicate? It signals weak conviction and can warn you of a fake-out.
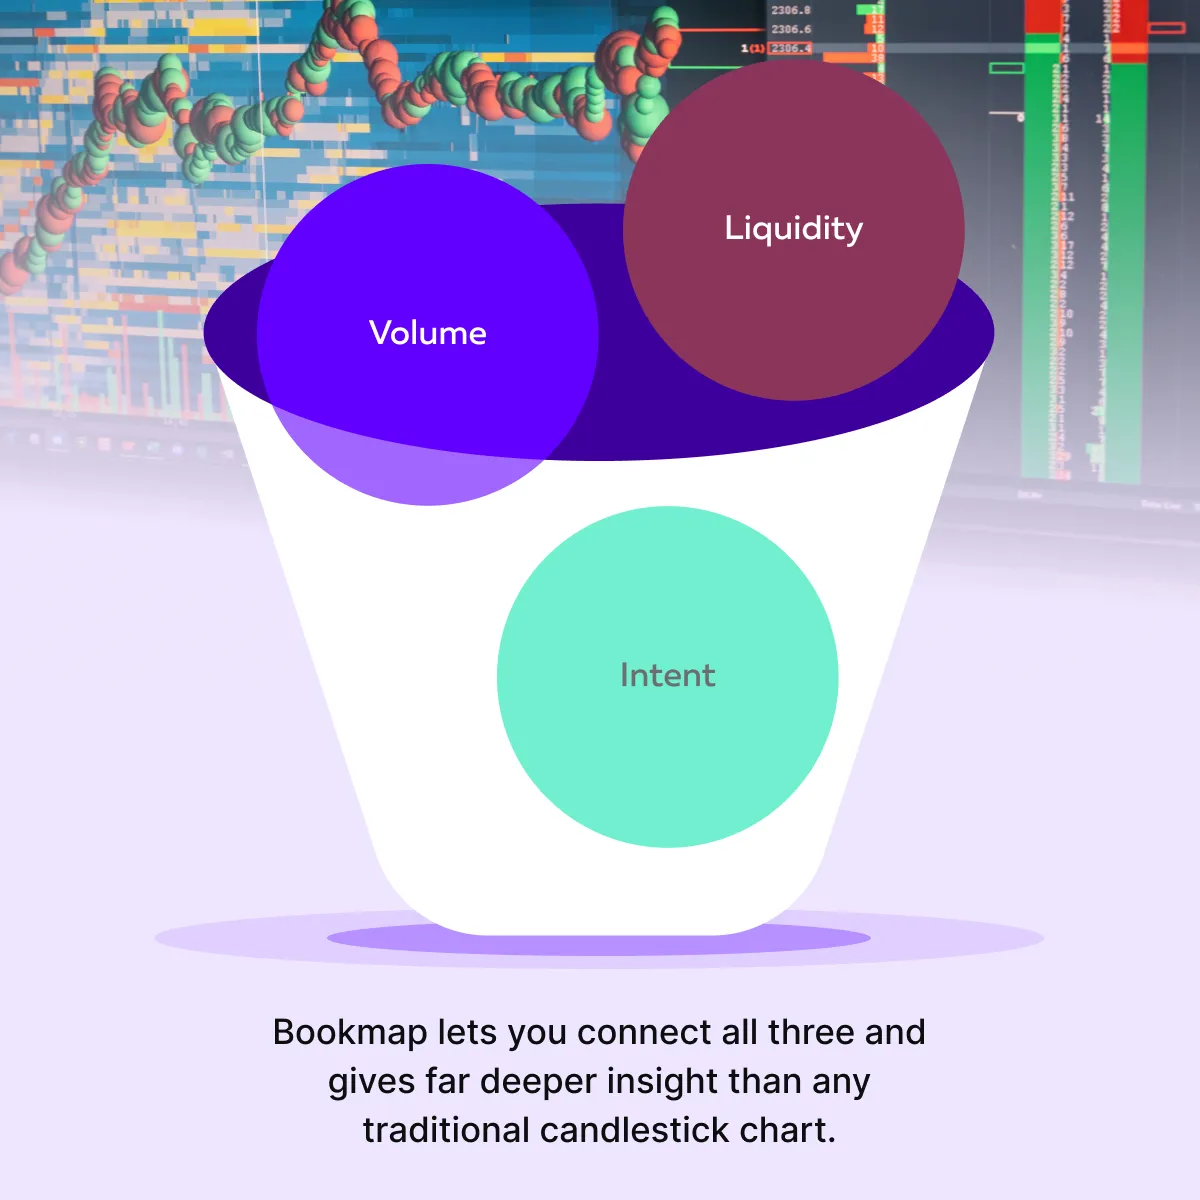
This real-time interaction between volume and liquidity gives you insights that no basic candlestick or time-based volume chart can offer.
Historical and Live Analysis
Bookmap isn’t just for live trading! It’s also a powerful learning and review tool. On Bookmap, you can replay entire sessions to watch the following:
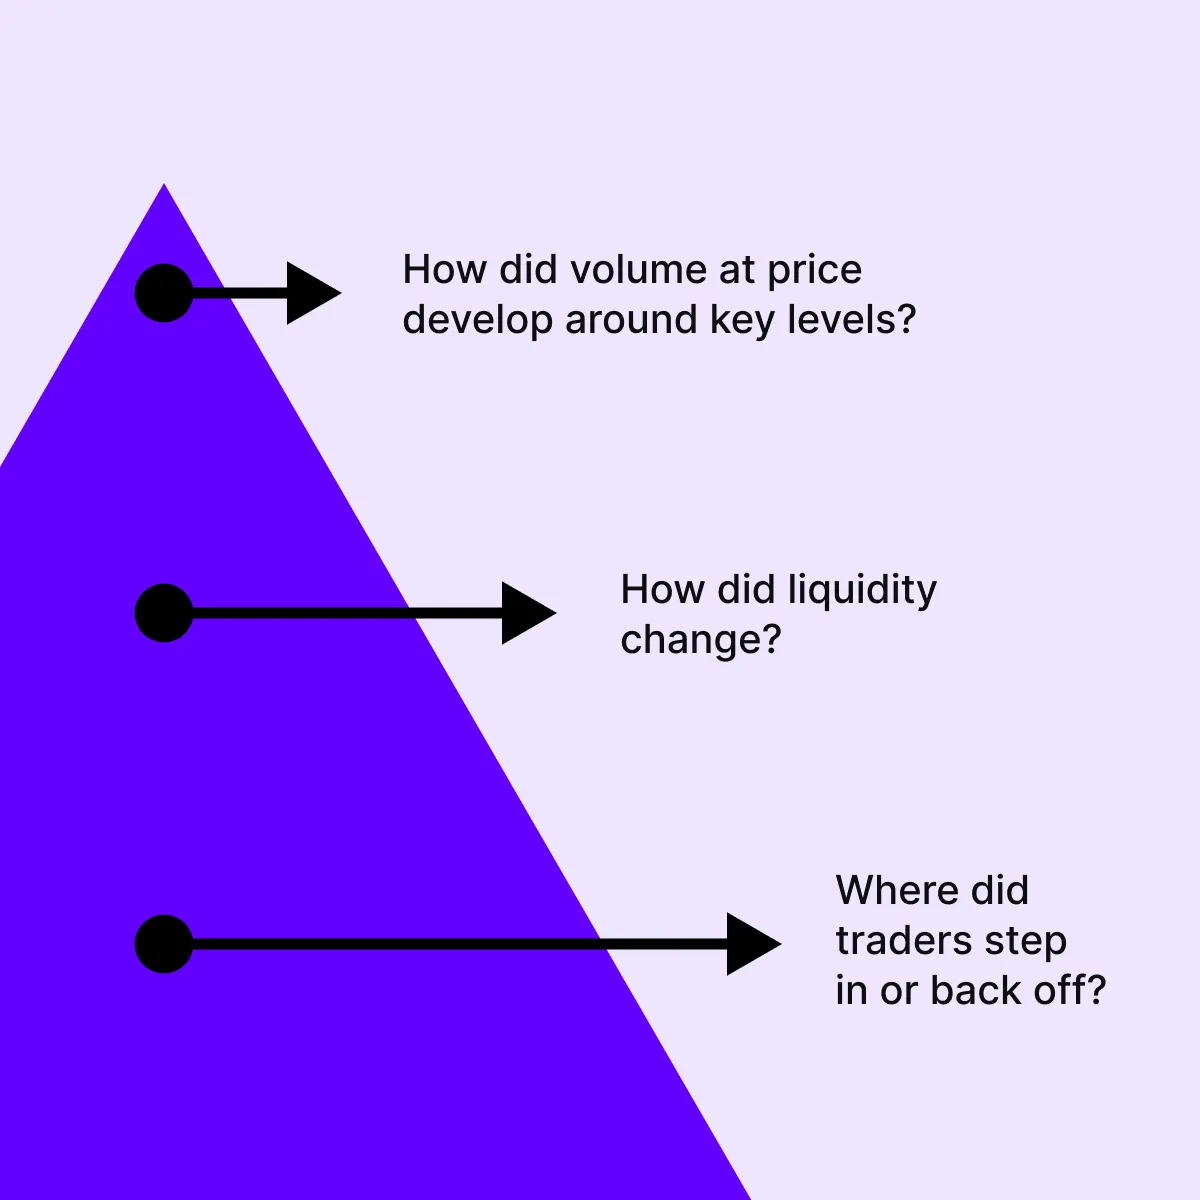
Bookmap is also widely used to journal and review failed trades and refine setups. By using it, you can compare your execution with actual market activity and identify what you missed.
Conclusion
By now, you must have understood that traditional volume bars or volume over time definitely have their use. They show how much trading happened during a certain period. But if you want to truly understand why the price moved and where traders took action, you need to look deeper. And that’s where volume at price comes in.
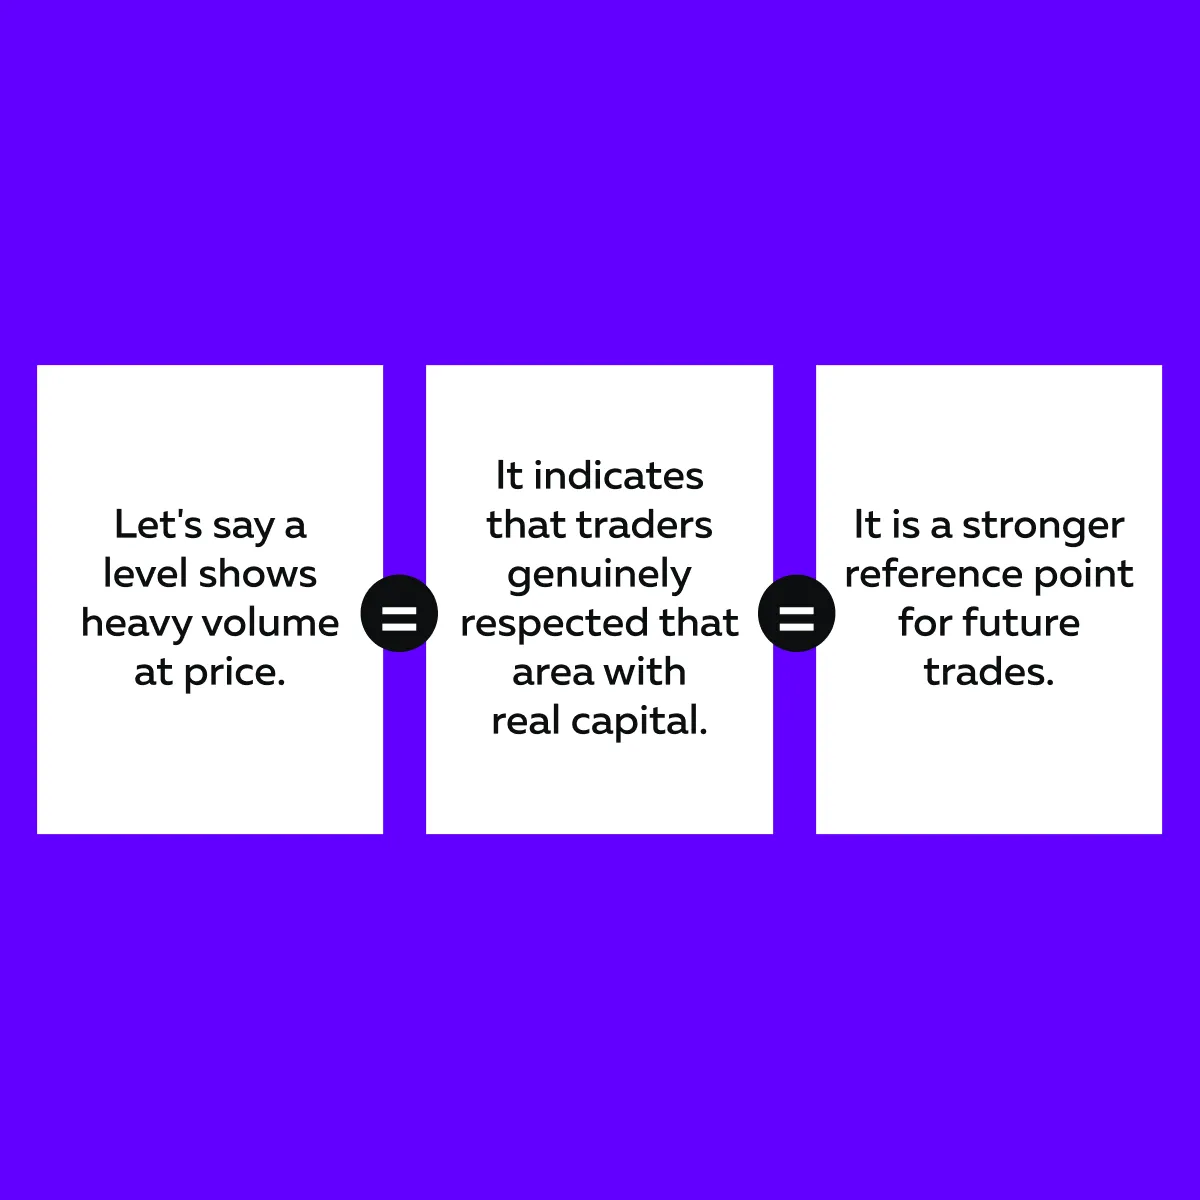
When you focus on “where” volume occurs (not just when), you can see which price levels traders respected with capital. Also, you can identify genuine support or resistance zones and spot potential absorption or breakout setups.
No matter if you trade futures, stocks, or crypto, learning how to read volume in trading through volume profile trading gives you a major edge. And with tools like Bookmap, this data is now available in real time and down to each tick. Try volume profile and volume dots with Bookmap Global+
FAQs
1. What is the volume at price?
Volume at price measures how much trading happened at each price level (not over time). It shows where buyers and sellers were most active. This insight enables you to identify true support, resistance, and areas where the market showed real interest.
2. Is volume at price the same as volume profile?
They’re closely related. Volume profile is a charting tool that displays volume at price over a chosen time range. Market analysis platforms like Bookmap show this in real time with volume dots and columns. On them, you can see live trade flow and price interaction.
3. Why is volume over time less useful for precision trading?
That’s because it only shows “when” trading happened and not “where”. That means you can’t see exact price levels where traders were active. This lack of information makes it harder to judge market strength, spot absorption, or avoid false breakouts.
4. Does Bookmap support volume at price?
Yes. Bookmap displays:
- Volume dots for each trade
and
- Volume columns aggregated by price.
You can even filter trades by size, aggression, or instrument to see how real participation builds at major price levels.
5. Can this apply to stocks and crypto, too?
Yes, volume at price works in any market with good liquidity, from stocks to futures to crypto. In volatile markets like BTC or Nasdaq futures (NQ), it’s particularly valuable and can help you time trades with more precision.
Sign Up Now