See market more clearly in real time.
Compare plans to access deeper market visibility for market.
Trading Basics
January 3, 2026
SHARE
Get Ahead in 2026: Essential Market Analysis Skills for Traders

Trading isn’t about predicting the future. Instead, it is about preparing for it. As we approach 2025, markets are evolving, and traders require new tools to succeed. To manage this ever-changing market, you should master market analysis in 2025.
From understanding order flow analysis to tracking market depth and liquidity zones, modern traders nowadays have powerful tools at their fingertips! These tools can be used to interpret market sentiment easily and anticipate price movements.
In this article, we will see the most effective analysis techniques for 2025, such as:
- Volume and delta analysis for spotting momentum,
- Liquidity zones for optimizing entry and exit points,
and
- Sentiment indicators to assess the overall market mood.
By using these advanced trading techniques, you can better prepare for volatility. Also, you can refine your strategies and ultimately make more confident decisions. Let’s begin.
Key Market Analysis Techniques for 2025
To approach market analysis for 2025, traders need advanced tools and techniques. They allow them to track market sentiment and price movement in real time. Four key techniques that can give traders a comprehensive edge in the upcoming year are:
- Order flow analysis,
- Understanding market depth and identifying liquidity zones,
- Volume and delta analysis, and
- Sentiment analysis.
Let’s understand all of them in detail.
Technique I: Order Flow Analysis
Order flow analysis allows you to track and interpret real-time buying and selling orders. Analyzing the volume and intensity of these orders helps identify market sentiments. Also, you can anticipate the likely direction of price movements.
Example,
- Let’s assume you notice an order imbalance.
- There’s a substantial volume of buy orders for $100.
- This suggests that there is substantial demand.
- Now, you place a buy order just above this level.
- You expect the price to bounce from this support.
- That’s because seeing a large block of buy orders gives you a signal that this level is solid support.
- Also, this suggests it could be a good entry point for a buy position.
- Now, please note that conversely, if sell orders outweigh buy orders by a large margin, this could indicate an impending price drop.
In 2025, this method will be key. It will help you to refine your trading techniques by predicting short-term price movements.
Technique II: Analyzing Market Depth and Liquidity Zones
Market depth displays all buy and sell orders at various price levels. It provides a window into where liquidity is concentrated. This is important for advanced traders because these liquidity zones act as dynamic support or resistance levels in the market. They help traders in the following ways:
In a high-volatility environment, these liquidity zones become even more valuable. For example,
- Let’s say a trader identifies a cluster of heavy sell orders around a recent high.
- Now, this indicates a resistance level.
- Knowing this, the trader might choose to place a take-profit order for a short position at this level, anticipating that the resistance will hold.
By using these methods, traders can smartly manage liquidity zones and better prepare for 2025 trading. However, please note that liquidity situations shift rapidly as they are based on the following:
- Economic conditions,
- Institutional activity, and
- Broader market trends.
Therefore, to further enhance market analysis for 2025, traders can use tools like:
- Volume and delta analysis,
and
- Sentiment analysis.
These tools allow you to check market strength and crowd psychology. Using these advanced trading techniques, you can perform the following steps:
Technique III: Volume and Delta Analysis
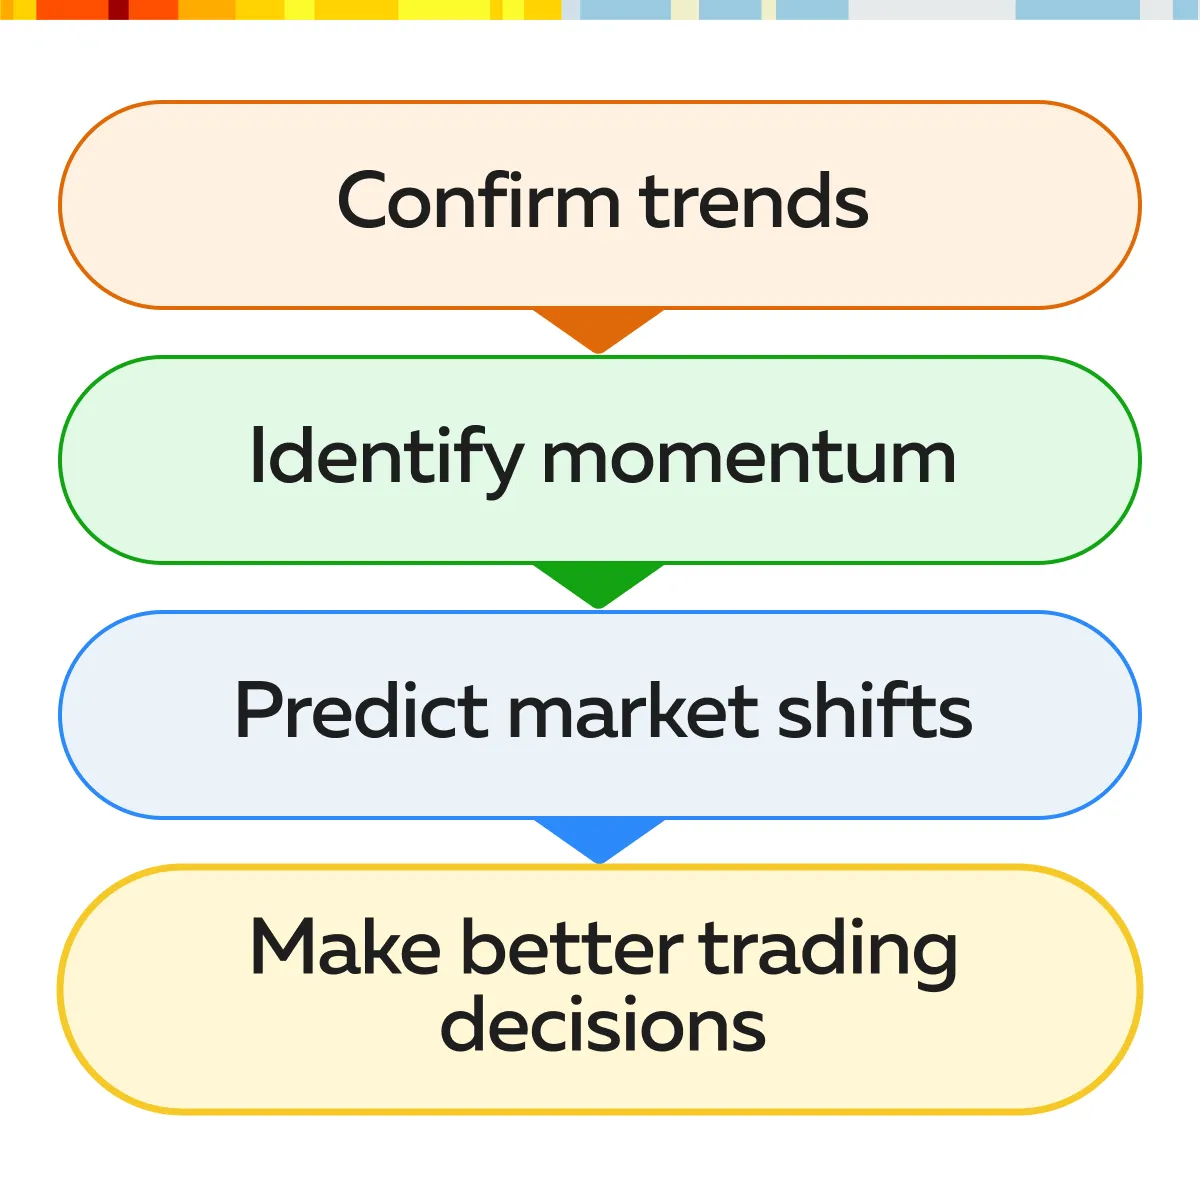
Volume analysis tracks the total quantity of trades executed over a given period. High trading volume confirms the strength of a price movement, whether it is an uptrend or a downtrend. That’s because it shows that there is significant market interest. However, volume alone doesn’t reveal whether buyers or sellers are in control. Delta analysis proves to be valuable in this context.
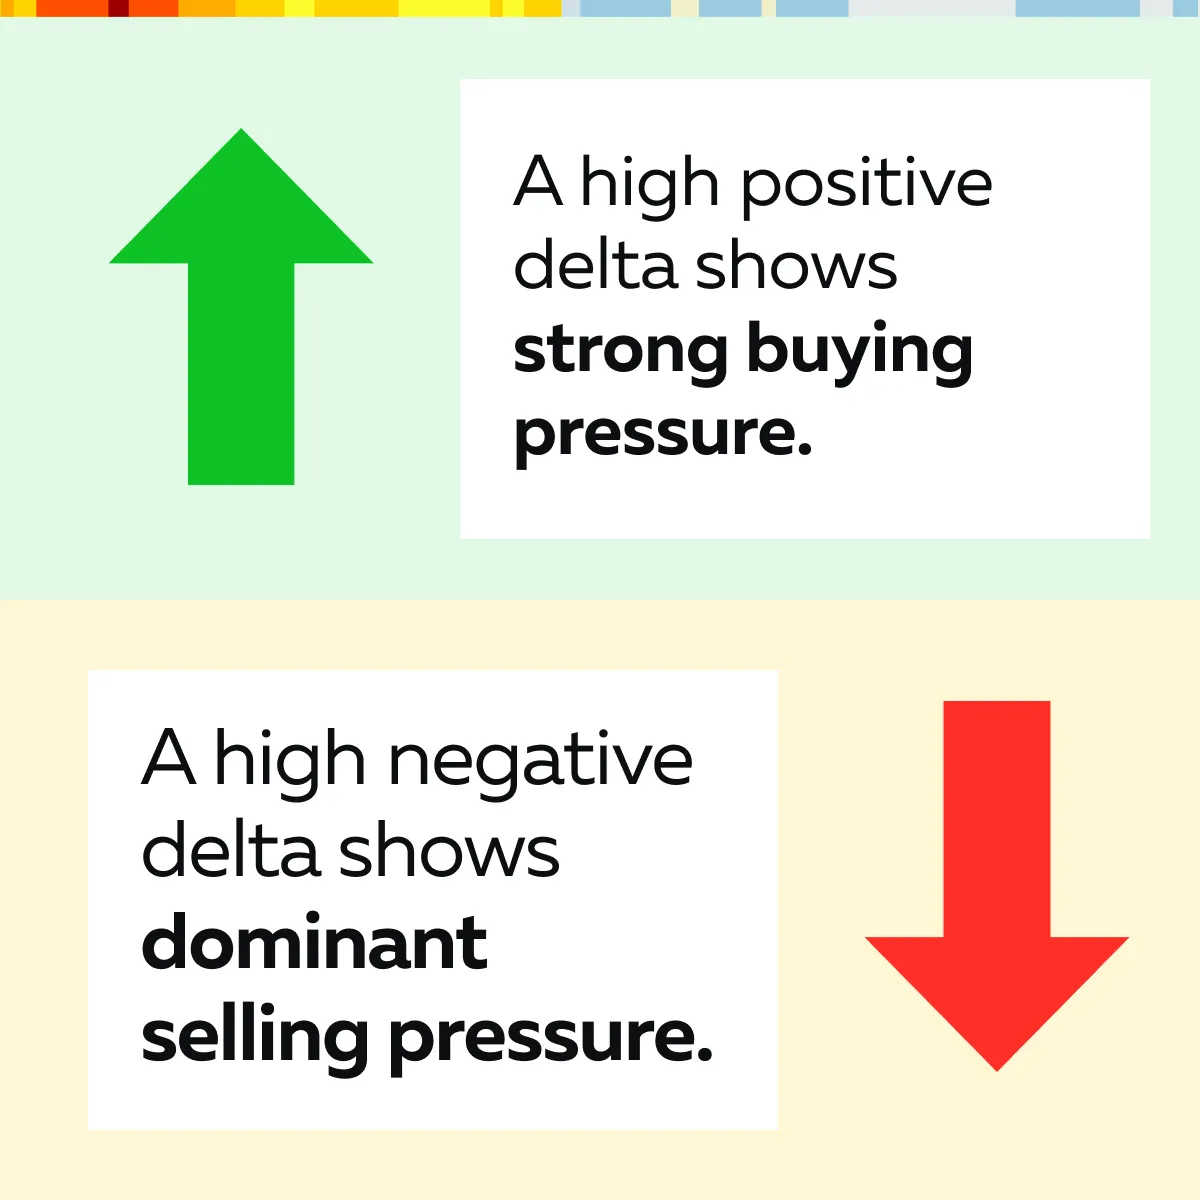
Delta represents the net buying or selling volume. It is calculated by determining the difference between buy and sell orders. Let’s see what indications it gives:
Together, volume and delta provide traders with a clearer understanding of the market sentiment. Example:
-
- Let’s say during a price breakout, there is a high positive delta.
- This delta is combined with an increasing volume.
- This shows that there is substantial buying momentum behind the move.
- Such an alignment of volume and delta gives traders added confidence.
- They can enter or expand long positions, as it signals strong market conviction.
Technique IV: Sentiment Analysis and Market Sentiment Indicators
Sentiment analysis measures the mood of both retail and institutional investors. It analyzes the following:
- News,
- Social media,
- Financial websites, and
- Other sources of market commentary.
Be aware that in hype-driven sectors like tech or crypto, sentiments change quickly. By tracking sentiments, you can easily identify overbought or oversold conditions. For example,
-
- Let’s say a trader notices overwhelmingly positive sentiment on social media about a specific stock.
- However, rather than jumping in immediately, the trader uses order flow analysis.
- They want to see if there are heavy buy orders at a key support level.
- If order flow data confirms buying interest at strong support, the trader takes this as a signal to enter a long position.
- In this way, it relies on both sentiment and real-time market data to reduce risk.
As you prepare for 2025 trading, combine volume and delta with sentiment indicators to interpret the market more accurately. By following this approach, you can effectively capitalize on market sentiment shifts and stay in touch with prevalent supply and demand positions that are shaping price action.
Applying Analysis Techniques to 2025 Market Scenarios
When preparing for 2025 trading, you must apply market analysis techniques across different scenarios. This can be done through:
- Liquidity zones,
- Volume and delta analysis, and
- Sentiment indicators.
Through them, traders can enhance their decision-making process, especially in high-volatility and news-sensitive markets. Let’s understand in detail:
How to Trade Based on Liquidity Zones?

Liquidity zones refer to certain specific areas. These areas represent zones where high volumes of buy and sell orders are clustered. These zones are valuable for traders. By executing trades around high-traffic price levels, you can reduce slippage. Also, it ensures better entry and exit prices and increases accuracy.
Moreover, during critical times, like earnings season, liquidity zones are especially useful.
Example:
- Let’s say a trader observes that institutions are placing large buy orders around a specific support level during an earnings announcement.
- Now, this is a strong indicator that big players see value in the stock at that price.
- By anticipating a rebound at these support levels, the trader can place a long entry with increased confidence.
- In this way, they can capitalize on the market sentiment indicated by institutional buying.
Ready to optimize your trading strategies for 2025? Try Bookmap’s comprehensive market analysis tools.
How Can You Adapt Volume and Delta Analysis in High Volatility?
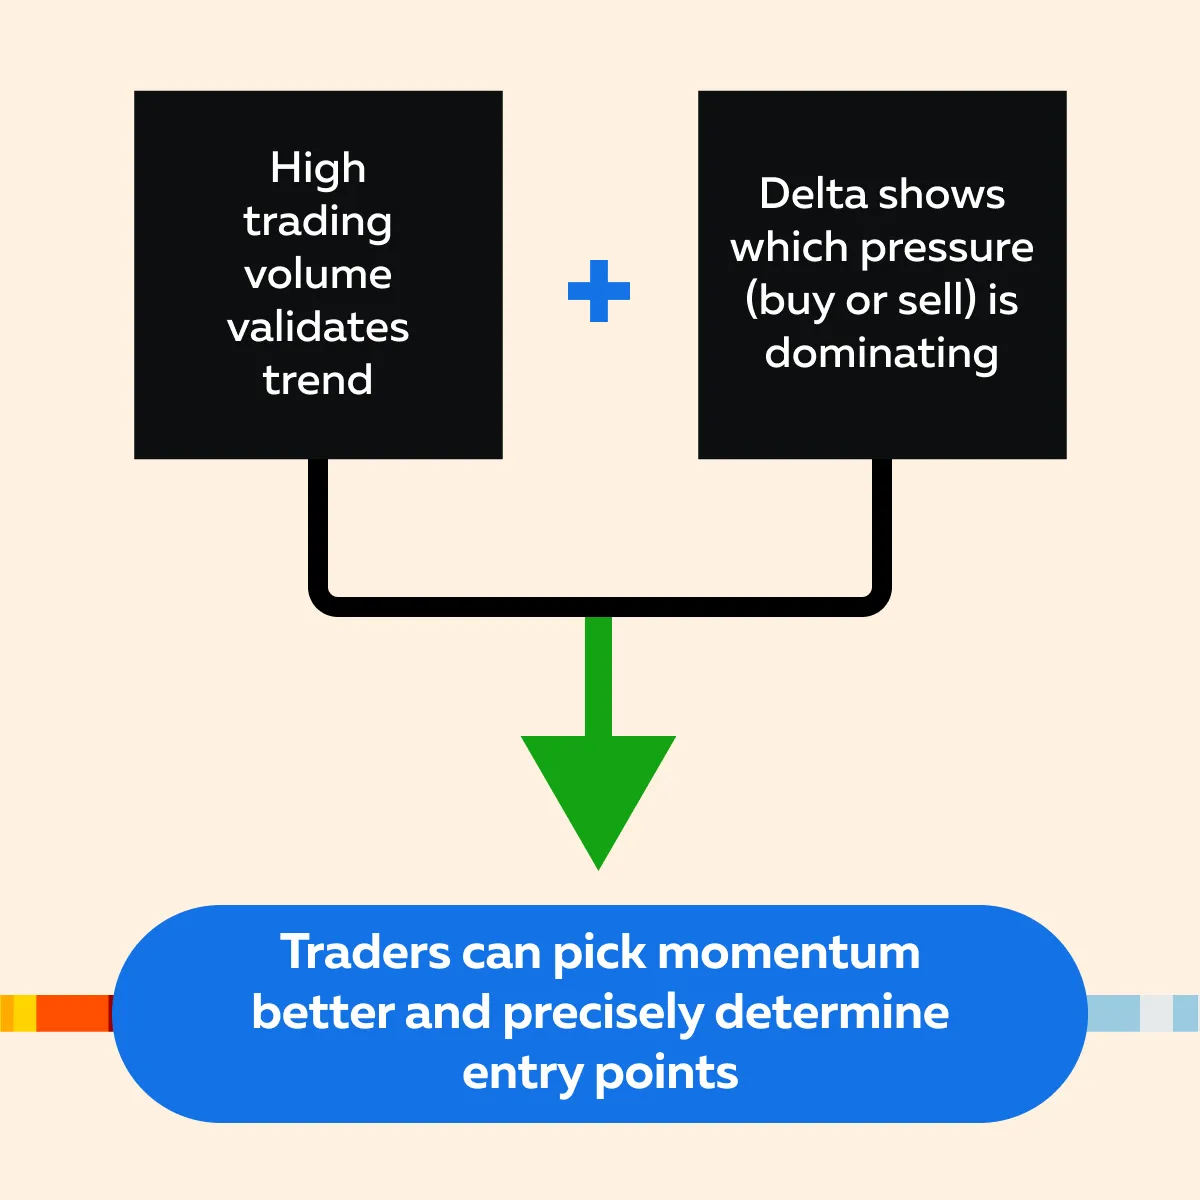
In a high-volatility market, volume and delta analysis are used to identify strong and rapid moves. High trading volume generally confirms the strength of a trend. On the other hand, delta shows whether buying or selling pressure dominates the market. Together, these indicators allow traders to:
- Gauge momentum,
and
- Validate potential trade entries.
See the graphic below:
Let’s understand this strategy better through an example:
-
- Let’s say a positive news release causes a volume spike.
- This release is accompanied by a high positive delta.
- This combination indicates strong buying pressure.
- A trader observing this pattern feels more secure in taking a long position.
- When they observe that volume and delta are aligned, they can confirm strong buying sentiment more confidently.
- This gives traders an edge in detecting validated entry signals.
How to Combine Sentiment and Technical Analysis?
Sentiment analysis measures the market’s mood. It is especially relevant for:
- News-sensitive
and
- Hype-driven stocks.
By using sentiment indicators in combination with technical data, traders can confirm trends or reversals. This gives them additional information for better timing their trades. Let’s understand this strategy through a scenario:
- Let’s say a company publishes a positive earnings report.
- A trader observes a spike in sentiment indicators (positive mentions on social media).
- Also, they witness an increasing delta in real-time market data.
- They have now decided to enter a long position.
- Such an alignment of sentiment and technical data confirms the bullish trend.
- Moreover, it suggests that both retail and institutional players are contributing to the stock’s movement.
Important Tip
As you prepare for 2025, you should master these combined techniques:
- Trading based on liquidity zones,
- Adapting volume and delta analysis, and
- Using sentiment alongside technical indicators.
Mastering these combined techniques will help you easily deal with complex and fast-paced markets with confidence and precision. Track market sentiment and liquidity shifts with Bookmap’s advanced data visualization.
Preparing for 2025: Practical Steps to Implement Analysis Techniques
To approach the new year with increased resilience, you should perform the following practical steps:
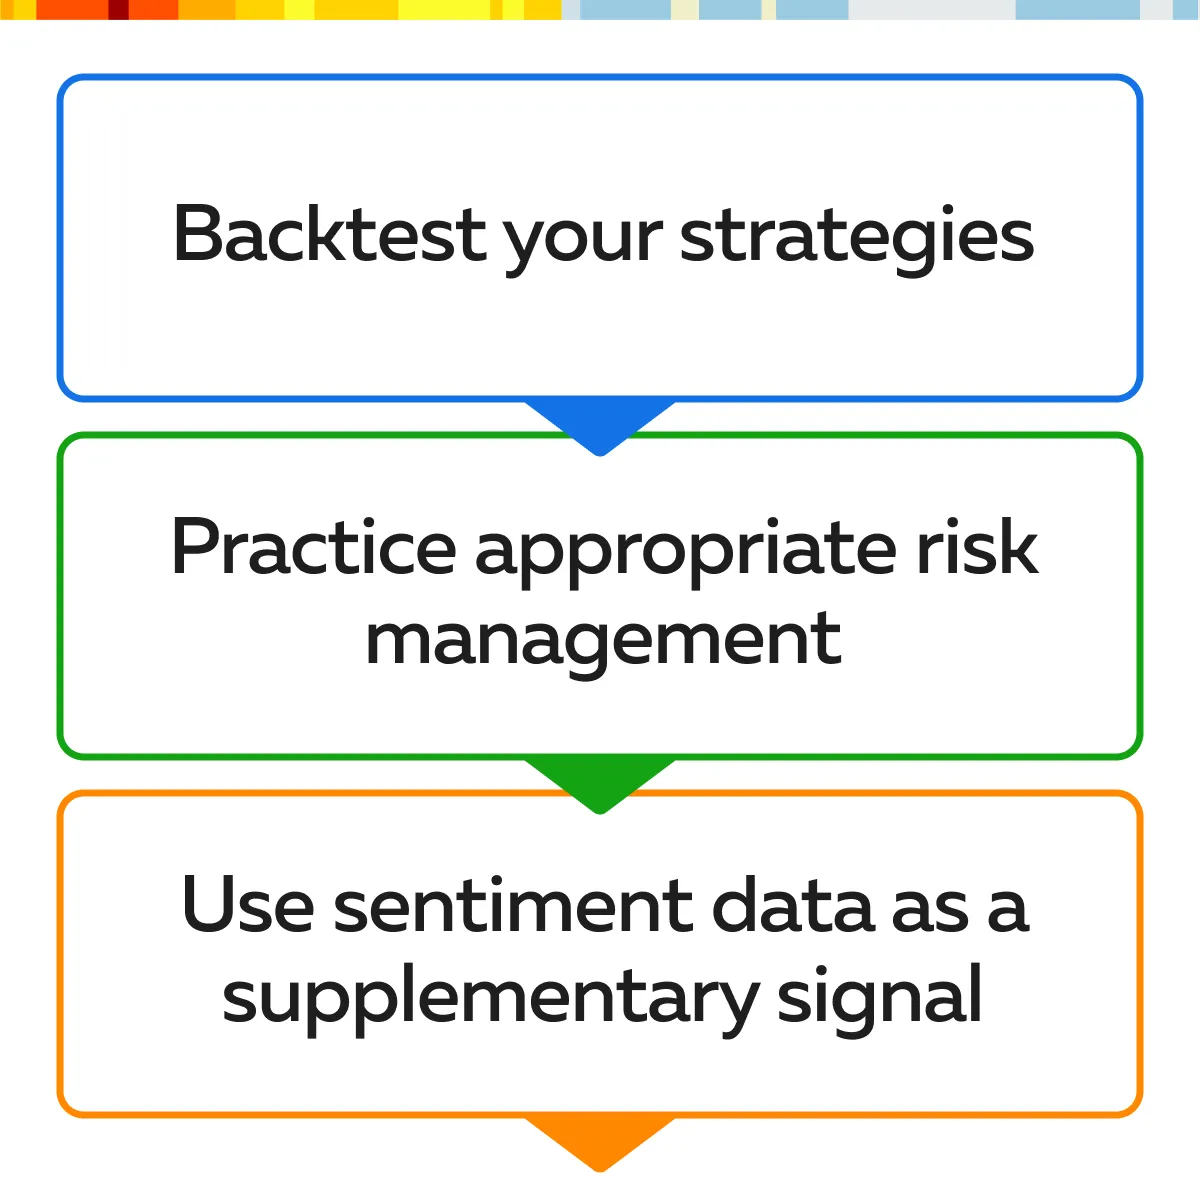
Let’s understand these steps in detail:
1. Backtesting and Strategy Refinement
Backtesting allows traders to test and optimize their strategies using historical data. For 2025, it’s particularly useful to backtest strategies based on 2024’s market conditions. Especially backtest your strategy using periods of:
- High volatility,
or
- Unique market trends.
Through backtesting, you can evaluate and refine entry and exit rules. Also, you can determine perfect stop-loss placements and position sizes. This ensures that your strategies are well-suited to the markets you may encounter in 2025.
Example:
- Let’s say a trend-following trader chooses to backtest a moving average strategy using data from past high-volatility trading days.
- By doing so, the trader identifies how well their strategy performed.
- Next, they make any necessary adjustments to improve its consistency.
Such strategy refinement allows traders to adapt proven methods for 2025. They can trade with more confidence, knowing their tactics are tested and reliable.
2. Risk Management and Portfolio Diversification
Strong risk management is important in volatile markets. Also, through diversification, you can stabilize your portfolio across varying market conditions. In preparation for 2025, you should particularly focus on strategies that manage risk through:
- Well-placed stop-losses,
- Moderate leverage, and
- Diversification across asset classes.
Let’s understand this concept better through an example:
Let’s say a trader balances investment in high-growth sectors like tech with more stable assets such as commodities or bonds. This blend of asset types protects their portfolio if:
- Market sentiment shifts,
or
- Certain sectors experience downturns.
Please note that such a diversified approach is an advanced trading technique. It helps you prepare for a range of market scenarios in 2025.
3. Keeping an Eye on Sentiment Data as a Supplemental Signal

Ideally, you should monitor sentiment data and use it as a supplementary signal to traditional indicators. By doing so, you can get valuable insights into expected market moves. By pairing sentiment data with volume and order flow analysis, you get a comprehensive view of both the:
- The market’s emotional tone,
and
- Real-time trading activity.
Example,
- Let’s say during earnings season, a trader observes a sudden increase in positive sentiment on social media about a specific stock.
- This sentiment is then followed by a rise in institutional buying.
- It is confirmed through volume and order flow indicators.
- This gives traders additional confidence in taking a long position.
In this way, by integrating sentiment data with traditional market analysis for 2025, you can align your strategies with general market sentiment. Also, you can create a well-rounded approach that anticipates both technical and psychological market drivers.
Conclusion
To smartly manage the changing trading environment of 2025, you should master the following market analysis techniques like:
- Order flow,
- Sentiment analysis,
- Volume tracking, and
- Understanding market depth.
These techniques give you information about both real-time market activity and prevailing sentiment. This allows you to make more informed and prompt decisions.
When it comes to order flow analysis, you can identify significant buying or selling actions, providing insights into price direction. Additionally, volume and delta analysis show whether buyers or sellers dominate. Sentiment analysis adds another layer by monitoring the market’s mood, which is especially valuable in hype-driven or news-sensitive markets.
Finally, understanding the market depth and liquidity zones allows traders to enter and exit positions at optimal price points with minimal slippage.
Therefore, for 2025, traders need to concentrate on refining these strategies. This can be achieved through backtesting and effective risk management. By combining these techniques, traders can enhance their ability to predict market moves. They can take advantage of new opportunities, no matter how volatile the market becomes. To build a more resilient and successful trading strategy, you can also start using our advanced market analysis tool, Bookmap. Stay ahead of 2025’s market trends with Bookmap’s real-time insights and analysis tools. Join us now!
Sign Up Now