See earnings more clearly in real time.
Compare plans to access deeper market visibility for earnings.
Education
January 3, 2025
SHARE
How to Read Earnings Reports: A Guide for Traders

Do you think earnings season is just a bunch of numbers and jargon? Think again! It’s like a report card for companies that provides an insider’s view of the stock market’s heartbeat.
Understanding earnings reports, earnings calls, and forward guidance isn’t just a nice-to-have skill for investors and traders. Instead, it’s essential for making smart and well-timed decisions. In this article, we’ll break down the key elements of earnings reports, from interpreting revenue and earnings per share (EPS) to spotting trends in company guidance. Additionally, you’ll learn about crucial ratios such as price-to-earnings (P/E) and price-to-sales (P/S), and how to assess financial stability with debt ratios. To really up your game, we’ll look at how Federal Reserve announcements and economic data shape stock prices and how you can benefit from our advanced market analysis tool, Bookmap, which allows you to track real-time market reactions. Let’s get started!
What is an Earnings Report and Why it Matters?
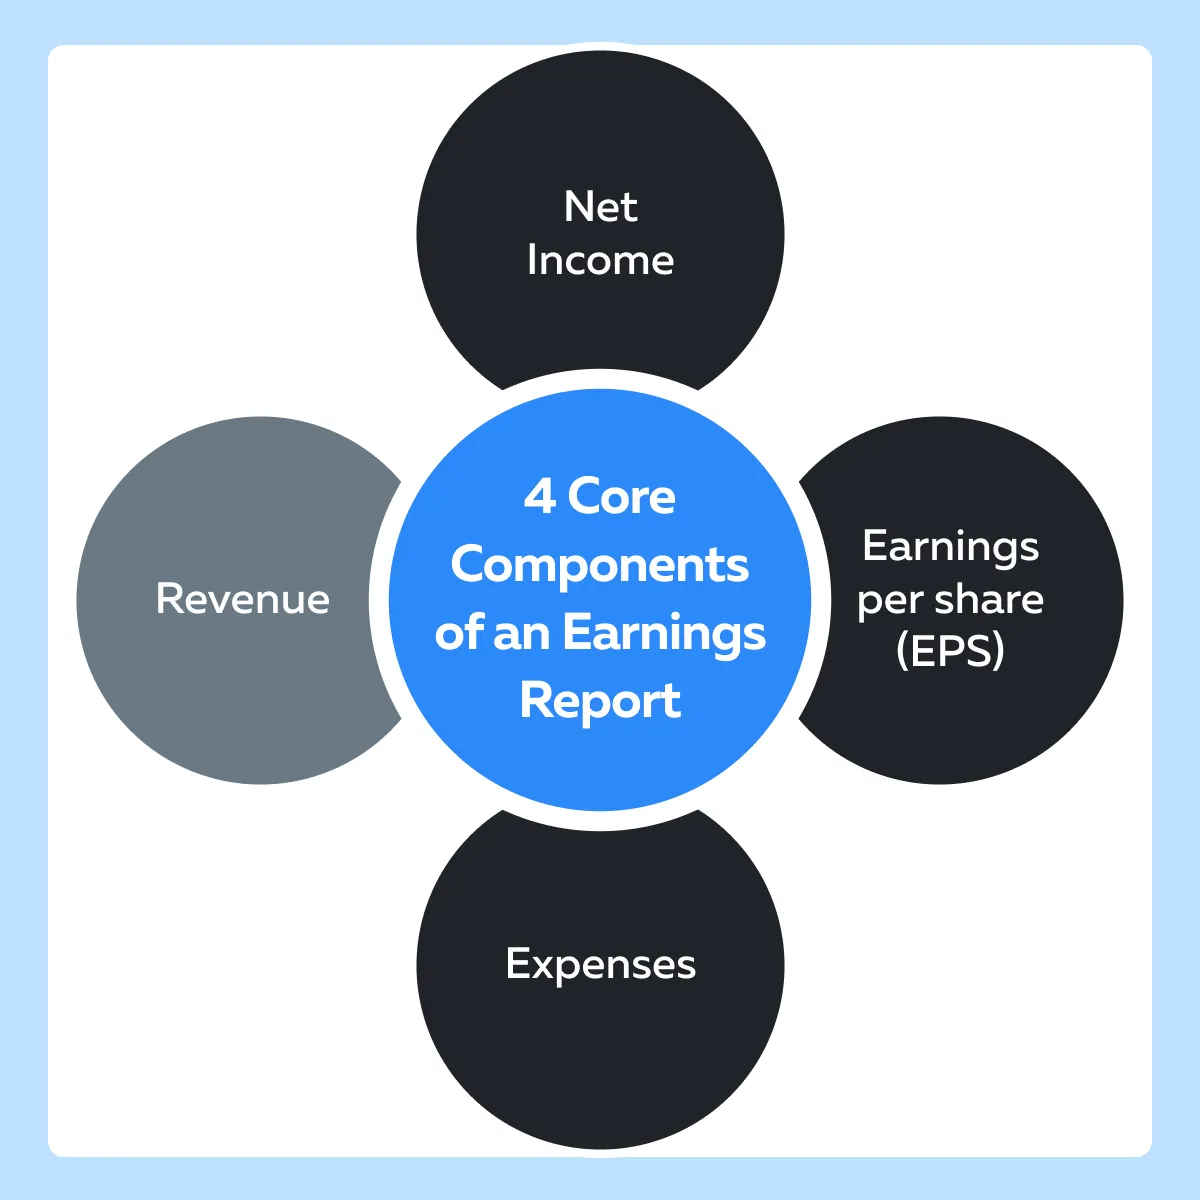
The earnings report is a quarterly financial document. It contains certain metrics that help gauge a company’s financial performance over the past three months. This report includes several core components. Check the four major components of an earnings report in the graphic below:
By carefully reading earnings reports, you can gauge a company’s financial health and the management’s expertise in generating profit. For example,
- Let’s say a company like Apple reports a significant increase in revenue during a given quarter.
- Now, this signals strong consumer demand and operational growth.
- Generally, such a positive result will cause investors to view Apple positively.
- That’s because rising revenue correlates with stronger market positioning.
Use EPS While Analyzing
Be aware that a standout element in any earnings report is earnings per share (EPS). EPS shows a company’s ability to generate profits for each share of stock, making it a key indicator of profitability. Investors often prioritize EPS when reading earnings reports.
EPS is often closely monitored during earnings calls. That’s because it’s a metric that speaks directly to a company’s bottom line and is often compared to analysts’ expectations.
Learn the Difference Between Revenue and Net Income
Both revenue and net income are important when it comes to analyzing a company’s financial standing. Let’s study their basic definitions.
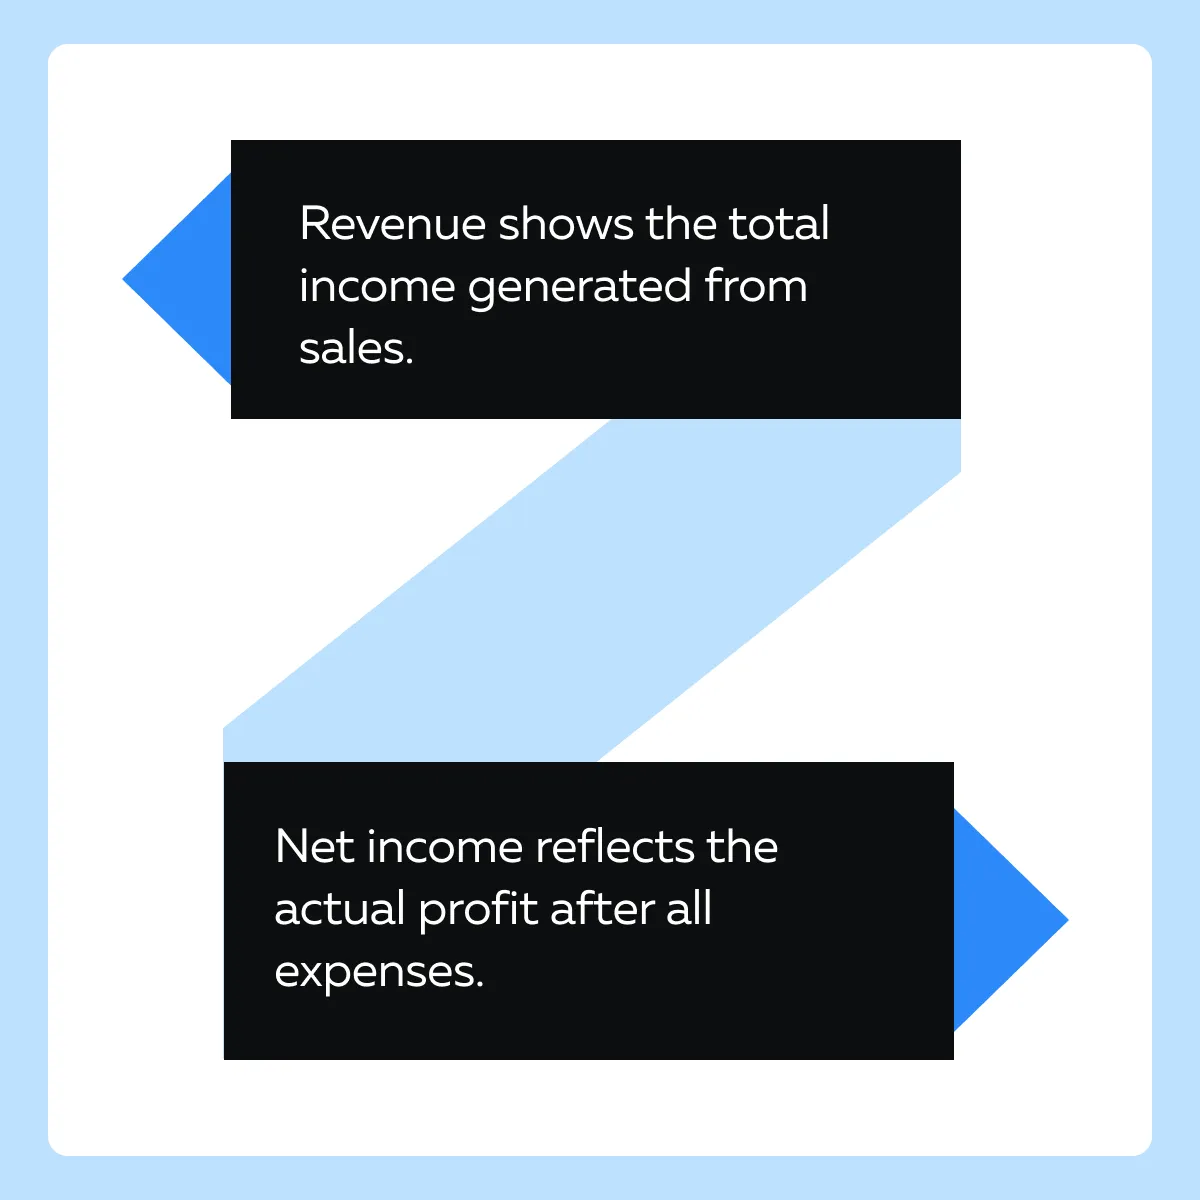
Please note that high revenue growth doesn’t always translate to high net income. This relationship entirely depends on how efficiently the company manages its costs. By interpreting earnings reports with an eye on both revenue and net income, you analyze the company’s operational efficiency.
Making Your Comparison Meaningful
When interpreting earnings reports, you should compare the current quarter’s figures with those from previous quarters along with analyst’s expectations. This context reveals whether the company is on an:
- Upward trend,
- Stagnating,
or
- Declining.
Meeting or exceeding expectations results in stock price gains. In contrast, missing expectations indicate challenges. By understanding these comparisons, you can make a careful analysis and get a complete perspective on a company’s stock fundamentals and growth potential.
Breaking Down the Key Elements of an Earnings Report
When analyzing earnings reports, most investors look at certain specific metrics. Each metric of an earnings report offers unique insights, allowing for a comprehensive view of a company’s financial performance. Let’s learn about them in detail.
a) Revenue
Revenue is the total income generated from a company’s core operations. It is usually earned through the sale of products or services. An increasing revenue growth signals a rise in demand or successful expansion into new markets. For example,
- Let’s say a tech company reports increased revenue.
- This occurred because the company launched a popular new product.
- Also, it entered a high-growth market.
- Now, this revenue growth can increase a company’s stock price.
- That’s because investors gain confidence in the company’s momentum and market share.
b) Net Income and Profit Margins
Net income (alternatively known as net profit) is the company’s actual profit after all expenses. Some common expenses deducted to obtain net profit are:
- Operational costs,
- Taxes,
and
- Interest.
By analyzing net income, you can easily evaluate a company’s profitability and overall efficiency. Furthermore, you can even analyze profit margins. Profit margins are calculated by dividing net income by revenue. They reveal how well a company manages its expenses. High-profit margins mostly show efficient cost management.
For example, tech companies often have higher profit margins compared to retail businesses, which face higher operational costs. This difference influences how investors:
- Interpret earnings reports,
- Assess the stability of a company’s profits relative to its industry,
and
- Predict sectoral growth
Take your analysis to the next level with Bookmap’s order flow tools, perfect for reacting to earnings and economic data releases.
c) Earnings Per Share (EPS)
Earnings per share (EPS) represent the fraction of a company’s profit assigned to each outstanding share. It helps to assess earnings growth. By analyzing it, you can evaluate the profitability of a company on a per-share basis. Now, please note that if EPS grows consistently, it indicates that a company is:
- Strategically managing its resources,
and
- Likely to continue rewarding shareholders.
Thus, EPS is frequently discussed in earnings calls. In these calls, companies even compare their reported EPS to analysts’ expectations. Such a comparison impacts the stock price based on whether the EPS meets, exceeds, or falls short of these projections.
d) Forward Guidance
Forward guidance is the company’s projection of its future financial performance. It is generally based on anticipated:
- Revenue,
- Expenses,
and
- Market conditions.
It shows management’s expectations and strategies. By analyzing it, you get information about a company’s future direction. Let’s see how:
Therefore, during earnings calls, forward guidance is a primary topic of interest. It offers a forward-looking view of the company’s growth plans and likely challenges. Also, it influences stock performance as analysts and investors adjust their projections accordingly.
e) Free Cash Flow (FCF)
Free Cash Flow (FCF) is the cash a company has left after covering its:
- Operating expenses,
and
- Capital expenditures.
FCF is an indicator of financial flexibility. It reveals how much money is available for reinvestment in the business or distribution to shareholders through dividends or buybacks. Mostly, a high FCF shows that a company has sufficient resources to:
- Invest in growth opportunities,
or
- Reward its investors.
This makes it an attractive factor when interpreting earnings reports and assessing stock fundamentals.
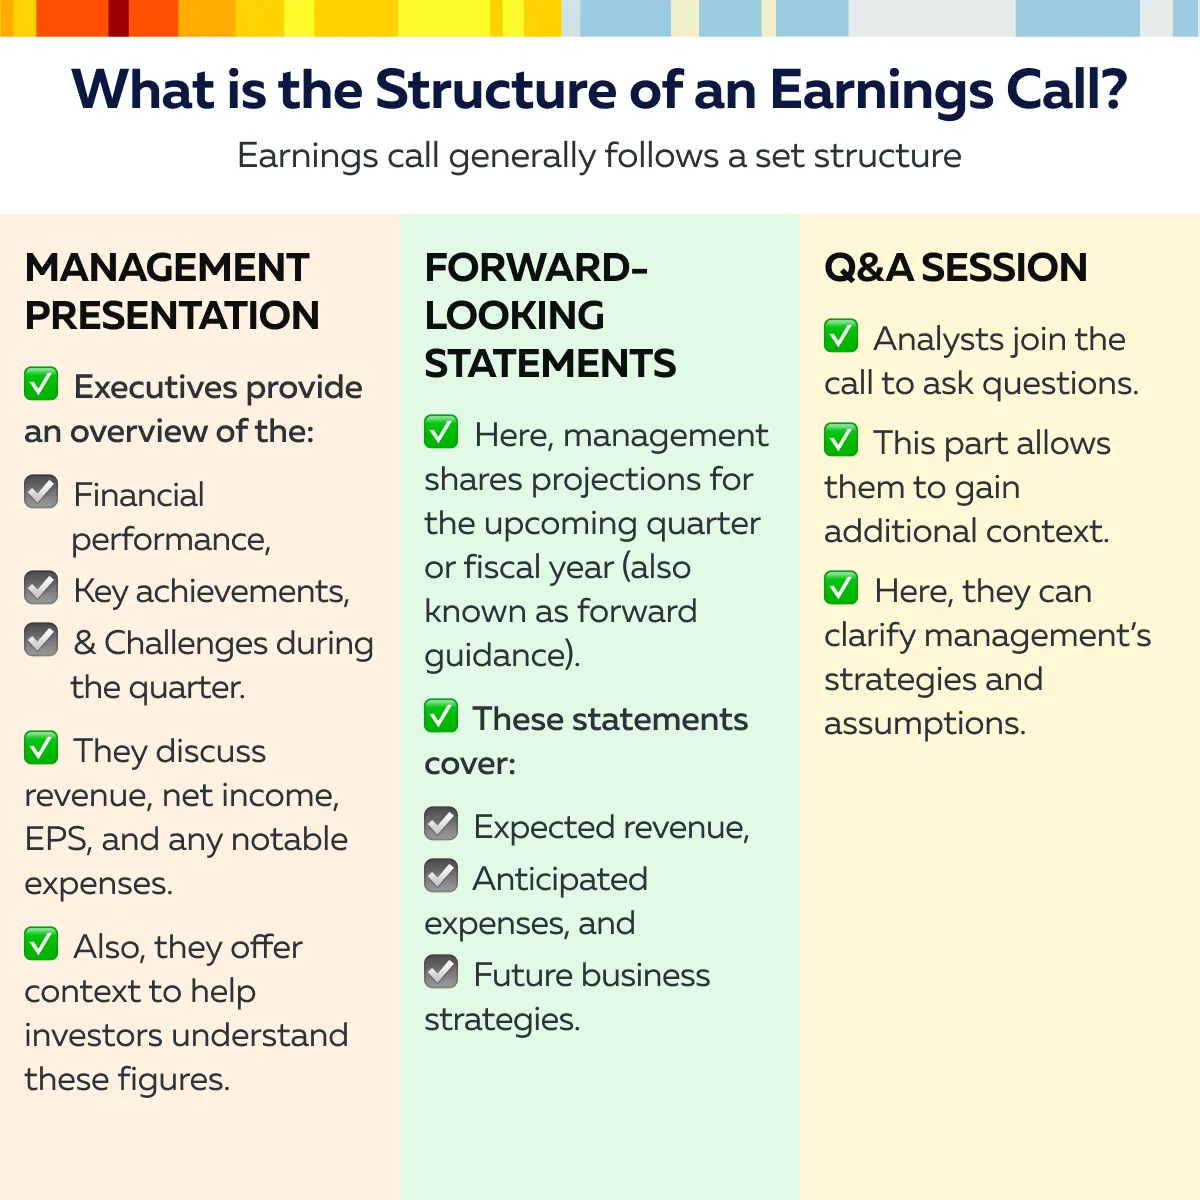
Interpreting Earnings Calls and Management Guidance
Earnings calls analyze a company’s quarterly performance. In these calls, the management presents the latest financial results along with forward guidance. To effectively analyze these earnings calls, you must learn how to read between the lines. That’s because the tone and content of the discussion can signal more than just raw numbers. Let’s understand these aspects in detail.
How to Use Tone and Language as Indicators?
The tone and language used by executives during an earnings call provide subtle but valuable insights. Let’s see how.

When interpreting earnings calls, you should pick up on these cues. They help you to gauge management’s confidence or potential concerns.
Example:
- Let’s assume the CEO maintains a cautious tone.
- This indicates market pressures or upcoming hurdles.
- Even though the financial results may look positive, you may take this as a sign to approach the stock with caution.
Some Key Metrics Discussed During Earnings Calls
Beyond EPS and revenue, some other relevant metrics often discussed during earnings calls are:
| Gross Margins | CAPEX (Capital Expenditure) | Growth Projections |
|
|
|
By analyzing these metrics in conjunction with the financial statements in the earnings report, you can gauge a company’s financial health.
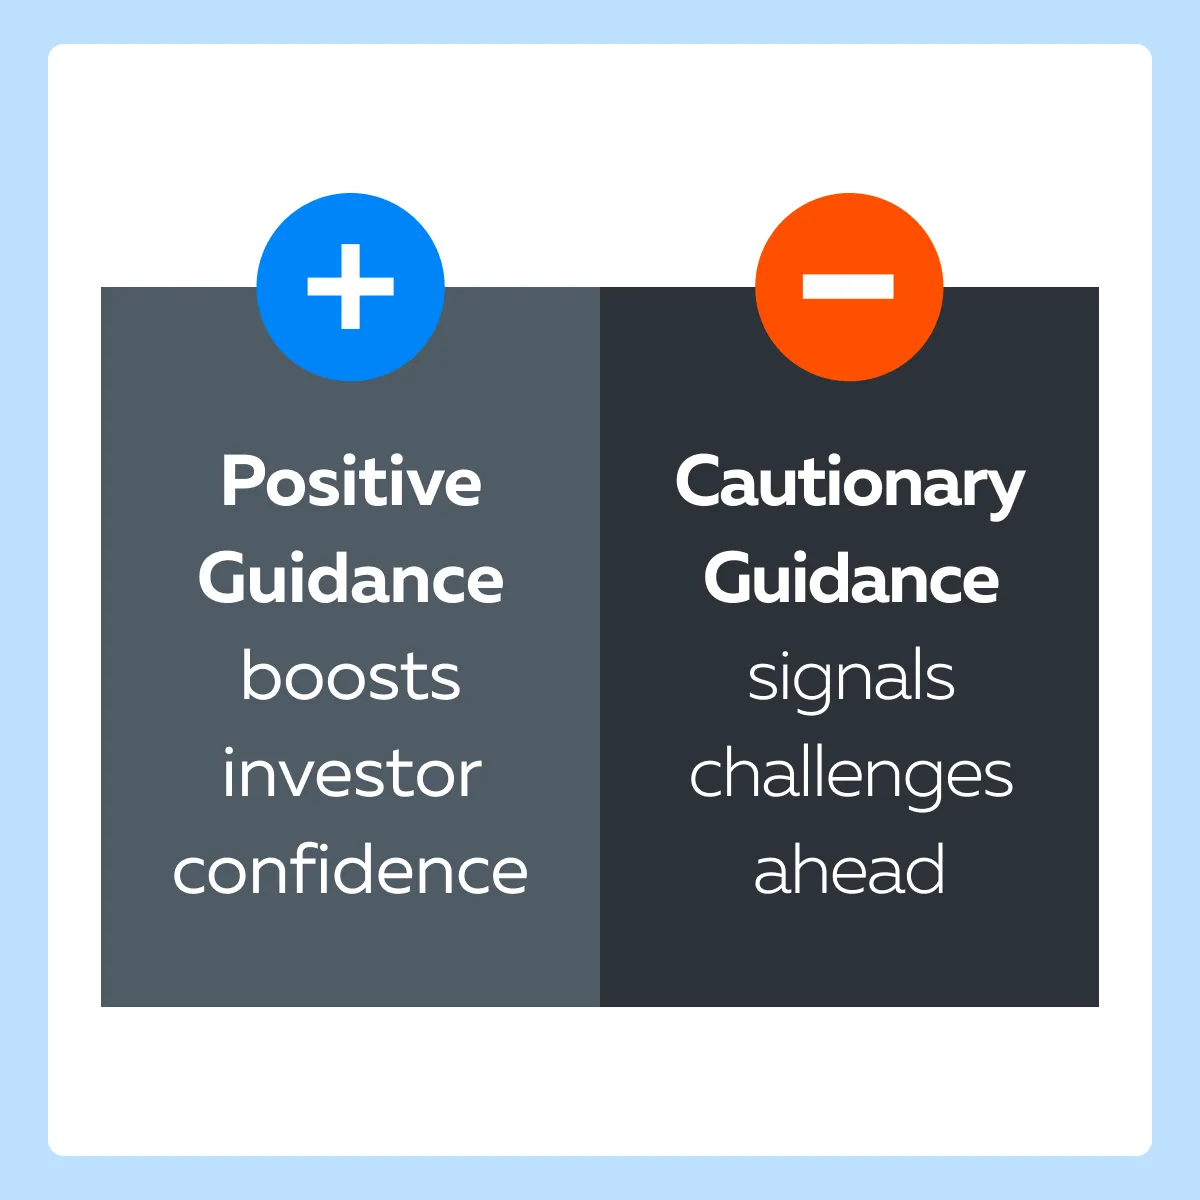
How to Interpret Forward Guidance and Check Its Impact on Stock Price?
Forward guidance provides a preview of expected performance. It covers revenue targets, likely challenges, and market conditions. As an investor, an analysis of forward guidance helps one predict future cash flows and overall valuation.
Also, positive guidance amid competitive pressure boosts investor confidence. That’s because it implies that the company has strategies in place to better deal with challenges.
Example:
- Let’s say a tech company issues a strong forecast.
- Despite facing a competitive market, investors view this positively.
- This increases the company’s stock price.
Similarly, if forward guidance falls short of expectations, it indicates market difficulties. These weigh on investor sentiment and lead to a fall in share value.
Key Ratios and Metrics to Look For
When analyzing earnings reports and stock fundamentals, you should always check several key ratios. They help you to understand a company’s:
- Valuation,
- Growth potential,
and
- Financial stability.
Check the graphic below to learn what ratios you must consider.
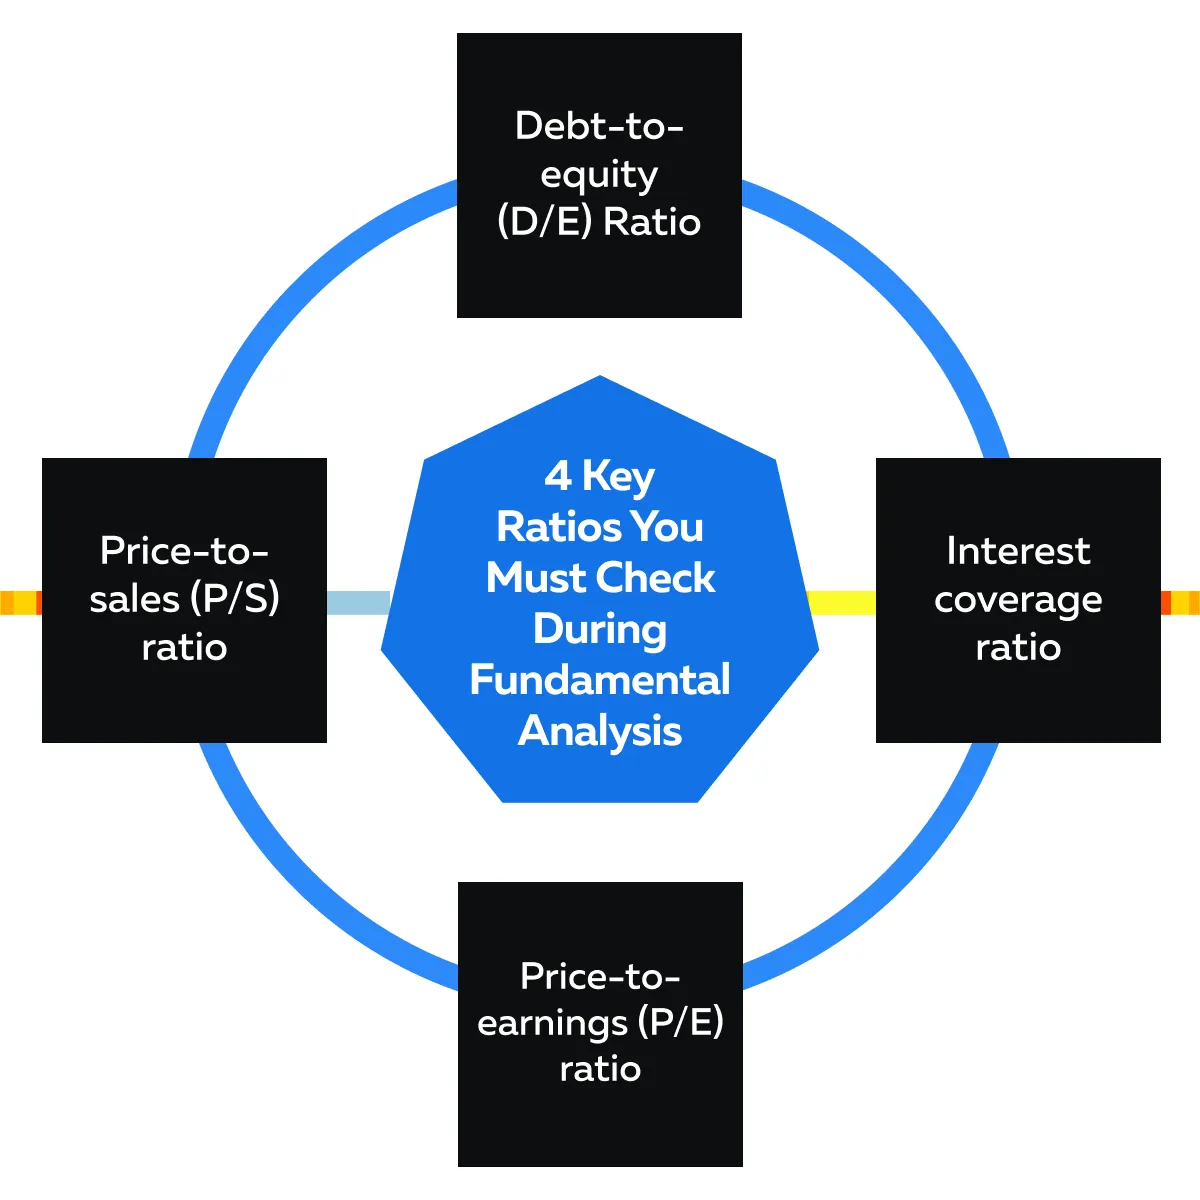
Be aware that each ratio offers unique insights. They allow investors to interpret the financial data in earnings reports more deeply. Let’s understand each of these ratios in detail.
A) Price-to-Earnings (P/E) Ratio
The price-to-earnings (P/E) ratio is a popular metric in stock analysis. It is calculated by dividing a company’s current stock price by its earnings per share (EPS). Mathematically, we can represent it as follows:
P/E Ratio= Current Market PriceEPS
By analyzing the P/E ratio, one can determine if a stock is overvalued or undervalued. It represents how much investors are willing to pay for each dollar of earnings.
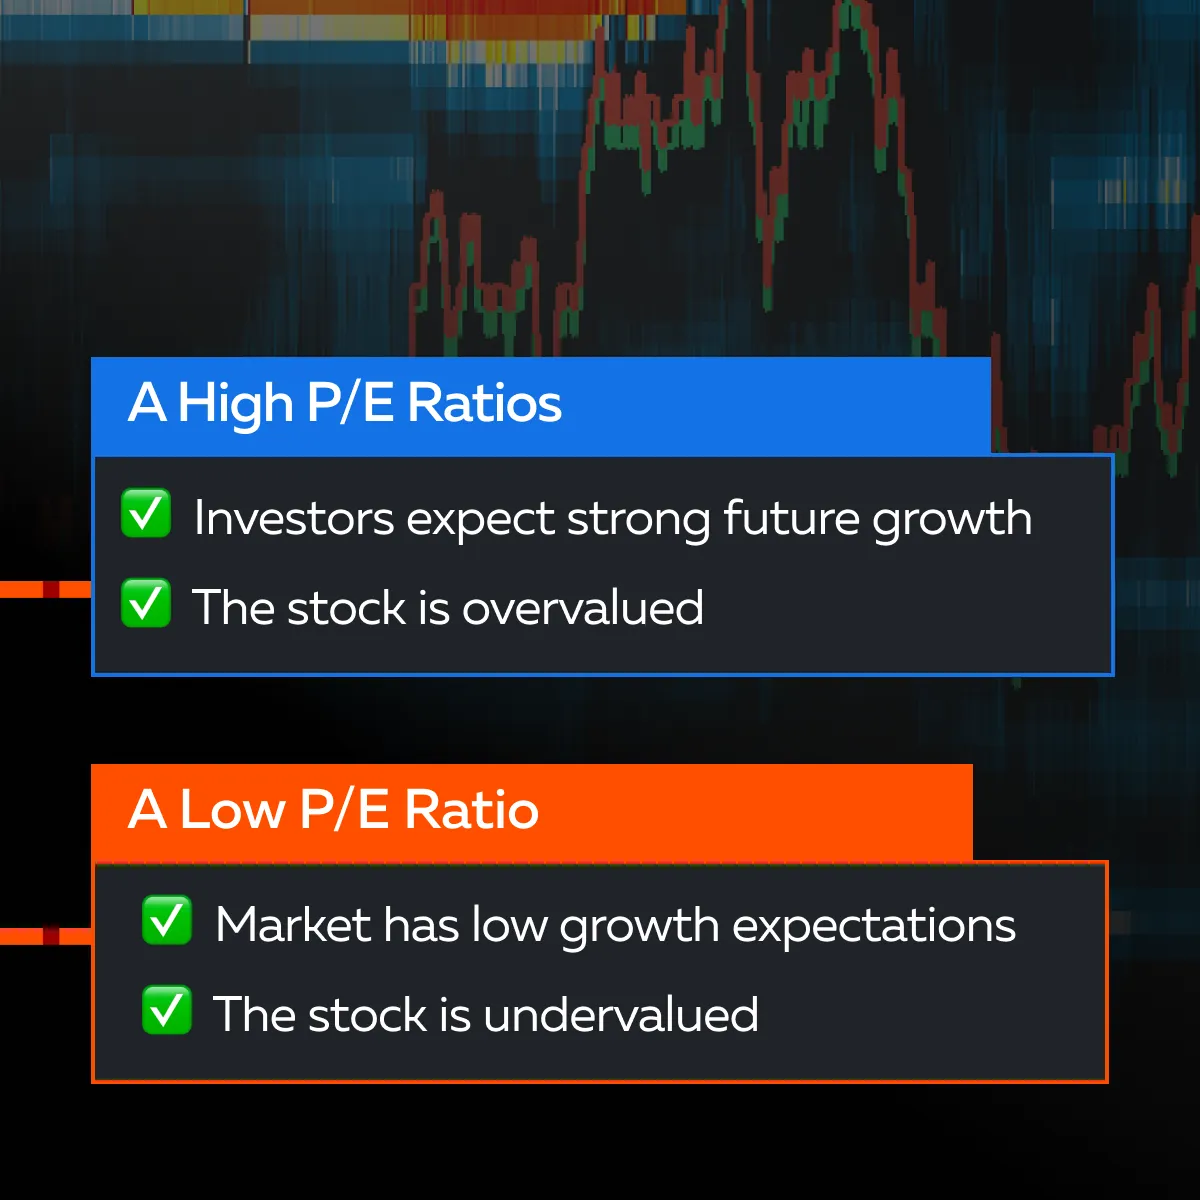
In this manner, by comparing a company’s P/E ratio with its industry peers or historical P/E, you can better gauge its valuation relative to earnings.
B) Price-to-Sales (P/S) Ratio
The price-to-sales (P/S) ratio is calculated by dividing a company’s stock price by its total revenue per share. Mathematically, we can represent it as follows:
P/S Ratio= Current Market PriceTotal Revenue Per Share
This ratio is particularly useful for assessing:
- Growth stocks,
or
- Companies with lower or negative earnings.
That’s because, in such companies, traditional P/E analysis is not as effective. The P/S ratio represents the amount investors are willing to pay for each dollar of sales. By analyzing it, you can get to know about the market expectations for the company’s revenue potential.
For growth stocks, a high P/S ratio reflects strong revenue growth prospects, even if current earnings are low or negative. Next, please note that in sectors where profitability can take time to materialize (such as tech startups), the P/S ratio offers a clearer view of market sentiment and growth expectations.
C) Debt Ratios
Debt ratios are important indicators of a company’s financial stability. We can divide them into two major parts:
| Part I: Debt-to-Equity (D/E) Ratio | Part II: Interest Coverage Ratio |
|
|
Applying These Principles to Economic Data and the FOMC
To deeply understand the fundamentals of a stock, you must learn about the impact of:
- Macroeconomic data,
and
- Federal Reserve announcements.
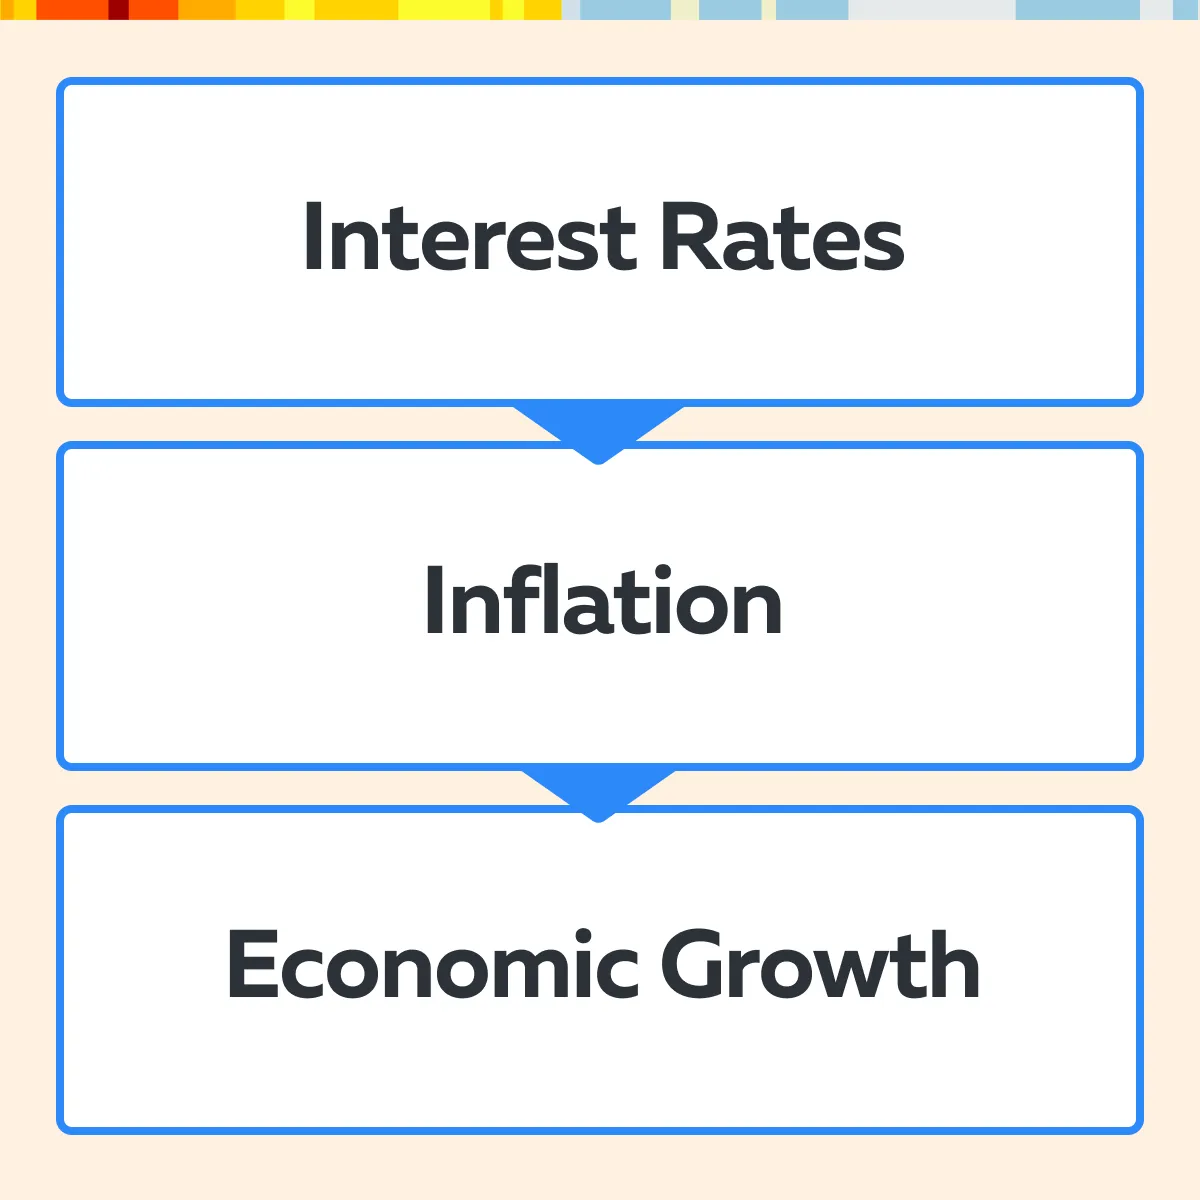
These elements shape market sentiment and stock valuations significantly. The Federal Open Market Committee (FOMC), the body responsible for monetary policy in the U.S., plays an important role in defining economic expectations, especially regarding interest rates and inflation. Let’s understand in detail:
Impact of Federal Reserve Announcements and Macroeconomic Data
The Federal Reserve’s announcements affect market sentiment and, in turn, stock valuations. Let’s see in what regards these announcements are made:
Example:
- Let’s say the Fed signals an interest rate increase.
- They generally do so to curb inflation.
- But this also makes borrowing more expensive.
- This influences company earnings.
- Also, this change impacts sectors differently.
- Therefore, in earnings calls, executives often discuss these economic factors.
- In the forward guidance, they tell how they might influence future performance.
It is for this reason that traders closely monitor FOMC meetings. Mostly, the Fed’s economic outlook and policy decisions set the tone for the economy. Market responses to these announcements result in shifts in stock prices. Be aware that the growth-oriented and rate-sensitive sectors react most notably.
Key Economic Indicators You Must Watch
Several macroeconomic indicators have a direct impact on earnings and, by extension, stock prices. Let’s check them out:
| GDP Growth | Unemployment Rates | Inflation Data |
|
and
|
or
|
It is worth mentioning that these indicators provide an important context for analyzing earnings reports. That’s because they influence both consumer behavior and corporate cost structures.
Impact of Interest Rate Changes on Key Sectors

Interest rate changes significantly impact certain sectors. This is why FOMC guidance on future rate hikes or cuts is closely monitored. Let’s see how it affects certain key sectors.
- Financials
-
-
- Financial stocks (banks and insurance companies) benefit from higher interest rates.
- This happens because banks can charge more for loans, which boosts their net interest income.
- As an investor, if you are analyzing earnings calls for banks, always look for updates on interest income projections in response to the Fed’s decisions.
-
- Technology
-
-
- Tech stocks are generally sensitive to interest rate hikes.
- That’s because they rely heavily on future growth.
- Higher rates increase borrowing costs, which reduces investment in growth initiatives.
- Please note that earnings reports for tech companies reflect a focus on cash flow and debt management as rates rise.
-
- Real Estate
-
-
- The real estate sector is also quite vulnerable to interest rate changes.
- That’s because higher interest rates make mortgages more expensive.
-
- Such a situation reduces demand for property purchases.
-
- Real estate investment trusts (REITs) and property developers also see lower valuations as higher rates discourage borrowing for new projects.
Track major market reactions to earnings announcements with Bookmap’s advanced visualization and liquidity tracking tools.
Strategies for Trading Around Earnings Announcements
Trading around earnings announcements offers opportunities for profit. But it also involves significant risk. Thus, to better manage these events you should develop a strategy that includes pre- and post-earnings positioning and robust risk management. Let’s see how:
How to Do Pre-Earnings Positioning?
To position before an earnings report, you should analyze:
- Historical trends,
- Earnings calls,
and
- Analyst expectations.
For a better analysis, most traders use our advanced market analysis tool, Bookmap. Using it, you can easily monitor order flow and liquidity. This helps you to reveal market sentiment as the earnings release approaches. Moreover, by studying buying and selling patterns, you can easily assess whether institutional investors or large players are positioned ahead of the report.
- Example: Let’s assume traders are expecting a strong earnings report based on:
- Historical data,
or
- Positive guidance.
- Now, they enter a position in anticipation of a stock price increase.
However, be aware that this strategy requires careful timing. You must understand the fundamentals of a stock completely to avoid overpaying for a position based on pre-earnings hype.
How to Benefit from Post-Earnings Reaction

The post-earnings period offers several profitable opportunities. These changes arise based on market reaction to the new information. After the earnings report is released, you can use Bookmap’s real-time data and track:
- Immediate market reactions,
and
- Shifts in liquidity.
Furthermore, by observing order flow and price levels, you can gauge sentiment. Also, you can capitalize on unexpected moves, such as:
- A price increase following a positive report
or
- A decline if the report falls short of expectations.
For example, say a company reports lower-than-expected EPS. The traders see high selling pressure. So, they consider short-selling strategies. Conversely, if the report exceeds expectations and is accompanied by positive forward guidance, traders might enter or increase their long positions.
How to Manage Risk
Earnings announcements are notoriously volatile. Thus, you must set stop losses or position limits. This helps you to reduce the chance of suffering losses due to unexpected earnings surprises. As a practice, for stocks that are prone to sharp swings, most traders:
or
- Set tighter stop losses to protect their capital.
For example, in high-volatility stocks or growth sectors, traders opt for smaller positions or diversify their exposure. This approach limits the risk associated with a single company’s earnings report.
Key Takeaways for Reading Earnings Reports
By reading earnings reports and analyzing market reactions, you can get a deeper understanding of both company-specific and sector-wide performance. Additionally, when you combine real-time data tools (like our Bookmap) with traditional fundamental analysis, you can develop a strong approach to earnings season. Let’s understand how you may go about doing that in detail.
How to Use Bookmap’s Real-Time Data Alongside Fundamental Analysis

Bookmap reveals market sentiment and liquidity shifts as earnings reports are released. Its order flow analysis shows where buying and selling pressure is concentrated. This helps you to make more informed decisions based on immediate market reactions.
Example:
- Let’s assume an earnings report beats analysts’ expectations.
- Thus, Bookmap shows strong buying interest.
- It confirms an upward trend that aligns with the positive fundamentals.
- Now, you can enter a long position and earn significant profits when the share price increases.
How to Compare Earnings Trends Across Sectors?
By comparing earnings trends across sectors, you can identify broader economic patterns. These impact stock fundamentals on a larger scale. For example, if several companies within the tech sector miss earnings targets, it indicates challenges such as:
- Rising costs,
- Competitive pressures,
and
- Economic factors affecting that industry.
On the other hand, consistent earnings growth across sectors suggests a stronger economic environment. It supports a more optimistic market sentiment.
Conclusion
By understanding earnings reports, earnings calls, and forward guidance, you can make informed investment decisions. These tools provide insights into a company’s:
- Financial health,
- Growth potential,
and
- Management’s future outlook.
All of these are key to assessing stock fundamentals. Furthermore, by examining metrics like revenue, earnings per share (EPS), and profit margins, you can determine how well a company is performing and how it compares to industry expectations. Listening to earnings calls offers additional context. It reveals management’s confidence or concerns about upcoming challenges.
Additionally, you should use real-time data tools like our Bookmap, which offers order flow and liquidity analysis. Using it, you can easily check how the market reacts to earnings announcements and economic data in real-time.
Please note that this capability allows you to quickly respond to changing market conditions. Also, you can smartly capitalize on shifts in sentiment following an earnings release. Want to analyze earnings reports with confidence? Bookmap’s data tools offer real-time insights to help you trade more strategically.
Sign Up Now