See spy qqq more clearly in real time.
Compare plans to access deeper market visibility for spy qqq.
Stocks
January 27, 2026
Updated
SHARE
SPY vs. QQQ: Why Traders Watch Them Closely and How to Analyze Their Market Signals
Table of Contents
- What is SPY Stock?
- What is QQQ?
- Why Do Traders Watch SPY and QQQ Together?
- Analyzing SPY and QQQ for Better Trading Decisions
- Impact of Economic Indicators on SPY and QQQ
- Volatility in SPY and QQQ
- Invesco QQQ vs SPDR S&P 500 ETF Performance Comparison
- QQQ vs SPY Portfolio Construction and Risk
- Practical Uses for Traders and Investors
- FAQ
In financial markets, investing without a plan is like hitting in the dark. To make profitable trades, you will certainly need the guidance and information that others have. But how and what is the source?
Ever heard of SPY and QQQ as market indicators?
Yes, these are two essential guides for those looking to make sense of the U.S. market. SPY tracks the S&P 500 and provides a broad view of the market across various sectors. The other guide, QQQ, zeroes in on the tech-heavy stocks that often lead the charge.
This article explores the importance of both SPY and QQQ in understanding market sentiment. You’ll learn how they complement each other and give insights into market trends and sector performance. Also, we will check how macroeconomic events and earnings seasons impact these ETFs differently. Additionally, we’ll discuss the benefits of monitoring volatility and the risks associated with tech stocks. Let’s get started.
Invesco QQQ vs SPDR S&P 500 ETF performance comparison graph
When traders compare QQQ and SPY, they are usually evaluating two different styles of market exposure rather than simply choosing between two ETFs. SPY represents the broader U.S. market through the S&P 500, while QQQ is more concentrated in large-cap growth and technology-heavy names.
A performance comparison graph is useful because it immediately shows:
- when tech leadership is driving the market
- when broad diversification is outperforming concentrated growth
- how market cycles affect each ETF differently
This comparison becomes especially important during periods of sector rotation, interest rate changes, and earnings-driven volatility.
Nasdaq-100 tracker vs S&P 500 tracker historical price visualization
A historical price visualization of QQQ versus SPY helps traders see when leadership shifts between technology-heavy growth stocks and the broader market. In strong growth environments, QQQ often outperforms because of its heavier weight in major technology and communication names. In more defensive or rate-sensitive environments, SPY may hold up better due to its wider exposure across sectors such as healthcare, financials, industrials, and energy.
This type of chart is especially useful when evaluating:
- long-term trend leadership
- relative drawdowns during corrections
- how sector concentration changes performance over time
Technical analysis chart comparing QQQ and SPY market trends
A technical comparison between QQQ and SPY is often used to assess whether market strength is broad or narrow. If both are trending higher together, that usually confirms a healthier risk-on environment. If QQQ is rising much faster than SPY, leadership may be concentrated in technology and growth stocks. If SPY is more stable while QQQ weakens, that can suggest a rotation away from higher-beta names.
Traders often compare:
- moving average structure
- breakout and pullback behavior
- relative momentum
- trend persistence after earnings or macro events
Relative strength overlay of SPY and QQQ for the last five years
A relative strength overlay shows whether QQQ has been outperforming or underperforming SPY over a rolling period. Over the last five years, this kind of overlay has often reflected the market’s dependence on large-cap technology leadership, especially during AI-driven rallies and low-rate growth environments.
For a real-world example of a trader integrating technology-driven workflow decisions into market analysis, check this out:
https://bookmap.com/blog/from-a-successful-career-in-tech-to-trading-full-time-with-bookmap-a-silicon-valley-traders-catalyst-after-combining-his-workflow-into-a-single-tool
Relative strength matters because it helps traders identify whether leadership is broadening or narrowing, which can significantly influence both swing trades and longer-term positioning.
Comparative price plot of the two largest US exchange-traded funds
A comparative price plot of SPY and QQQ is useful because these two ETFs are among the most watched instruments for broad market and growth-stock sentiment. While both often move in the same general direction, the distance between their performance can reveal a great deal about risk appetite, sector leadership, and macro sensitivity.
This helps answer practical questions such as:
- Is the market being led by a handful of growth names?
- Is broad market participation supporting the move?
- Is diversification reducing volatility without fully sacrificing upside?
What is SPY Stock?
SPY stock refers to the SPDR S&P 500 ETF Trust. It is one of the most popular exchange-traded funds (ETFs) globally. This ETF offers exposure to the S&P 500 Index. For the unfamiliar, the S&P 500 index includes 500 of the biggest companies traded on stock exchanges in the United States. This makes SPY stock an easy way to invest in the broader U.S. stock market without buying individual stocks of each company.
Investors must note that SPY is an ETF. This means it is designed to mirror the performance of the S&P 500 index. When you invest in SPY stock, you essentially invest in all the companies within the S&P 500. This provides diversification, as your investment is spread across different industries. Importantly, your risk of individual stock fluctuations gets reduced. For more clarity, let’s understand this process in simple steps:
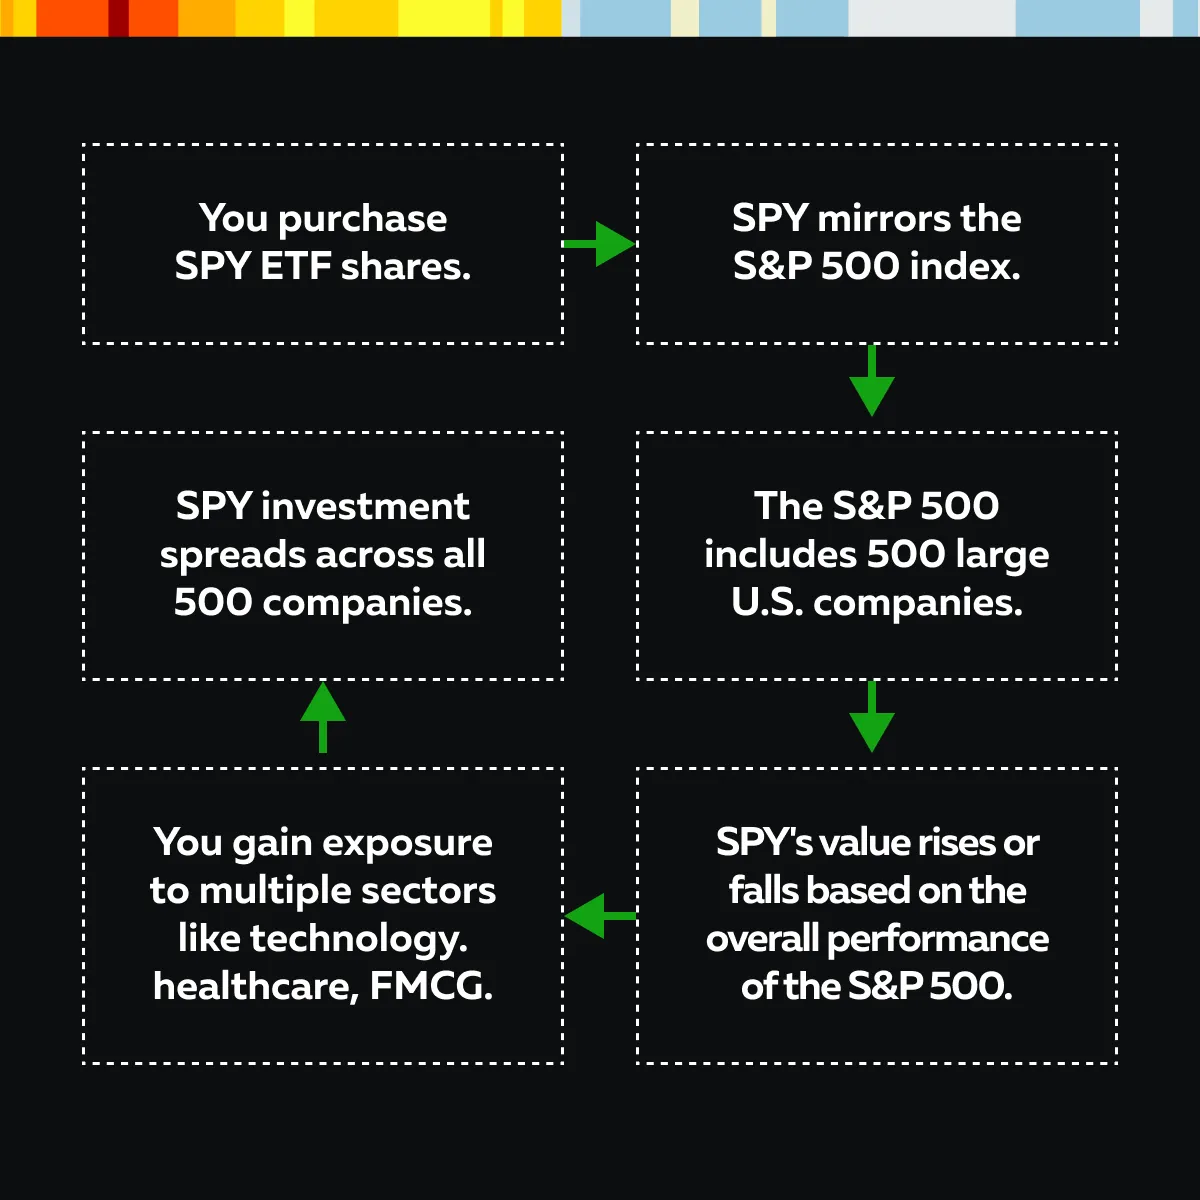
It is worth mentioning that ETFs such as SPY are traded on stock exchanges in the same way as regular stocks. This makes them easy to buy and sell during market hours. This flexibility, combined with the benefits of diversification and relatively low cost, makes SPY a popular investment choice.
What is QQQ?
QQQ, or the Invesco QQQ Trust, is also an exchange-traded fund (ETF). It tracks the Nasdaq 100 index. This index consists of 100 of the largest non-financial companies listed on the Nasdaq stock exchange. It must be noted that the primary focus of this index is on tech-heavy and growth-oriented companies. This makes it a popular ETF for investors seeking exposure to major technology firms.
The major concentration of QQQ is on technology stocks, such as Apple, Amazon, and Microsoft. However, this strong focus on tech makes QQQ more volatile than broad-market ETFs like SPY but also offers higher growth potential. Investors in QQQ should be aware that it responds sharply to developments in the tech sector, like earnings reports or innovations.
Additionally, since QQQ is heavily tech-focused, it also reacts quickly to economic and tech-related news. This makes it particularly appealing for swing traders who try to capitalize on short-term market movements. They are most active, particularly around big tech earnings seasons when companies like Apple or Amazon release their quarterly reports.
Why Do Traders Watch SPY and QQQ Together?
Most traders prefer to closely watch both SPY and QQQ because these ETFs give different perspectives on market sentiment. They help them understand how different parts of the U.S. stock market are performing. Let’s see how:
| SPY Gives Broader Market Sentiment | QQQ is Tech-Heavy and Growth-Oriented |
|
|
How to Monitor Both for Comprehensive Market View?
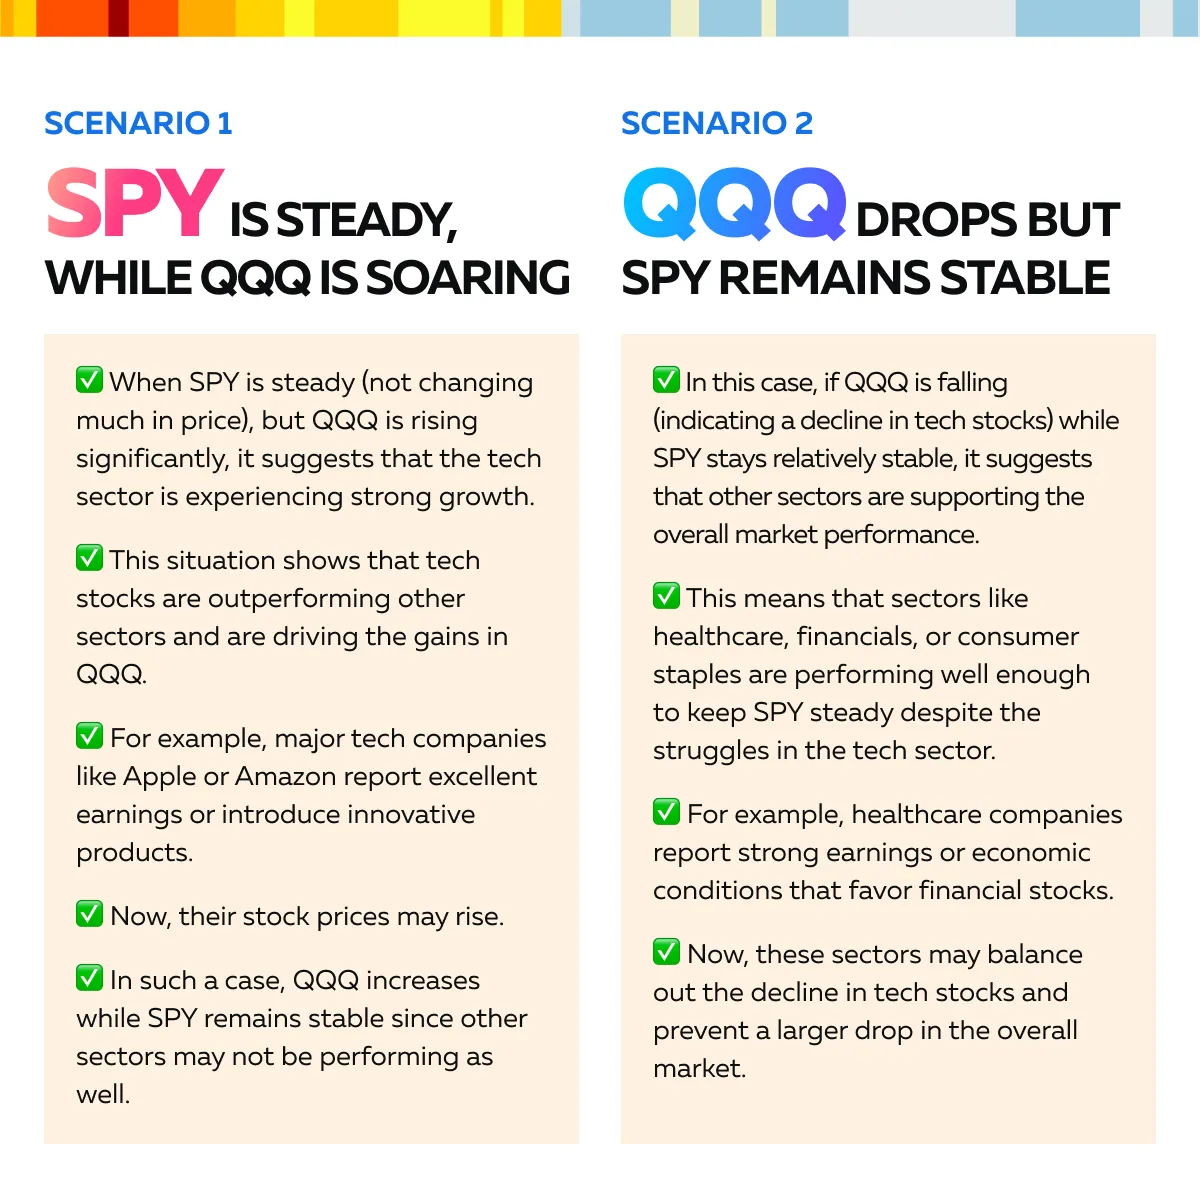
By watching both SPY and QQQ, traders get a fuller picture of the market. SPY gives them an understanding of the overall market across multiple industries, while QQQ shows the performance of tech-focused and growth stocks. For more clarity, let’s study two different scenarios:
Moreover, SPY reflects traditional sectors like industrials and financials, while QQQ is more tech-focused. Traders analyze these two to understand “sector rotation”, which shows where money moves between sectors depending on economic conditions. By comparing SPY and QQQ, traders can also gain insights into which sectors are currently strong or weak.
Correlation and Divergence between SPY and QQQ
SPY and QQQ are often correlated. That’s because they both represent parts of the U.S. stock market. When the overall market trend moves upward, both SPY and QQQ usually rise. However, their correlation can change based on the performance of specific sectors, particularly technology.
This relationship between SPY and QQQ shows how different sectors can influence market performance. Let’s see how this works under two different situations:
Situation 1: Tech Stocks Outperform
- In periods when tech stocks are performing exceptionally well (for example, during a tech boom or after strong earnings reports from major tech companies), QQQ can rise faster than SPY.
- This is because QQQ is heavily weighted in technology stocks, so its price reacts more significantly to gains in this sector.
- However, this outperformance comes with increased volatility and risk.
- Tech stocks are usually sensitive to changes in:
- Market sentiment,
- Economic conditions, and
- Therefore, while QQQ offers higher returns during a tech rally, it also risks sharper declines if the tech sector faces negative news or market corrections.
Situation II: Tech Sector Underperforms
- Now, let’s consider a reverse situation.
- The tech sector encounters difficulties due to disappointing earnings, regulatory challenges, or rising interest rates.
- Here, QQQ will decline more sharply.
- On the other hand, SPY will remain more stable due to its diversified nature.
Bonus Tip: From Situation II, we can see that SPY may serve as a safer investment option for investors looking to mitigate risk. That’s because it provides more consistent returns through its broader diversification across different industries.
Stay ahead of market shifts with the order flow and liquidity tools on our trading platform, Bookmap, which is perfect for monitoring ETFs like SPY and QQQ.
QQQ vs SPY portfolio construction and risk
Although SPY and QQQ are often used as market indicators, they also represent very different portfolio construction choices. SPY offers broad market exposure, which generally leads to lower concentration risk. QQQ provides more targeted exposure to growth-oriented companies, which can increase both upside potential and sensitivity to market shocks.
A trader or investor comparing the two should think in terms of:
- sector concentration
- volatility tolerance
- income preference
- macro sensitivity
- long-term diversification goals
QQQ vs SPY expense ratio and dividend yield comparison for 2026
In 2026, one of the practical differences between SPY and QQQ remains their income profile and cost structure. Expense ratios are both relatively low by active-fund standards, but dividend yield tends to differ because SPY has more exposure to mature dividend-paying sectors, while QQQ is more tilted toward reinvestment-oriented growth companies.
For investors, this means:
- SPY may be more attractive for balanced long-term exposure and income sensitivity
- QQQ may appeal more to investors prioritizing growth over current yield
- total return expectations should be considered alongside cost and distribution profile
Portfolio overlap tool for QQQ and SPY top 10 holdings
Although SPY is diversified and QQQ is more concentrated, there is still significant overlap between the two because both hold major U.S. mega-cap companies. A portfolio overlap view helps show how much of the same leadership names appear in both ETFs and whether combining them really creates diversification or simply increases exposure to the same dominant stocks.
This is especially useful when assessing:
- concentration in mega-cap technology
- duplicated exposure to top holdings
- whether adding QQQ meaningfully changes an existing SPY-heavy allocation
Risk-adjusted return (Sharpe Ratio) comparison of QQQ vs SPY
A risk-adjusted return comparison helps put raw performance into context. QQQ may outperform during strong growth phases, but it often does so with greater volatility. SPY may deliver lower upside in those same environments, but with more stable participation across sectors.
A Sharpe-style comparison is useful because it asks a more important question than “which one went up more?” Instead, it asks whether the return justified the additional risk.
Comparison of QQQ and SPY volatility (Beta) during the recent AI market rally
During the recent AI-driven market rally, QQQ typically displayed higher beta and stronger directional sensitivity than SPY because of its heavier concentration in semiconductor, software, and large-cap technology names. SPY participated as well, but its broader sector mix muted some of the same upside acceleration.
This type of comparison helps traders understand:
- where momentum is concentrated
- which ETF is likely to move more aggressively on headlines
- how to size exposure depending on volatility tolerance
Weighting of ‘Magnificent Seven’ stocks in QQQ vs SPY as of Q1 2026
The weighting of the largest U.S. technology and growth names has a much bigger impact on QQQ than on SPY. As of Q1 2026, the “Magnificent Seven” continue to influence both ETFs, but their weight inside QQQ makes it more sensitive to earnings, AI narratives, and valuation shifts tied to those few companies.
This is one reason traders often watch QQQ for leadership signals while using SPY as a broader market confirmation tool.
Analyzing SPY and QQQ for Better Trading Decisions
Most traders analyze SPY and QQQ side by side. This helps them to gauge the market’s overall sentiment and performance. As mentioned above, SPY represents the broader U.S. market, while QQQ is centered on the tech sector. This creates a high correlation between the two, as the tech industry is a significant part of the U.S. economy. However, their performances can vary due to the differences in sector focus. For example,
- Say the tech sector is booming.
- Now, QQQ outperforms SPY.
- It offers higher returns to investors looking for growth.
On the other hand, during periods of tech underperformance, QQQ experiences sharper declines. In such a situation, SPY provides more stability as it is diversified across multiple sectors like industrials, healthcare, and financials. This diversification cushions SPY from drastic losses that may hit tech-heavy funds like QQQ.
Therefore, we can clearly see that the correlation and differences between SPY and QQQ help traders balance risk and returns effectively. For more clarity, let’s study an example related to QQQ vs. SPY performance during the COVID-19 pandemic:
- During the COVID-19 pandemic, tech stocks experienced a massive surge.
- This caused QQQ to significantly outperform SPY.
- From March 2020 to the end of 2020, QQQ, which tracks tech-heavy companies in the Nasdaq 100, soared by about 48%.
- This rapid growth was primarily driven by increased demand for tech services like cloud computing, e-commerce, and streaming.
- This trend benefited companies like Apple, Amazon, and Microsoft.
- In comparison, SPY, which tracks the broader S&P 500, increased by about 16% over the same period.
- While still profitable, SPY’s gains were lower due to its exposure to sectors that were hit hard during the pandemic.
- Traders who recognized the booming demand for tech services during the pandemic allocated more to QQQ to benefit from its stronger returns.
This divergence clearly shows how, during periods of tech outperformance, QQQ provides higher returns, but when tech falters, SPY’s diversification offers more stability. To optimize your trading, Use Bookmap’s advanced analytics to track real-time price movements in SPY and QQQ.
Impact of Economic Indicators on SPY and QQQ
Be aware that several traders closely watch macroeconomic events like Federal Reserve announcements or GDP reports to gauge their effects on SPY and QQQ. These events influence market sentiment and stock prices differently across sectors. Check the graphic below to see some common factors:
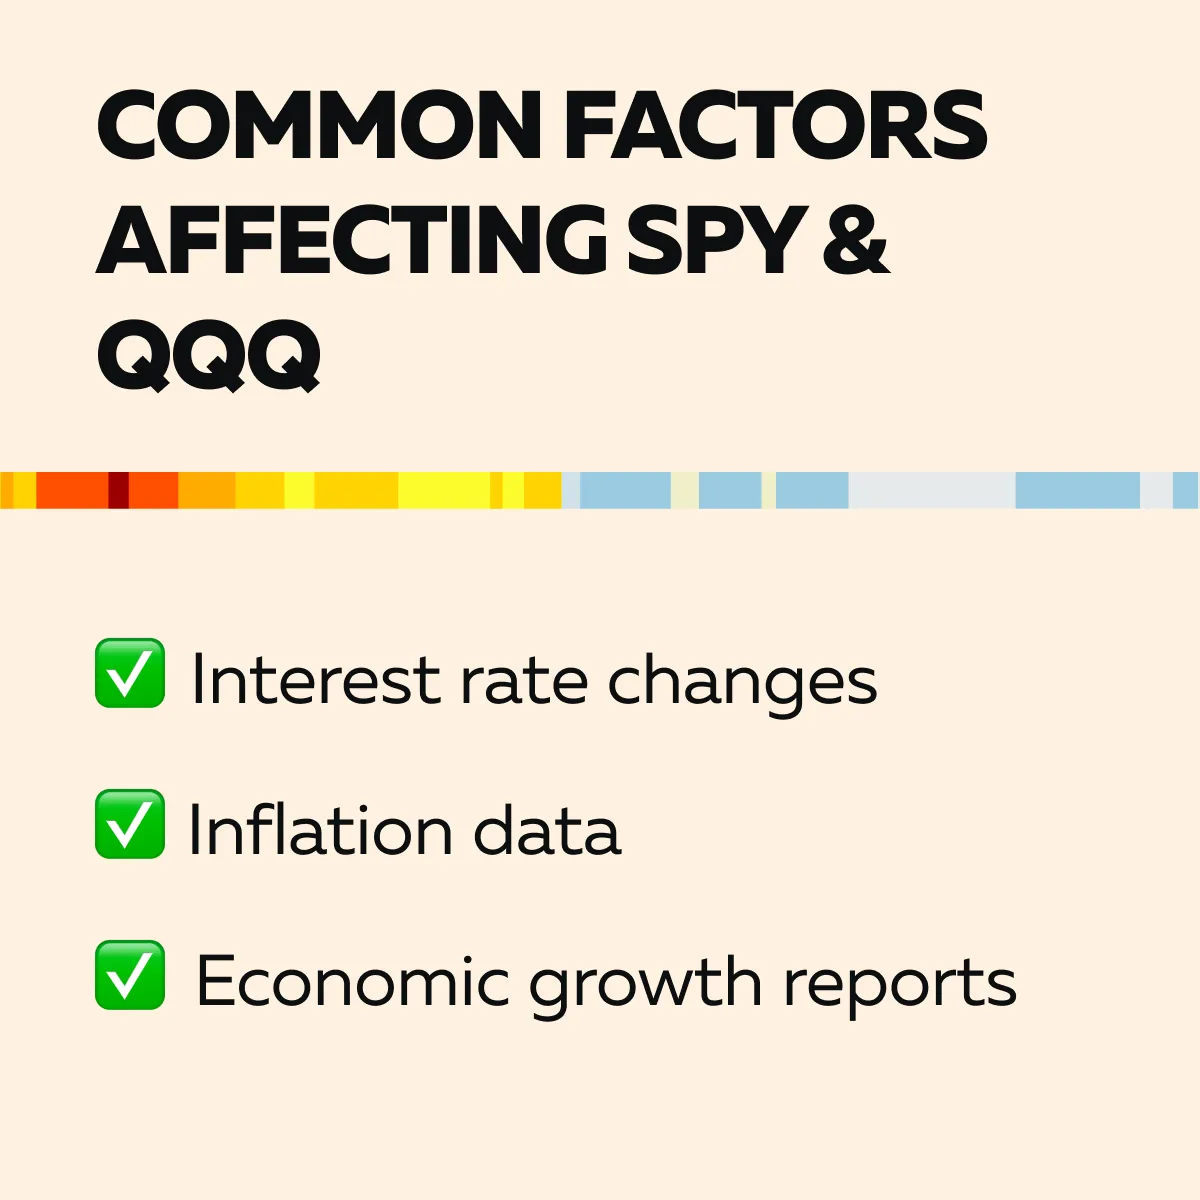
Please note that these factors lead to fluctuations in both ETFs but with varying impacts due to their sector composition. A key example of this is when the Federal Reserve raises interest rates. In such situations, tech-heavy stocks, like those in QQQ, drop more steeply during rate hikes. This happens because when rates rise, borrowing becomes more expensive. This impacts tech firms’ profits and stock prices. Meanwhile, SPY remains more stable, as other industries like financials or industrials might be less affected by the rate hike or may even benefit from it.
Volatility in SPY and QQQ
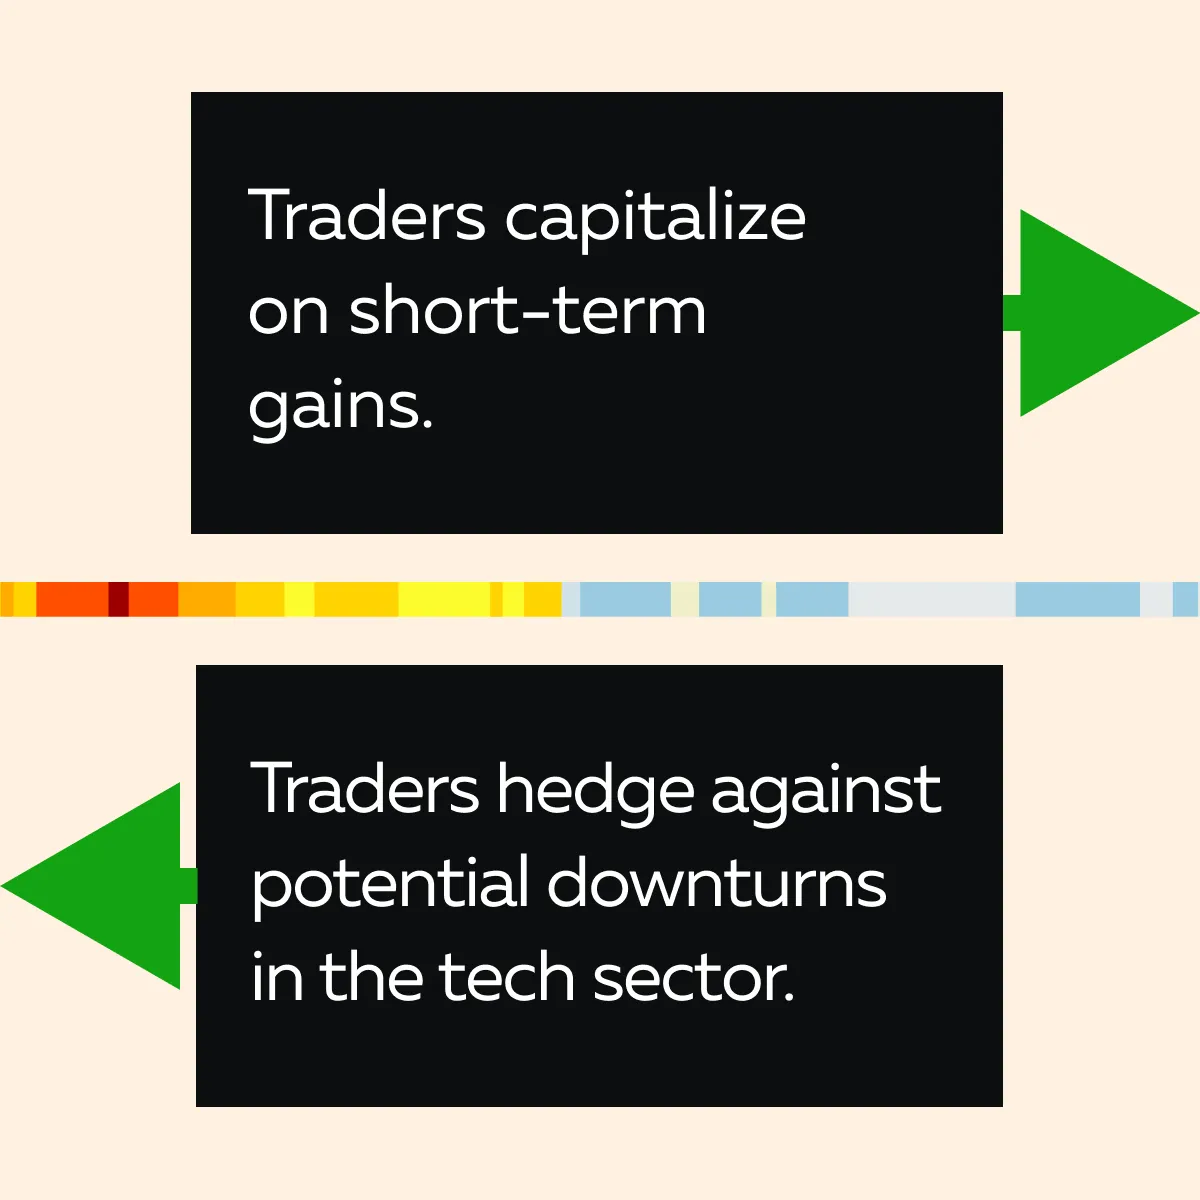
Volatility in the tech sector leads to greater fluctuations in QQQ than SPY. Because QQQ is concentrated in growth-oriented tech companies, its value swings more sharply in response to industry news or economic events. Check the graphic below to see how traders take advantage of this volatility:
For example,
- During earnings seasons for major tech companies like Apple, Amazon, and Google, QQQ often experiences increased volatility.
- Traders anticipate big moves in these stocks based on their earnings reports.
- This leads to opportunities for strategies like:
- Scalping (quick, small trades)
or
- Swing trading (holding positions for some days)
- In comparison, SPY is more diversified across multiple sectors.
- It sees less extreme price fluctuations during the same period and provides more stability.
Practical uses for traders and investors
SPY and QQQ are useful not only as investments, but also as benchmarks for strategy. Traders use them to gauge broad market tone, identify sector rotation, and compare growth leadership against overall market participation. Investors use them to build allocations, compare concentration risk, and decide how much exposure they want to growth versus broad diversification.
This makes the pair useful across multiple time horizons:
- intraday traders watch them for sentiment and leadership
- swing traders compare relative strength and momentum
- long-term investors use them to evaluate portfolio structure and risk concentration
How to hedge a tech-heavy QQQ portfolio using SPY put options
A trader or investor with a heavy QQQ allocation may use SPY puts as a broad-market hedge when expecting overall market weakness. This is not a perfect hedge because QQQ and SPY have different sector weights, but it can still help offset downside during broad equity declines.
For context on how market exposure should be interpreted before applying a hedge, learn more here:
https://bookmap.com/blog/beta-weighting-what-it-really-tells-you-about-market-exposure
Before using SPY options or any index-level hedge against a QQQ-heavy portfolio, it helps to understand how beta-weighted exposure can differ from simple position size.
Growth-focused vs value-focused investing strategies in 2026
In 2026, the distinction between growth-focused and value-focused investing remains highly relevant. QQQ is more aligned with growth, innovation, and technology leadership, while SPY includes both growth and value exposure through its broader sector mix.
This means:
- QQQ may outperform when investors reward innovation and long-duration earnings potential
- SPY may offer more resilience when markets rotate into defensives, cyclicals, or dividend-paying sectors
Top-rated diversified index funds for long-term retirement accounts
For retirement accounts, diversification typically matters more than short-term leadership. That is one reason broader index vehicles like SPY-style exposure are often preferred as core holdings, while QQQ-style exposure may be used as a growth satellite rather than the entire portfolio.
The key issue is not which ETF is “better” in isolation, but how each one fits the investor’s time horizon, risk tolerance, and overall asset allocation.
Impact of interest rate hikes on technology sector benchmarks
Interest rate hikes often affect QQQ more than SPY because higher rates tend to pressure growth valuations more directly. Since QQQ has more exposure to long-duration growth companies, it usually reacts more sharply when markets reprice future earnings.
SPY can still decline during hikes, but its diversification often softens the impact relative to a more concentrated technology benchmark.
How to build a passive ETF portfolio for beginner investors
For beginner investors, SPY and QQQ can serve different roles in a passive portfolio. SPY is often used as a core broad-market position, while QQQ may be added in a smaller allocation to increase growth exposure.
A simple framework might include:
- a broad-market ETF as the portfolio core
- a growth-oriented ETF as a tactical or satellite position
- ongoing rebalancing based on goals and risk tolerance
Broad market indices vs sector-specific investment vehicles
SPY and QQQ illustrate the difference between a broad market index vehicle and a more sector-concentrated vehicle. Broad indices typically provide greater diversification and smoother participation across economic cycles. Sector-tilted instruments can generate stronger performance in favorable environments, but they usually come with higher concentration risk.
That is why watching both together can be useful even for traders who are not actively buying either ETF.
Conclusion
SPY and QQQ are important tools for traders who are looking to understand market sentiment. SPY offers insight into the overall U.S. stock market by tracking a wide range of industries. Contrarily, QQQ focuses specifically on the tech sector and growth-oriented companies. By monitoring both ETFs, traders gain a well-rounded view of how different sectors are performing. Even they can easily identify potential opportunities or risks in the market.
For example, if tech stocks are soaring, QQQ might outperform SPY. This situation indicates a strong tech rally. On the other hand, if the tech sector is struggling, SPY’s broader diversification provides more stability. This helps traders manage their risks.
To develop strong and profitable trading strategies using SPY and QQQ, traders must analyze the real-time market. They can do so using our advanced market analysis tool, Bookmap. It allows traders to visualize market data, track price movements, and analyze order flow. Using it, traders can easily enhance decision-making and gain a clearer picture of market dynamics. Do you wish to monitor SPY and QQQ precisely? Use Bookmap and stay ahead of the competition!
FAQ
Are you looking for a short-term day trading chart or long-term historical data?
Short-term traders usually focus on intraday leadership, correlation, and relative momentum. Long-term investors are generally more concerned with historical return, diversification, and concentration trends over time.
Would you like to see the price return chart or total return including dividends?
This distinction matters because SPY tends to have a stronger dividend component than QQQ. A total return view gives a more complete long-term comparison.
Are you interested in a sector-by-sector weight comparison between these ETFs?
Sector weights are one of the most important differences between SPY and QQQ. A sector comparison helps explain why QQQ may outperform or underperform during certain macro regimes.
Do you need to include a third benchmark like the Russell 2000 for context?
Adding a third benchmark can help compare large-cap leadership against small-cap or broader risk sentiment. This is especially useful when trying to understand whether strength is concentrated or widespread.
Is your goal to evaluate these for a taxable account or a tax-advantaged ISA/401k?
Account type can influence how an investor compares these ETFs, especially when thinking about turnover, rebalancing, dividend treatment, and long-term portfolio construction.
Sign Up Now