


See what Delta and CVD reveal about buying and selling.
Compare plans to track aggressive order flow, volume delta, and price reactions in real time.
Trading Basics
October 26, 2026
Delta and Cumulative Volume Delta: What They Show and What They Don’t
 Price shows where the market moved, and “delta” explains who pushed it there. Every trade has a buyer and seller, but the primary question for order flow analysis is which side is acting aggressively and how that aggression influences price.
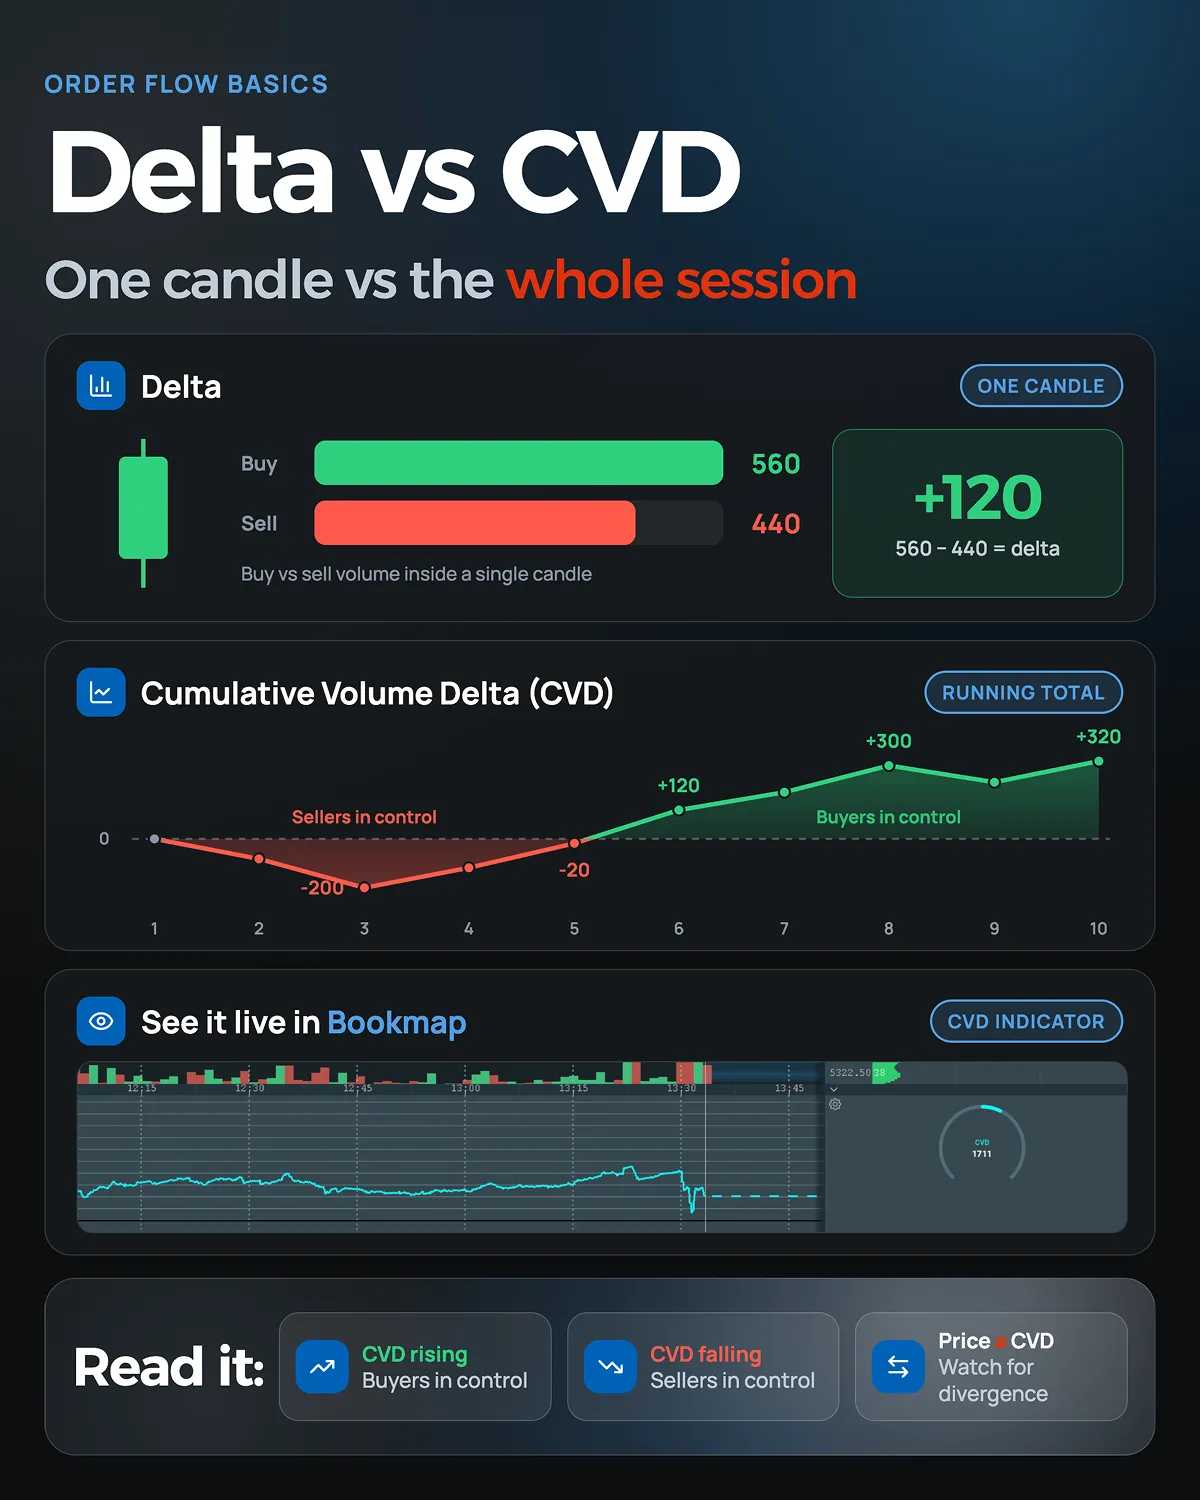
This is where delta and cumulative delta become useful tools for studying order flow. Delta measures the difference between aggressive buying and selling within a specific period, while cumulative delta tracks how that balance develops over time.
Read this article to learn what delta is in trading, how the cumulative delta indicator works, and the difference between delta and cumulative delta. The article also explains delta divergence trading, common mistakes to avoid, and how liquidity context can add depth to reading delta charts.
What Delta Actually Measures
Delta measures the difference between aggressive buying and aggressive selling during a specific period, such as a candle or bar. Market orders that hit the ask are counted as aggressive buying, while market orders that hit the bid are counted as aggressive selling. The following visual breaks down how order flow delta comes together. h
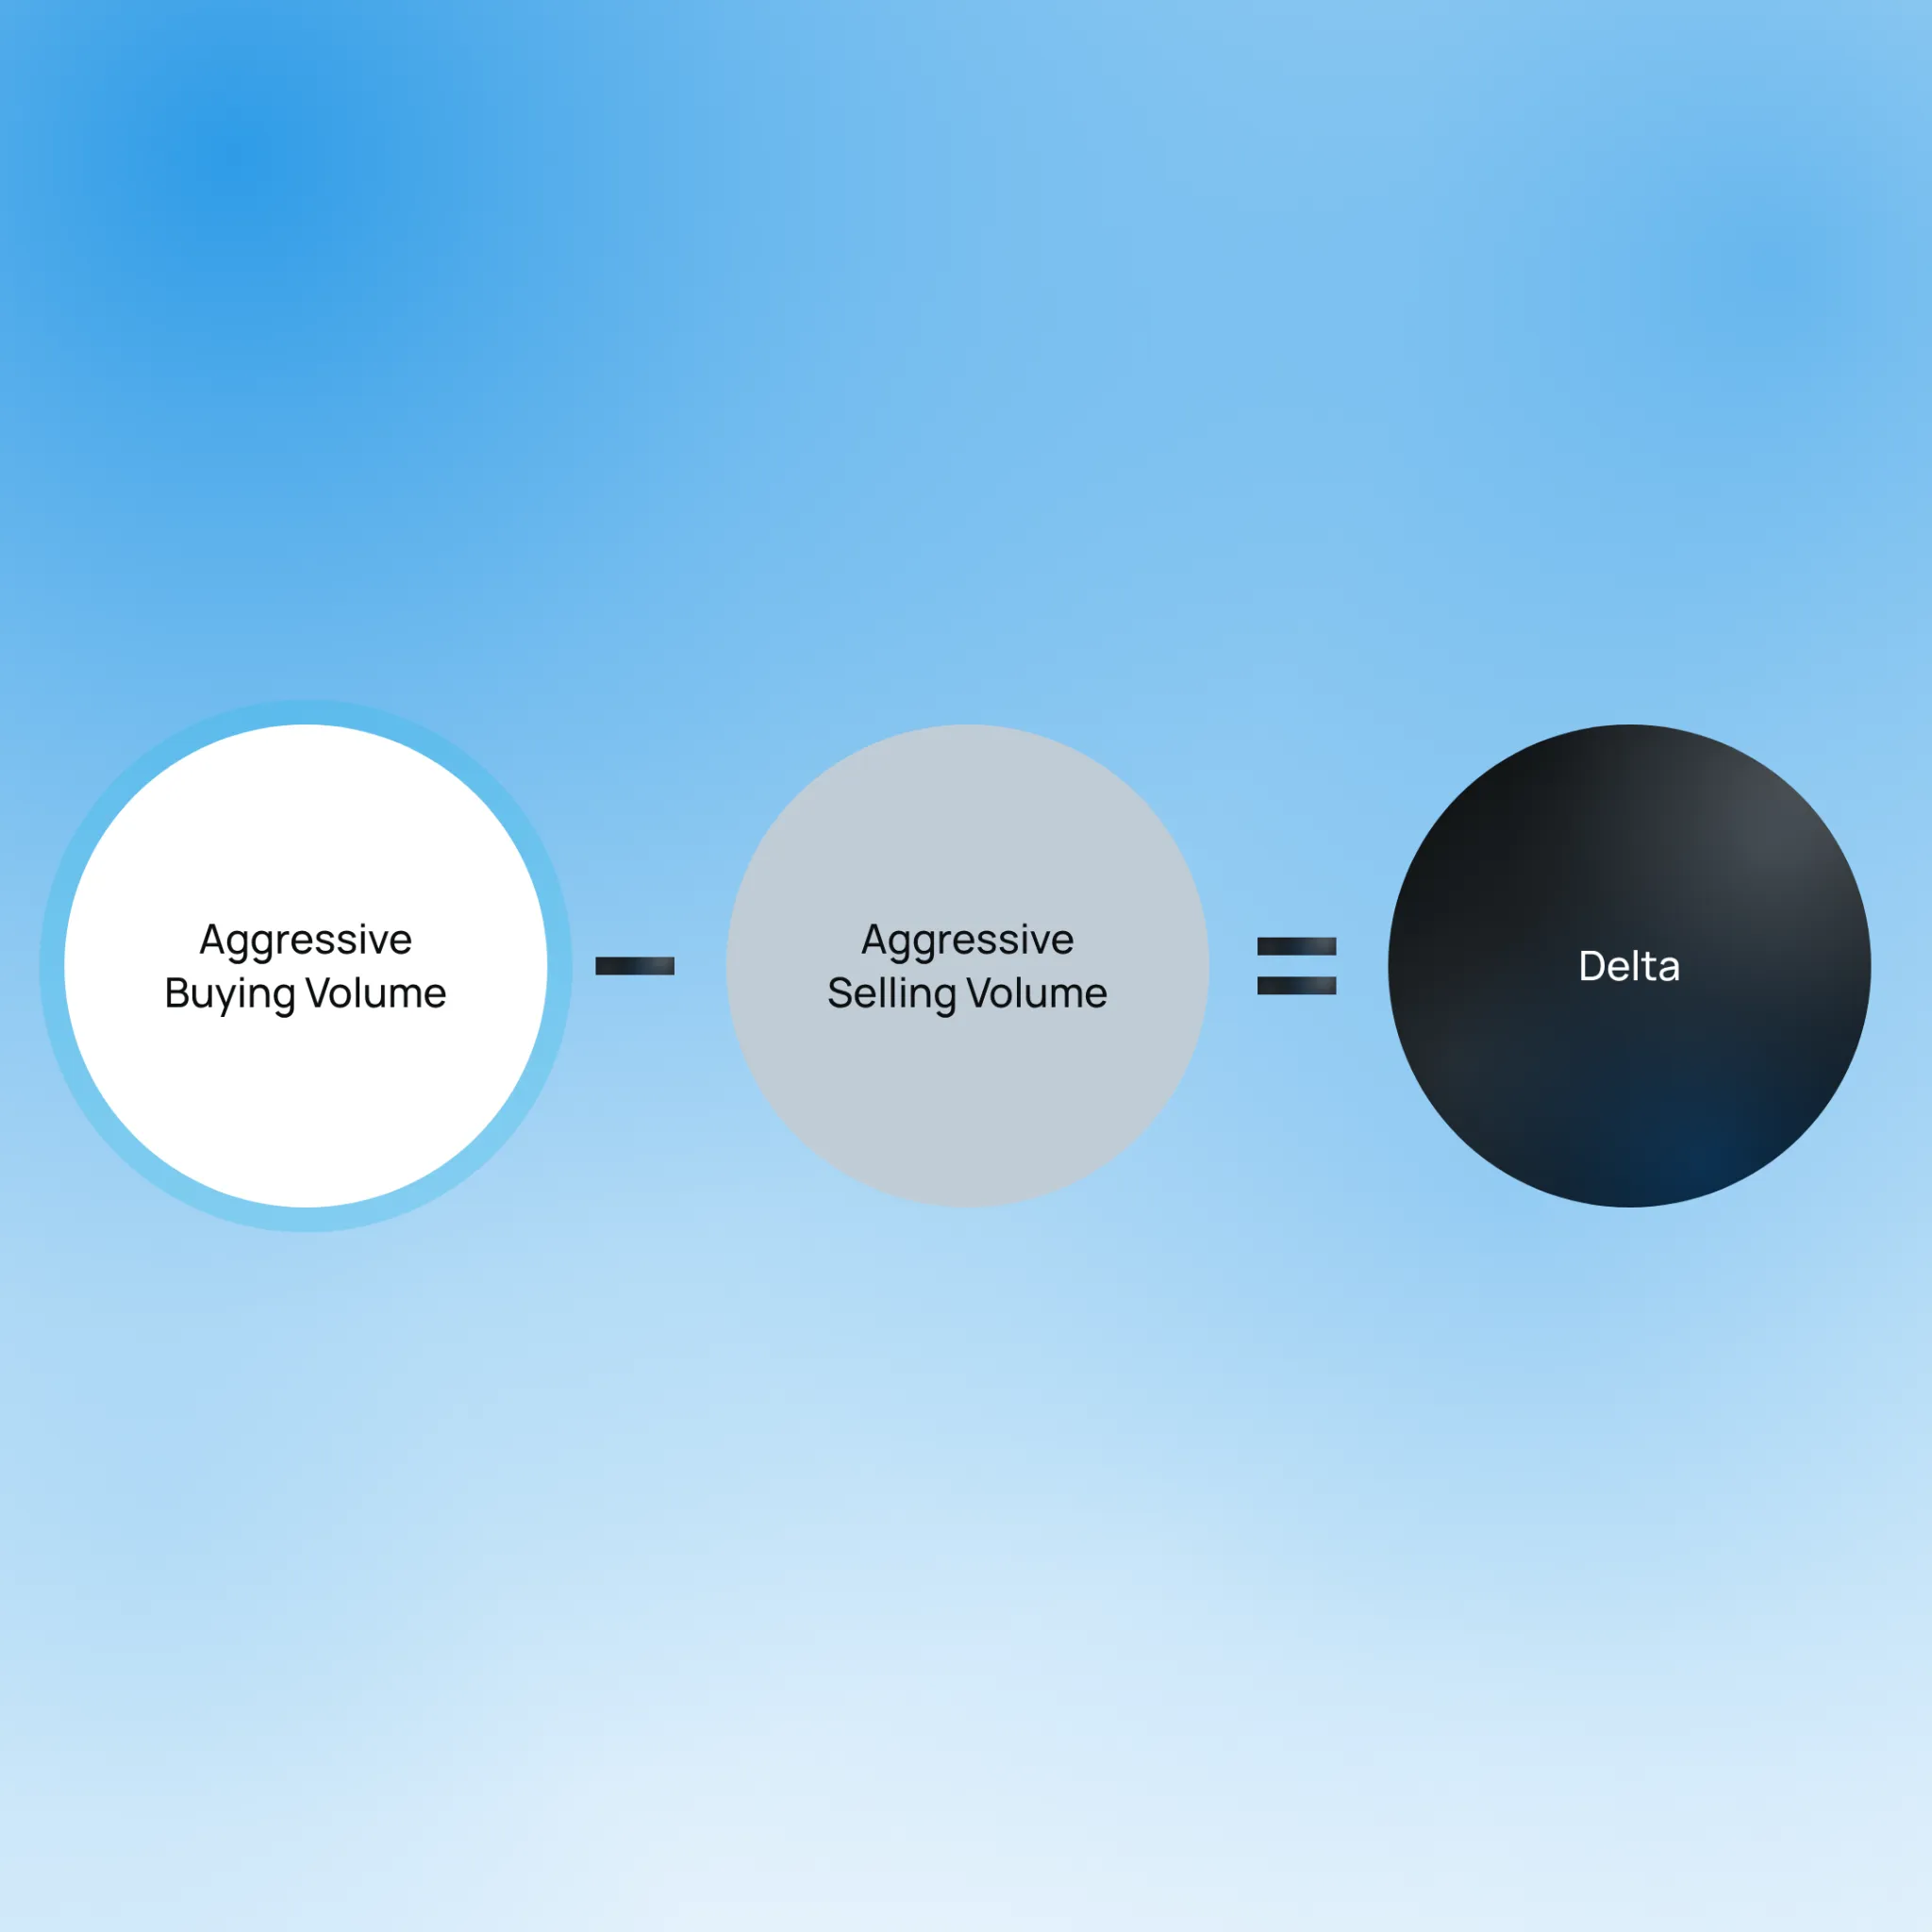
Therefore, positive delta means more aggressive buying occurred during that period, while negative delta means more aggressive selling occurred. However, delta does not show which side ultimately “won.” For example,
- A candle can close lower despite having strong positive delta if aggressive buying is absorbed by enough resting sell orders.
This distinction becomes especially important when studying delta divergence trading.
What Cumulative Volume Delta Adds
Cumulative delta takes the delta from each period and adds it to the previous total. Depending on the platform’s settings, the calculation can run across:
- A trading session, or
- A selected time window.
While a delta trading indicator shows the balance of aggressive buying and selling in a single period, a cumulative delta indicator shows how that balance develops over a longer stretch.
Thus, cumulative delta can reveal whether aggressive buying or selling has been building over time rather than highlighting only one bar. Since individual delta readings can fluctuate sharply, cumulative delta reduces some of this single-bar noise and provides broader market context.
However, cumulative delta does not move exactly like price. Treating the two as identical can lead to misreading, particularly when reading delta charts. Price shows what happened. Order flow can provide more clues about why. Compare Bookmap packages.
Delta vs. Cumulative Delta at a Glance
Delta and cumulative delta both come from the same order flow delta data, but they answer different questions. Let’s see how:
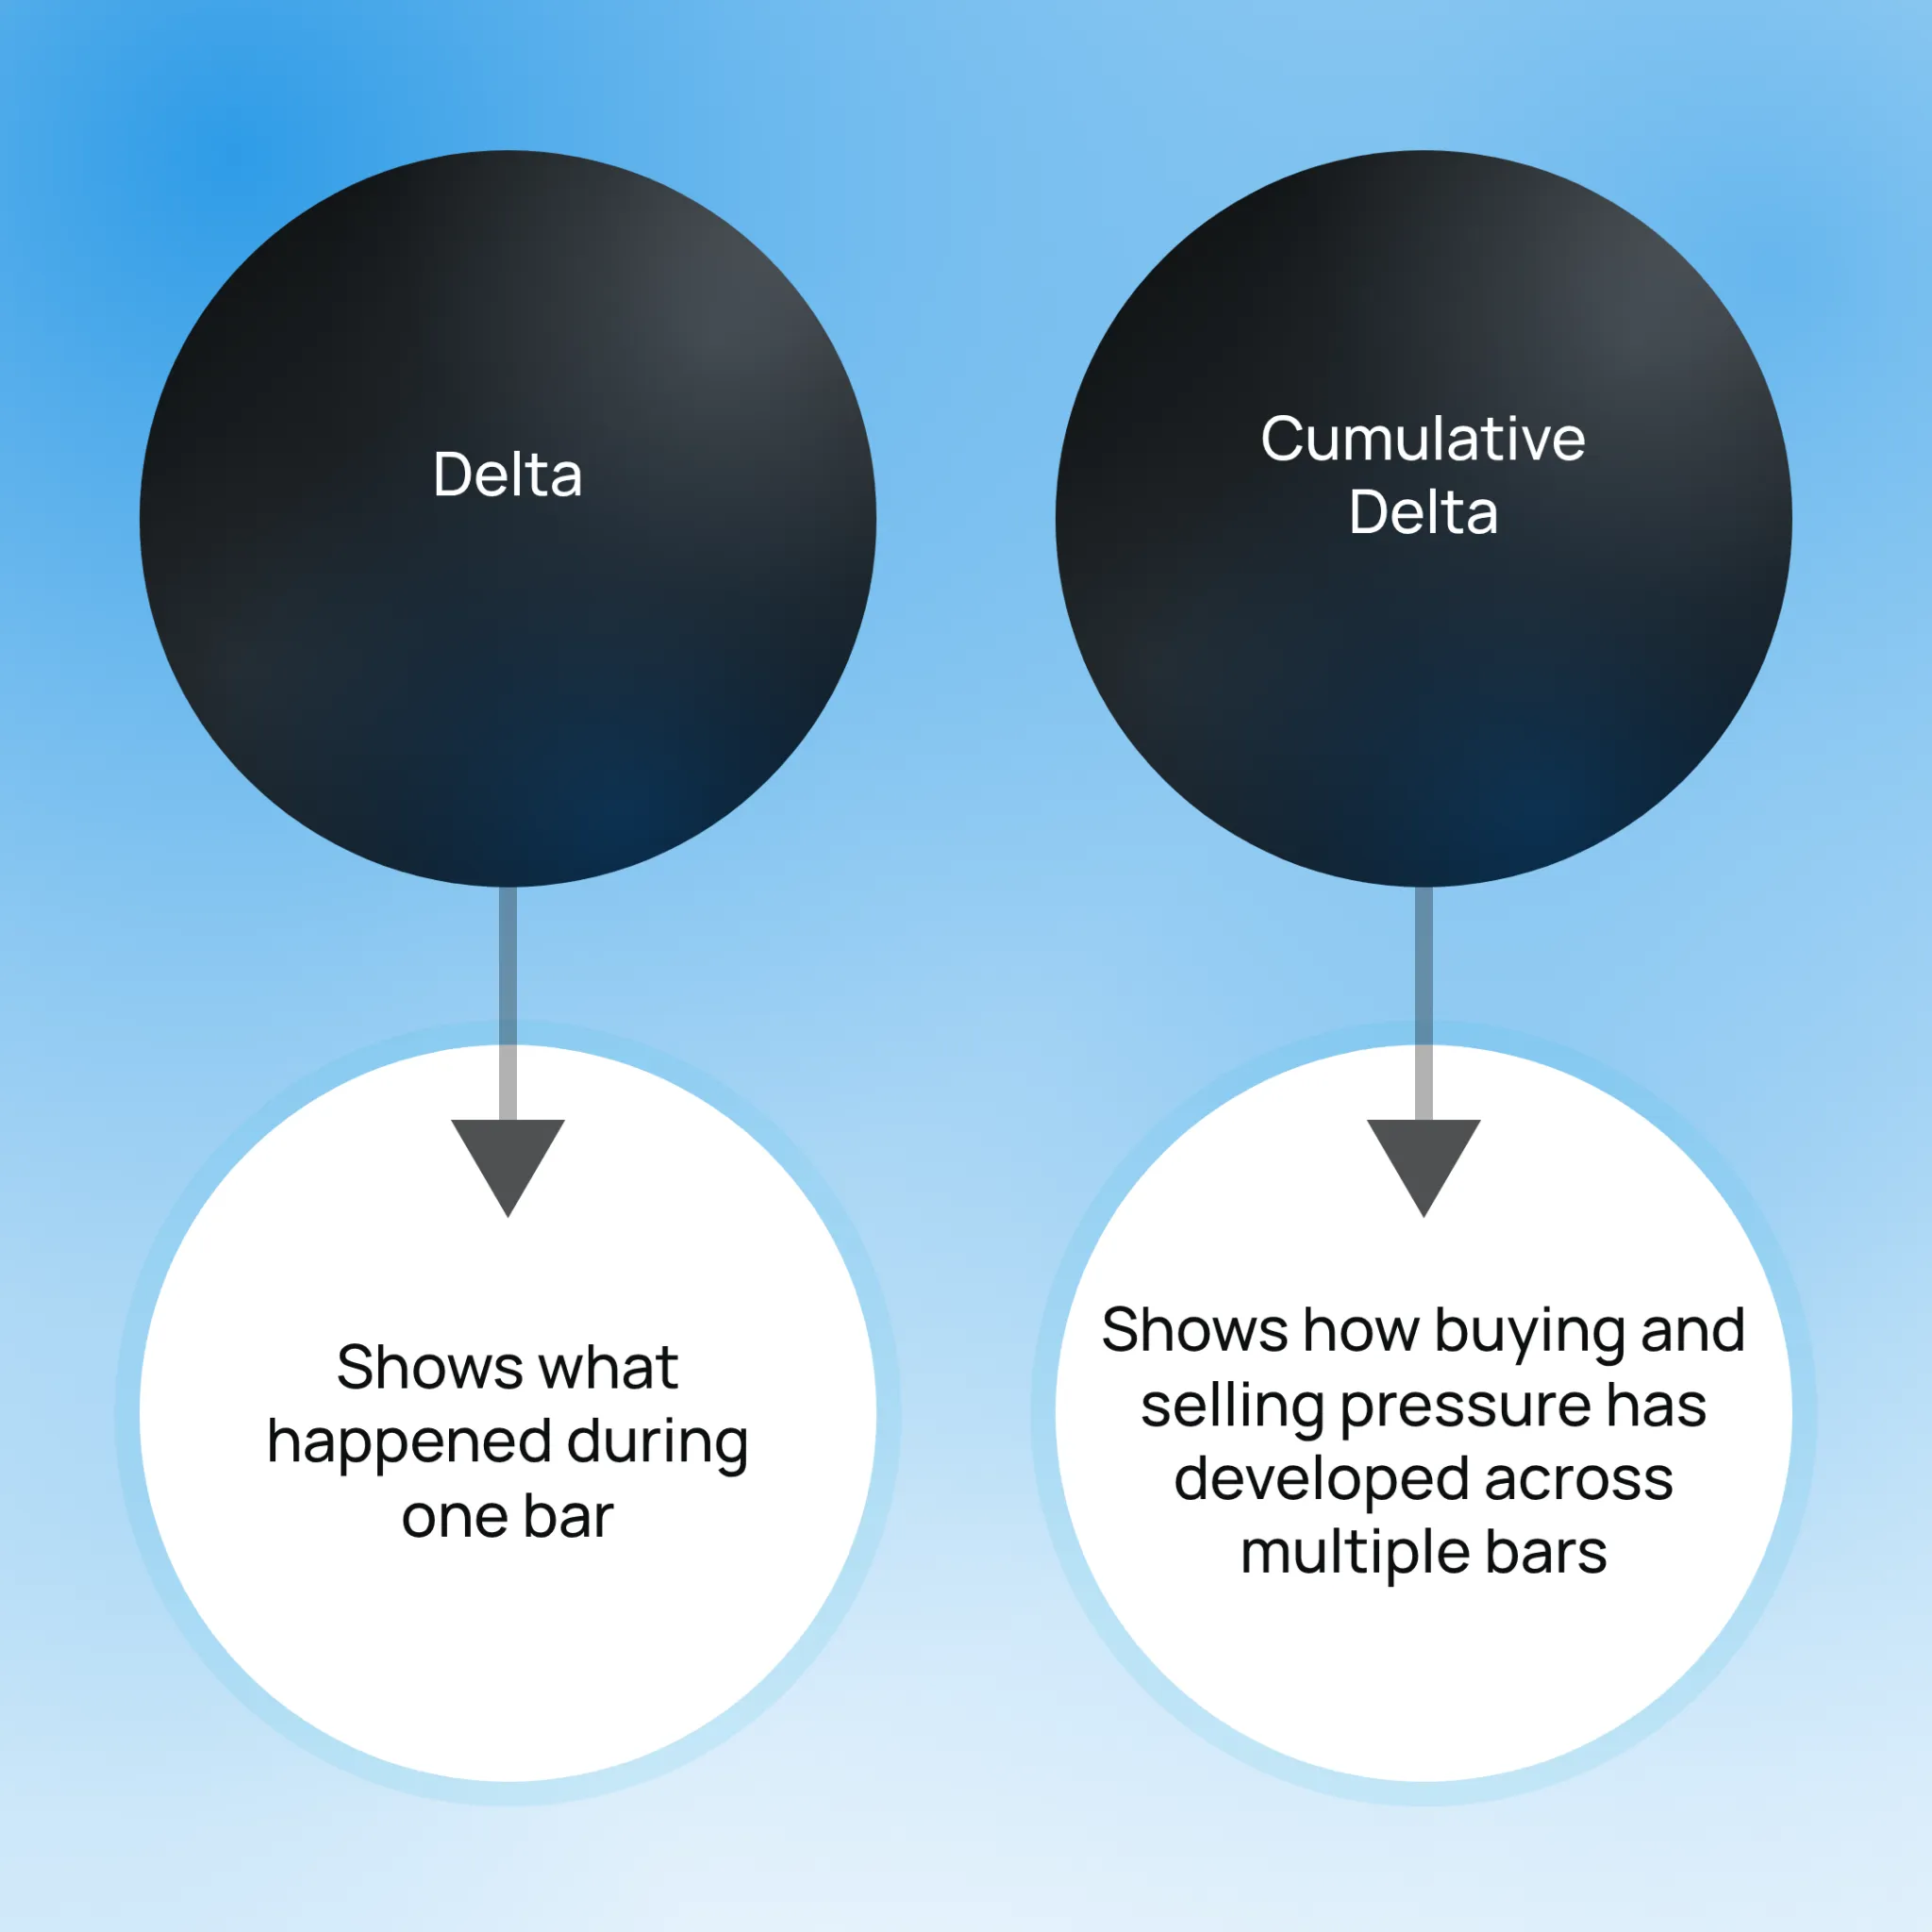
For more clarity, let’s check out the detailed comparison below:
| Feature | Delta | Cumulative Delta |
| What It Measures | The difference between aggressive buying and selling in a single bar or period | The running total of delta values across a session or selected time window |
| Best Used For | Reading buying or selling aggression in the current bar | Viewing the broader balance of aggressive buying and selling over time |
| Resets | It starts a new reading with each bar. A subchart can show the overall delta for that bar. |
It usually starts from a defined session or time-window beginning, depending on platform settings |
| Common Misread | Assuming a large positive or negative delta guarantees that the price will continue in the same direction. | Assuming cumulative delta should move in the same way as price at all times. |
Thus, as per general market understanding, a delta trading indicator is more useful for examining aggression within a specific period. In comparison, a cumulative delta indicator provides a wider view of how that aggression has accumulated.
What Delta and Cumulative Delta Can Reveal
Cumulative delta shows how aggressive buying and selling have balanced out over a period. Depending on the platform, the calculation may reset at:
- The start of each trading session, or
- A custom time window.
It may also continue without a session reset.
Firstly, this broader view can show aggression building in one direction before the change becomes obvious from price alone. However, a rising cumulative delta line does not mean that price must continue rising. Price can move differently when aggressive orders are absorbed by resting liquidity.
Secondly, the same data can also add context to breakouts and major price moves. When price breaks a level alongside aggressive participation, the order flow delta can indicate whether the move has substantial market-order activity behind it. If that activity is thin, the breakout may have little genuine backing.
Finally, delta divergence trading can examine situations where price and cumulative delta begin to disagree. For example,
- Price may continue making higher highs.
- However, cumulative delta fails to make corresponding highs.
Such divergence does not guarantee a reversal, but it can signal a change in the balance of aggressive participation that deserves further analysis.
The Classic Divergence Case, and Why It’s Not Automatic

A common example of delta divergence trading occurs when price makes a new high, but cumulative delta does not make a corresponding new high. This event indicates that price has moved higher without a similar increase in aggressive buying. As a result, the upward move may have weaker aggressive participation than the previous price high.
However, divergence is only a clue. It is not an automatic trading signal. The difference between price and cumulative delta can develop for several reasons. For example,
- Passive sell orders may absorb aggressive buying while price continues to rise.
- In that case, the aggressive buying has not necessarily disappeared.
- Instead, it is being met by resting liquidity.
Therefore, reading delta charts requires context. Delta can show the level and direction of aggressive activity, but delta alone cannot always distinguish between:
- Weakening aggression, and
- Aggression being absorbed by passive orders.
What Delta and Cumulative Delta Don’t Tell You

Delta and cumulative delta show executed aggressive orders. But they do not show the resting orders waiting in the order book. Resting liquidity often determines whether aggressive buying or selling actually moves price.
Let’s understand better through an example:
- Suppose a large positive delta occurs when many market buy orders hit the offer.
- If the nearby sell-side liquidity is thin, those orders may push price higher.
- However, if a large resting sell order absorbs those buy orders, price may barely move despite the same large positive delta.
Similarly, cumulative delta shows how aggressive buying and selling build over time, but its reading depends on the platform’s reset setting. A session-based cumulative delta may restart each trading day, while a continuous calculation may carry the total forward.
Therefore, readings from different days or platforms may not be directly comparable unless the calculation method is the same. Finally, reading delta charts does not reveal exactly where the aggressive orders occurred relative to visible support or resistance.
That’s because delta can only show the amount and direction of aggression. It does not show the full liquidity structure around those trades. Delta tells you who was aggressive. Liquidity tells you why it mattered. Explore Bookmap’s market visualization tools.
Common Misreadings Worth Avoiding
A common mistake in cumulative delta analysis is treating a steadily rising line as proof that price must continue rising. Note that cumulative delta only shows that aggressive buying has exceeded aggressive selling over the selected period. In such situations, price may fail to keep pace if that buying is absorbed by resting sell orders.
Some other mistakes worth avoiding are delineated as under:
| Common Mistake | What Happens | Why It Can Be Misleading |
| Comparing Cumulative Delta Across Different Sessions Without Checking The Reset Setting |
|
|
| Comparing Raw Cumulative Delta When Trading Volume Differs |
|
|
| Reading Delta Charts Without Liquidity Context |
|
|
| Assuming The Same Delta Value Should Produce The Same Price Reaction |
|
|
Pairing Delta With Liquidity Context
Market participants may realize that Delta shows aggressive buying and selling, while liquidity data shows the resting orders waiting in the book.
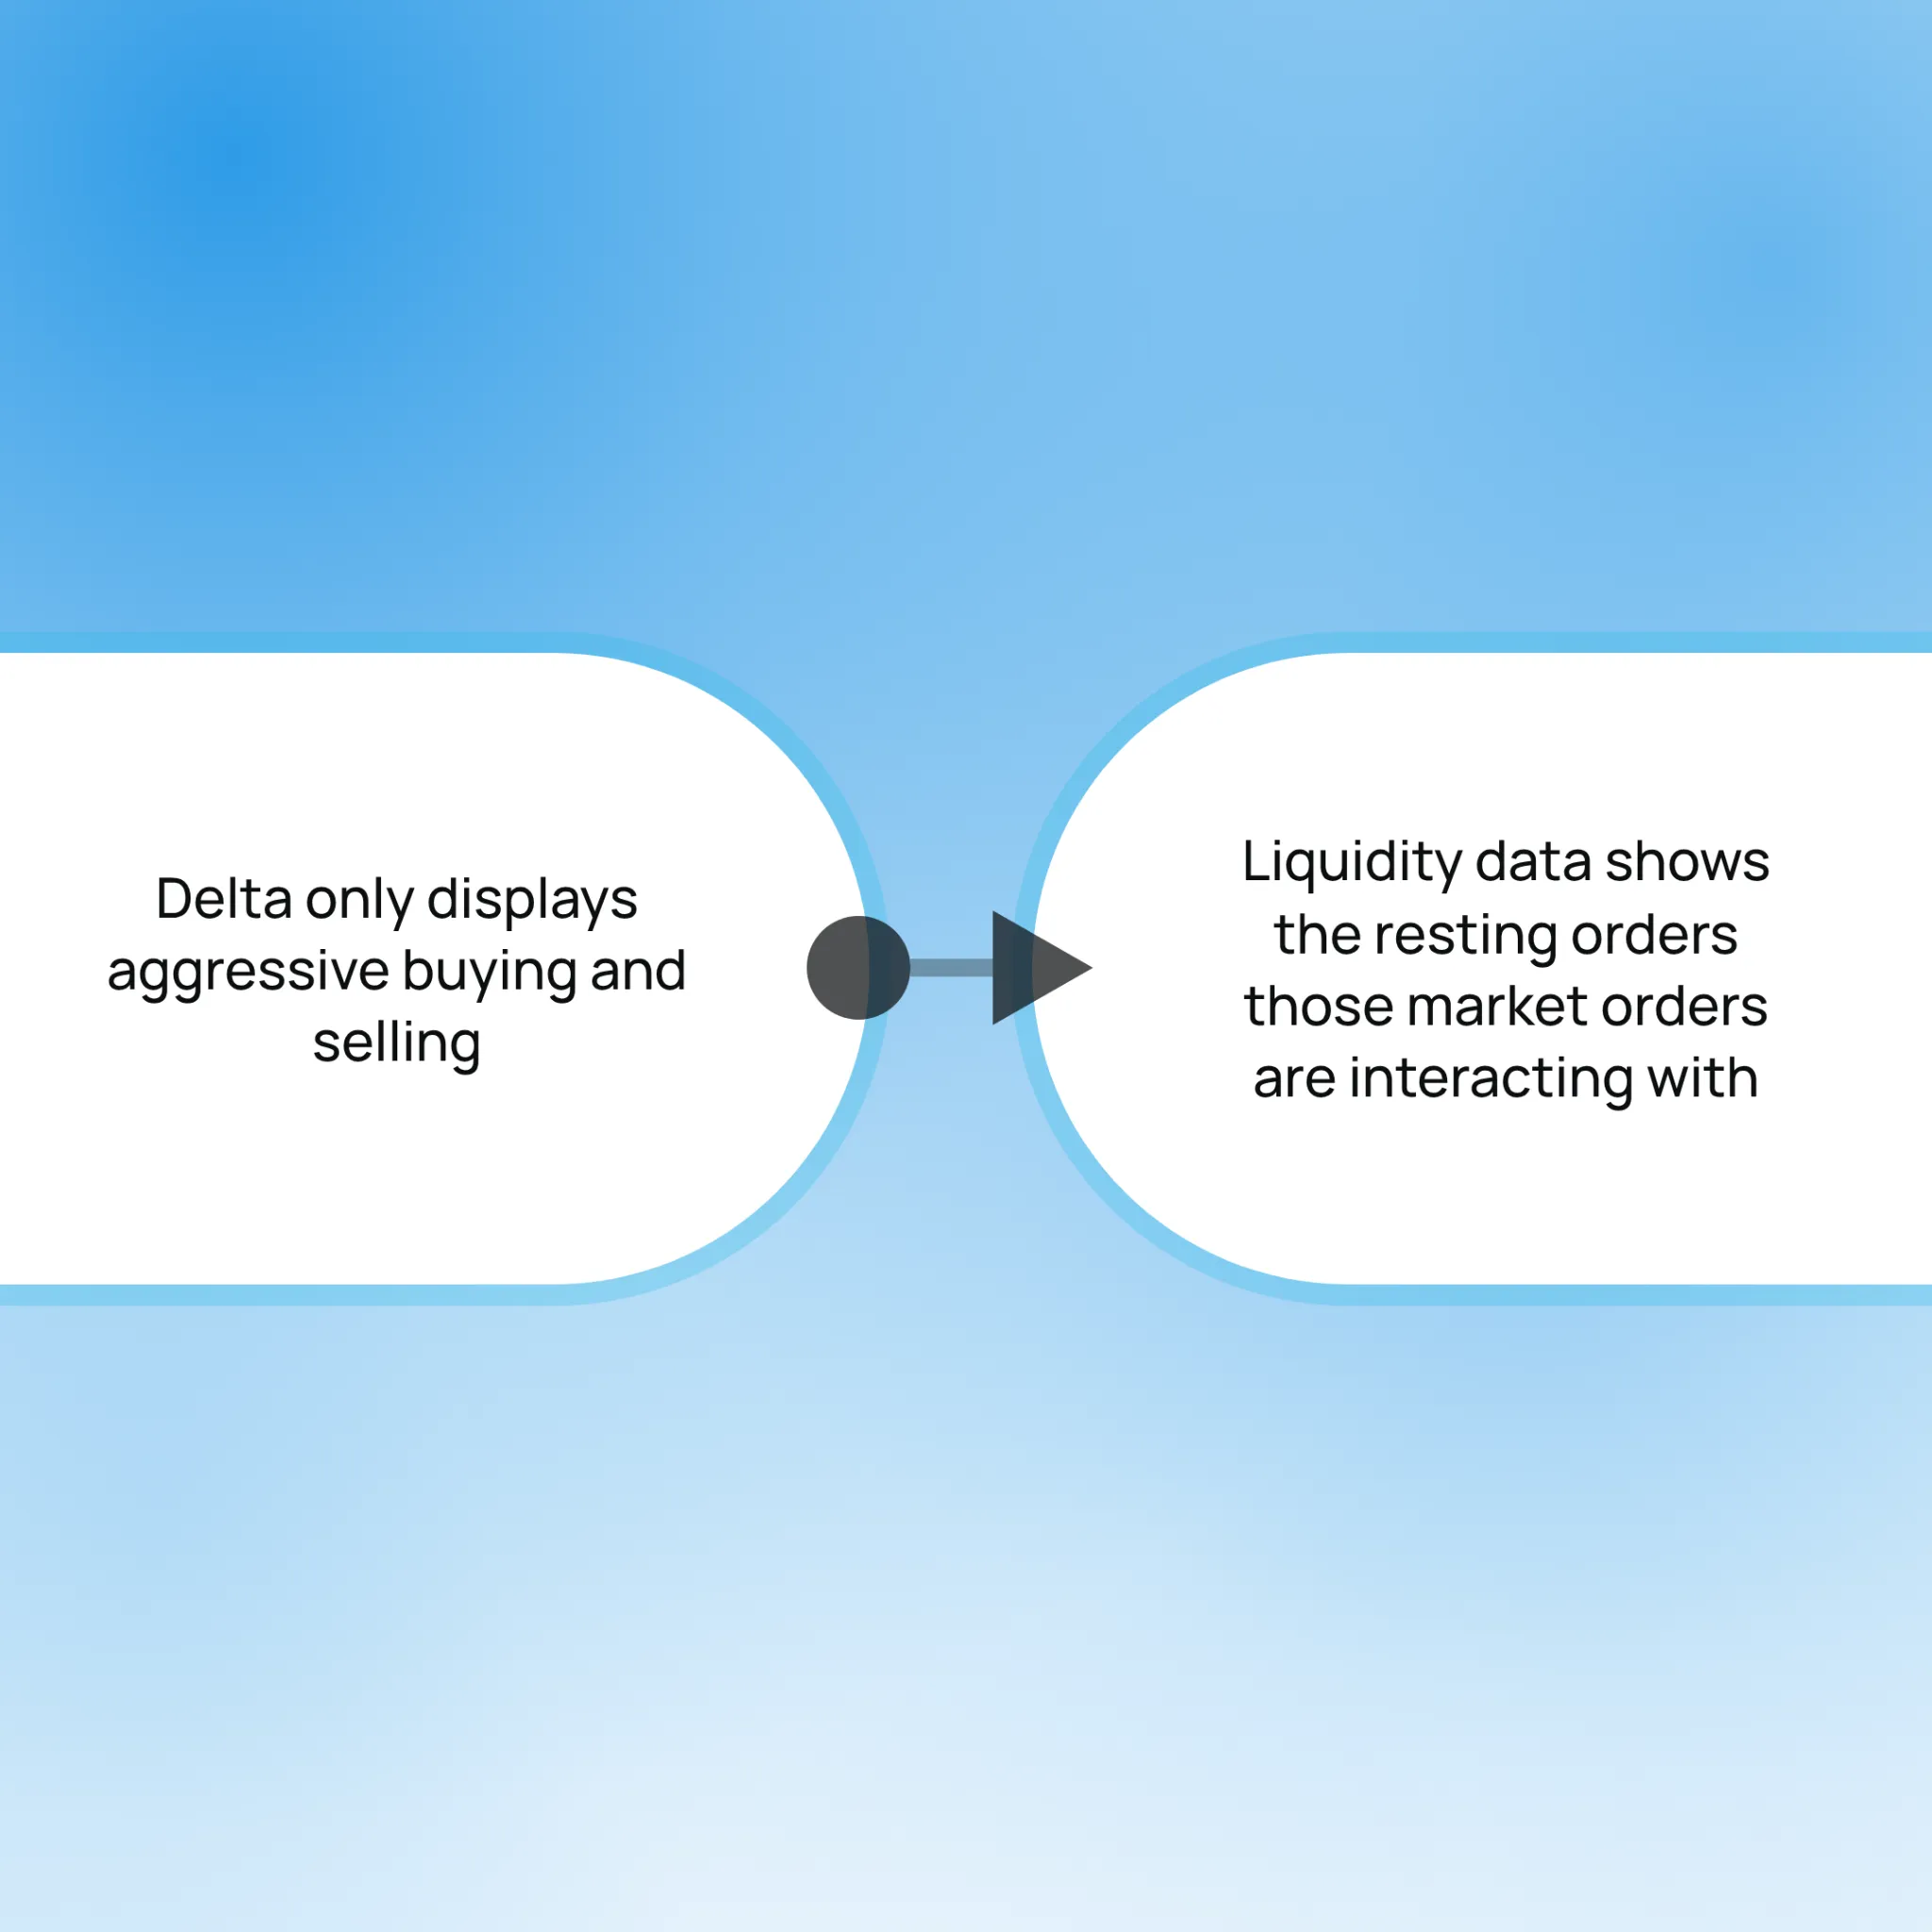
Bookmap’s order flow visualization can bring these two pieces of information together by showing executed aggression alongside resting liquidity. For example,
- Strong buying may appear in delta as market orders repeatedly hit the offer.
- If sell-side liquidity near that level is limited, price may move higher as those orders consume the available offers.
- In contrast, the same level of aggressive buying may produce minor price movement when a large resting sell order absorbs the incoming orders.
This shows why delta alone does not explain the full price reaction. The “delta reading” describes the aggression, while the liquidity visible in the order book helps explain how the market responds to that aggression.
Therefore, delta is best treated as one piece of market evidence rather than a complete picture. With Bookmap, traders can combine order flow delta with liquidity context. Such a combined analysis provides a broader view of why aggressive activity may move price in one situation but become absorbed in another.
Conclusion
Delta and cumulative delta offer a view of buying and selling aggression, but neither shows the complete market picture. Delta captures the balance of aggressive orders within a single bar or period, while cumulative delta tracks how that balance develops over a longer stretch.
Therefore, the two should not be treated as interchangeable indicators. A strong delta reading does not guarantee price continuation, just as a rising cumulative delta does not always mean that price will keep moving higher.
That’s because resting liquidity can absorb aggressive orders and change their impact on price. This is why many traders use Bookmap to read delta charts combined with order book data. Good trading decisions start with better evidence. See how Bookmap helps traders observe liquidity and order flow in real time.
FAQs
1. What is the difference between delta and cumulative delta?
Delta measures the difference between aggressive buying and aggressive selling during one candle, bar, or selected period. As per general market understanding,
- Positive delta means buying aggression was higher.
- In comparison, a negative delta means selling aggression was higher.
Now, cumulative delta adds these individual delta values together. Therefore, delta shows what happened during a specific period, while cumulative delta shows how buying and selling aggression has built up across a session or selected time window.
2. What does it mean when cumulative delta diverges from price?
Cumulative delta divergence occurs when price and cumulative delta move differently. For example,
- Suppose price reaches a new high while cumulative delta remains below its previous high.
- This may indicate that the price move has less aggressive buying behind it than before.
However, divergence does not automatically indicate that price will reverse. Passive orders may be absorbing aggressive buying and are creating a similar pattern. Therefore, delta divergence trading treats divergence as an important clue rather than a guaranteed reversal signal.
3. Can delta be misleading?
Yes, Delta shows the difference between aggressive buying and selling, but it does not show the resting liquidity that those orders encounter. For example,
- Assume that strong buying in the market pushes price higher.
- This happens because nearby sell orders are limited.
- Now, the same amount of buying may have little effect when a large resting sell order absorbs it.
As a result, a large positive delta does not always indicate that the price will rise, and a large negative delta does not always indicate that the price will fall.
4. Does cumulative delta reset every day?
It depends on the platform and the indicator settings. Some cumulative delta indicators reset when a new trading session begins, while others continue accumulating delta without a daily reset. Some platforms also allow a custom time window.
Consequently, cumulative delta readings from different days or platforms should not be compared without checking whether the same reset method and calculation period are being used.
5. Should traders use delta on its own?
Delta can provide information about aggressive buying and selling, but it does not show the complete market structure. In particular, order flow delta does not show:
- How much resting liquidity sits around the traded price, or
- Whether that liquidity is absorbing aggressive orders.
Therefore, as per general industry understanding, delta and cumulative delta are more informative when examined alongside price levels, support and resistance, and order book liquidity.
Sign Up Now
Latest Articles