


See what is driving price, not just where it moved.
Compare plans to track liquidity, order flow, and participation behind price changes.
Market Structure
September 11, 2026
Price Is the Result, Not the Story: Understanding What Really Moves the Market

Every price on a chart is the end of a decision-making process. It is not the beginning of one.
Most traders learn to read candlesticks, chart patterns, and support or resistance levels to interpret market behavior. While these techniques reveal where price moved, they do not explain why the move occurred.
Realize that behind every candle is a continuous interaction between buyers, sellers, and liquidity, with thousands of orders entering, executing, and disappearing every second. These interactions influence the market long before a price change appears on a chart.
As a result, examining the process behind price can provide valuable context that price alone cannot offer. This is where order flow and market microstructure become important. This article explains what actually moves price and how market participants influence every move. Also, traders will learn why identical candles can tell different stories, and how order flow adds a deeper layer of insight to traditional price action.
Price Is an Output, Not an Input
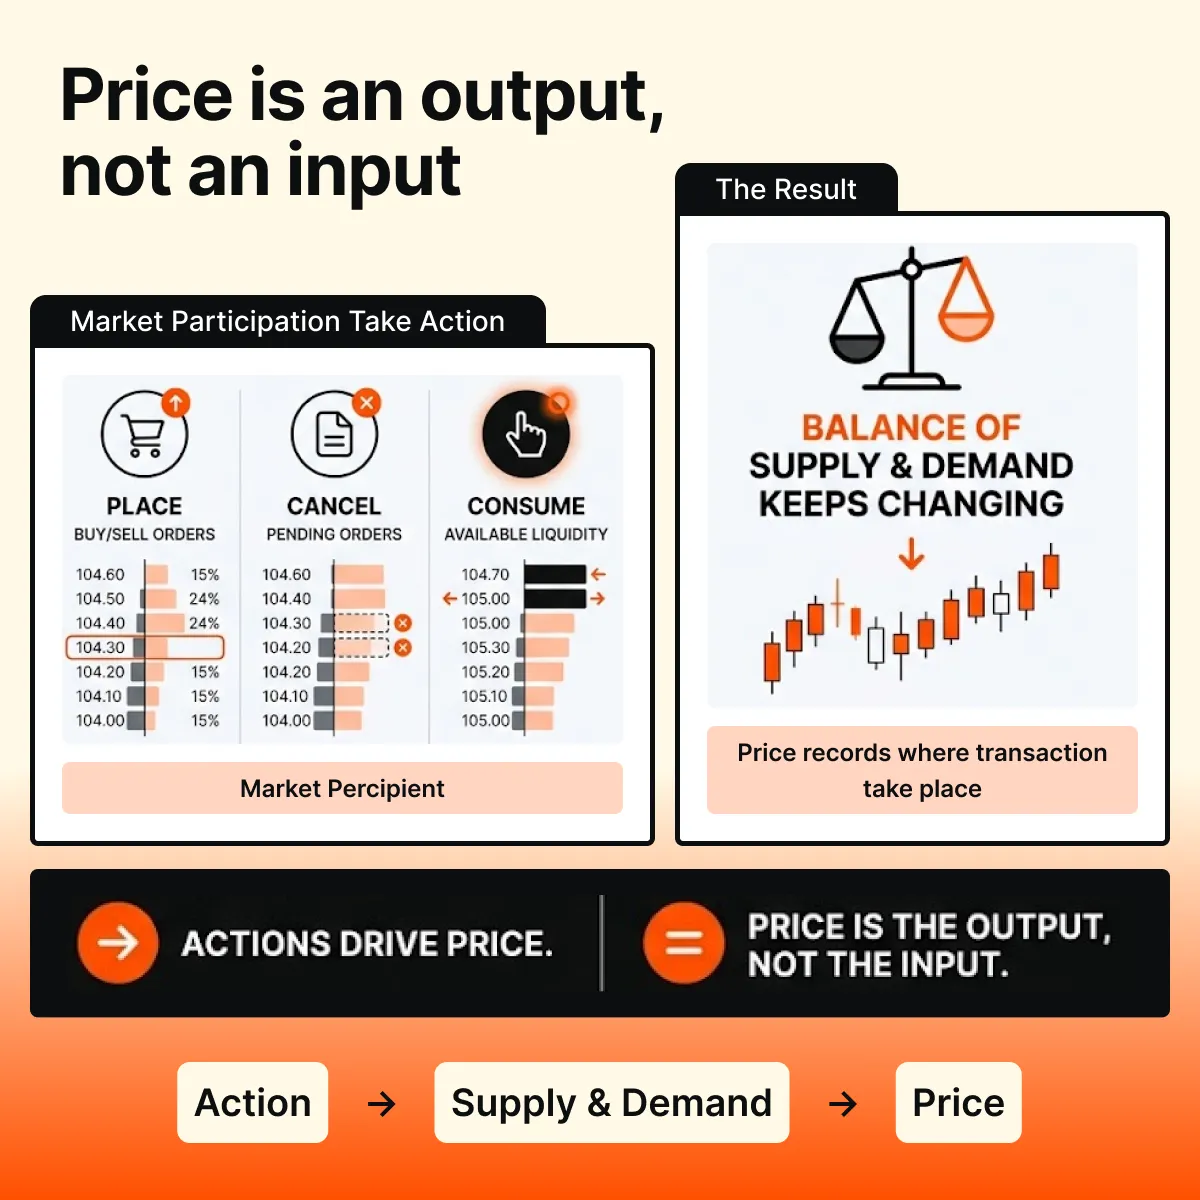
Many traders begin price action analysis by studying candlesticks and chart patterns. However, price itself is not the event that moves the market. Instead, it is the final result of everything that happens between buyers and sellers. Every price movement occurs because market participants:
- Place buy and sell orders
- Cancel pending orders, or
- Consume available liquidity
These actions constantly change the balance of supply and demand within the market. As a result, price records where those transactions finally take place. Thus, price is an “output” of market activity, not the input that creates it. Let’s understand better through an analogy:
- A football scoreboard shows the final score.
- However, it does not reveal:
- Ball possession
- Missed opportunities
- Defensive pressure, or
- The sequence of plays that led to the result.
Likewise, a candlestick shows where price opened, moved, and closed, but it does not show the negotiation (or battle) between buyers and sellers that produced that move. Therefore, charts display the outcome of trading activity rather than the activity itself.
This is where market microstructure and order flow trading become important. Instead of looking only at the finished price move, they examine:
- How orders interact
- How liquidity trading takes place, and
- What actually causes price to change.
As a result, traders who study the process behind price potentially gain more context than those who only evaluate the final candle.
Understand the interaction between buyers, sellers, and liquidity instead of relying on price alone.
What Actually Happens Before Price Moves?
Generally, before the market moves higher or lower, a series of transactions takes place. Price changes or movements usually develop through the interaction of different market participants and their orders. Let’s understand in detail:
| Market Participant | Type of Order Used | What They Do | Impact on the Market |
| Aggressive Buyers and Sellers | Market Orders | Buy or sell immediately at the best available price. | Consume existing liquidity and can push price higher or lower. |
| Passive Participants | Limit Orders | Place buy or sell orders at a chosen price and wait for someone to trade against them. | Provide liquidity and can slow, stop, or reverse price movement. |
| Institutions | Large Orders Split into Smaller Orders | Break large positions into multiple smaller trades instead of executing the entire order at once. | Reduce market impact, hide trading intentions, and avoid causing large price swings. |
As these participants interact, the balance between buying, selling, and available liquidity begins to change. This process forms the foundation of market microstructure and helps explain what moves price.
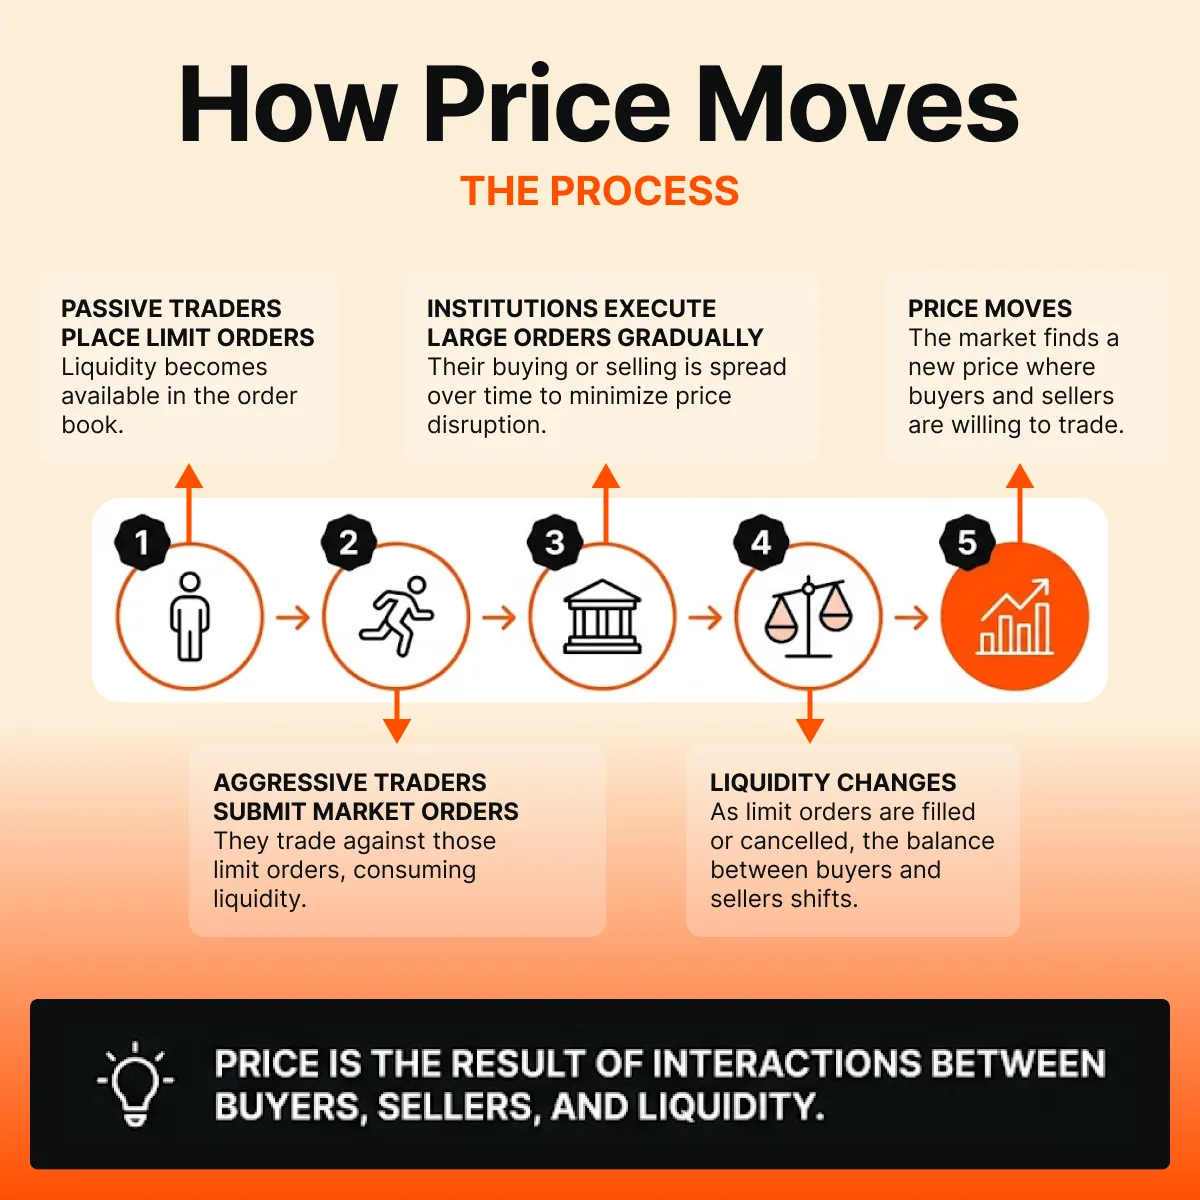
Let’s understand better through an example:
- Suppose aggressive buyers repeatedly lift the available offers.
- Consequently, sellers at those price levels are gradually exhausted.
- As a result, price may move higher.
- On the other hand, sellers may absorb heavy buying pressure by placing large limit sell orders.
- Such an absorption can slow or temporarily stop the advance.
Similarly, a breakout usually occurs after available liquidity at a key price level has been removed. Once those resting orders are filled or cancelled, relatively fewer barriers remain. This may allow price to move beyond the level.
In contrast, large resting buy or sell orders can absorb incoming market orders and temporarily slow price movement until that liquidity is consumed. Therefore, price movement is the outcome of these continuous interactions rather than a random event.
Why Two Identical Candles Can Tell Completely Different Stories
One of the biggest limitations of traditional charts is that two identical candlesticks may represent different market conditions. Although they look the same, the activity behind them can be completely different. To gain more clarity, let’s check out the various scenarios:
| Scenario | What Happened Behind the Scenes? | Why the Candle Looks Bullish | What It May Indicate |
| Strong Institutional Buying | Large institutions place sustained buy orders over time. This creates consistent buying pressure. | Continuous buying absorbs available sell orders and pushes price higher. | Genuine buying interest that may support a continued move if demand remains strong. |
| Short Covering | Traders with short positions buy back shares or contracts to close their trades. | The buying needed to exit short positions drives price higher. This creates a large bullish candle. | The move is caused by traders exiting positions rather than new buyers entering the market. |
| Thin Liquidity | Very few sell orders are available in the order book at nearby price levels. | Even moderate buying moves price sharply because there is little liquidity to absorb it. | The large candle reflects a lack of resistance (not necessarily strong buying demand). |
| Stop Run | Price moves above a key resistance level and triggers buy stop orders placed by other traders. | Those stop orders become market buy orders. Such a conversion adds more buying pressure and extends the move. | The rally is partly driven by forced buying after stops are triggered. |
| News-Driven Panic Buying | Unexpected positive news causes many traders to buy at the same time. | A sudden surge in aggressive buying pushes price sharply higher. | The move is driven by emotion and urgency, which may or may not be sustained after the initial reaction. |
Market participants may observe that although each scenario can produce a similar-looking bullish candle, the reason behind the move is completely different. A candlestick only shows the final result. The underlying market activity determines whether the move was driven by:
- Genuine demand
- Forced buying
- Low liquidity, or
- Any news event.
As a result, price action alone does not explain what moves price or why the move occurred. This is where order flow trading and market microstructure provide additional context. Instead of viewing every bullish candle as the “same signal”, veteran traders examine the buying, selling, and liquidity trading activity that produced the move.
Therefore, the same price pattern can carry a very different meaning depending on the behavior of market participants. Price tells you where the market went. Bookmap helps explain why it went there.
The Market Is Constantly Negotiating
Financial markets operate like an auction, where every trade requires both a buyer and a seller to agree on a price. This process continues throughout the trading session as market participants constantly negotiate where value exists.
When buyers and sellers reach broad agreement, prices usually slow down and move within a relatively narrow range. Usually, this appears as “consolidation” because transactions continue around similar price levels.
What Happens in The Phase of Disagreement
However, when that agreement begins to disappear, price searches for a new level where buyers and sellers are willing to trade. As a result, price may accelerate and produce a breakout. Now, this can lead to three different situations:
| Situation I: Trend Continuation | Situation II: Failed Breakout | Situation III: Price/ Trend Reversal |
| If the move attracts enough participation, the trend can continue. | If buying or selling interest fades, the breakout may fail, causing price to return to its earlier range. | A reversal may develop when one side gradually gains control and shifts the balance of orders. |
These changing conditions explain why consolidation, breakouts, failed breakouts, trend continuation, and reversals are all part of the same auction process rather than isolated chart patterns. For this reason, order flow trading places greater importance on the stage of the market’s negotiation than on memorising patterns alone.
Looking Beyond Candlesticks
Traditional charts provide a summary of what happened during a trading session. They show where price opened, closed, and how far it moved. However, they do not explain the sequence of events that created that move.
This is where order flow trading adds another layer of information. Rather than replacing price action, it complements it by revealing how buyers, sellers, and liquidity interacted before price changed. This additional context may explain what moves price instead of only showing the final result.
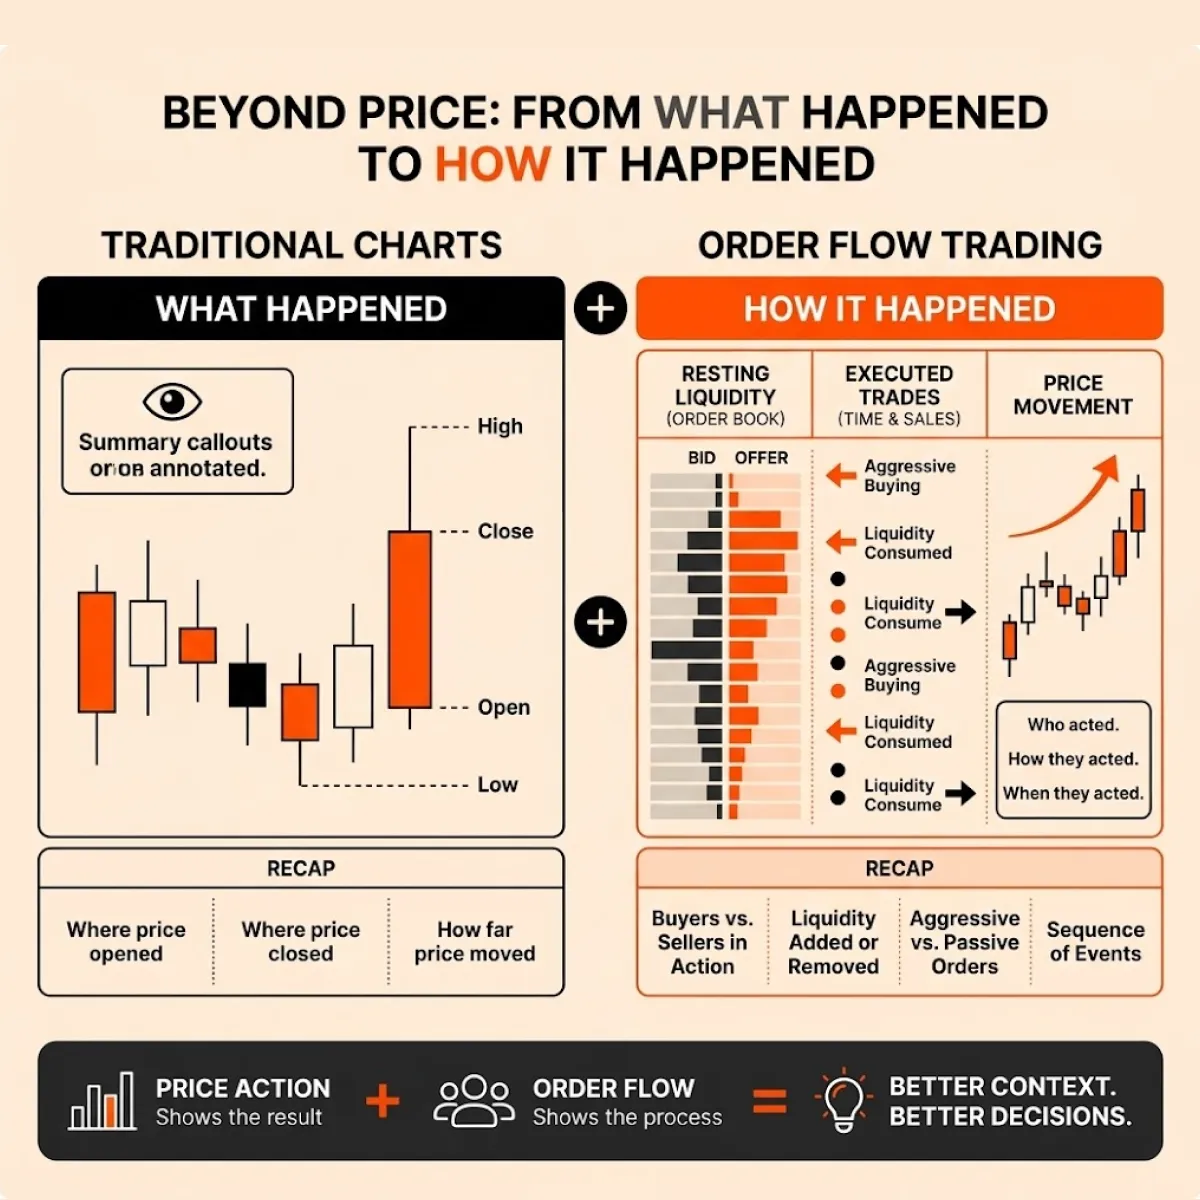
To understand better, let’s study some key order flow trading concepts:
- Resting Liquidity: Buy and sell limit orders waiting in the order book. These orders can slow, stop, or redirect price movement.
- Executed Volume: The number of trades that actually take place at each price level. This shows where buying and selling activity occurred.
- Aggressive Buying and Selling: Market participants using market orders to trade immediately against available liquidity, which can push price higher or lower
- Absorption: A situation where large limit orders repeatedly absorb aggressive buying or selling without allowing price to move significantly
- Iceberg Orders: Large institutional orders that reveal only a small portion of their total size while the remaining quantity stays hidden. This allows institutions to manage large positions without displaying their full intent.
Each concept reveals a different part of market microstructure. Together, they provide a broader view of how market participants interact and how liquidity trading influences price movement. As a result, candlesticks become one part of the market story rather than the entire story.
Seeing the Story Behind Every Move
Modern order flow trading platforms make it possible to observe market activity as it develops. They provide a better picture of the relationship between orders, liquidity, and price. Thus, nowadays traders are no longer required to rely only on “completed candles”.
For example, Bookmap displays resting liquidity, executed trades, and price movement on a single screen. Instead of showing only the final outcome, Bookmap reveals the sequence of events that produced it.
As a result, market analysis can extend beyond a simple question such as: Where did price move? It can now also include questions such as:
- What caused the move?
- Was liquidity supporting the move or resisting it?
- Were buyers or sellers acting aggressively?
- Was aggressive buying or selling absorbed?
- Did participation increase or decline as price moved?
These questions provide additional context that traditional charts cannot offer. Therefore, order flow trading is not about replacing price action. Instead, it adds another layer of information that helps explain what moves price. Therefore, as per general market understanding, price shows the outcome, while order flow reveals the market activity that created it.
Conclusion
Price will always remain one of the most valuable sources of market information. However, it only represents the final outcome of a much larger process. Behind every candlestick is a continuous interaction between buyers, sellers, liquidity, and different market participants.
These interactions determine what moves price, while the chart simply records the result. This is why order flow trading adds valuable context to traditional price analysis. Rather than replacing candlesticks, it explains the market activity that produced them.
As a result, traders can look beyond the final price move and evaluate the strength of buying, selling, and liquidity behind it. In the end, price shows what happened, but market microstructure and order flow trading explain why it happened.
Together, they provide a more complete view of market behavior. Go beyond price charts and see what is actually driving market movement with Bookmap.
FAQs
1. Why isn’t price enough to understand the market?
Price shows where trades happened, but it does not explain why they happened. Traders may note that every price move is created by buyers, sellers, and available liquidity interacting with each other.
Furthermore, a candlestick only shows the final result, while order flow reveals the trading activity that led to that result. Together, they provide a more complete view of market behavior.
2. What actually causes price to move?
Price moves when buy and sell orders are not balanced.
- If aggressive buyers consume the available sell orders, price rises until new sellers appear.
- Likewise, if aggressive sellers consume the available buy orders, price falls until new buyers step in.
In this way, every price change reflects this ongoing interaction between orders and liquidity.
3. Can two identical candlestick patterns mean different things?
Yes, two candles may look exactly the same but can form for very different reasons. One may result from strong institutional buying, while another may be caused by short covering, low liquidity, or a stop run.
Since candlesticks only show the outcome, they cannot explain what created the move.
4. What is the difference between price action and order flow?
Price action studies the movement of price after it has already happened. Order flow looks at the buying, selling, executed trades, and liquidity that caused that movement.
Thus, price action only shows the result, whereas order flow explains the process behind the result and gives “additional context” to market behavior.
5. How does Bookmap help traders understand what moves price?
Bookmap combines price, liquidity, and executed trades on a single screen. Using it, traders can observe:
- Where large orders are waiting
- Where trades are taking place
- How buyers and sellers are interacting in real time
Answers to these questions provide an additional layer of information, and it becomes easier to see what is driving a price move.
Sign Up Now
Latest Articles