


See how trends develop from beginning to end.
Compare plans to track liquidity, participation, and momentum as market conditions change.
Education
August 25, 2026
The Life Cycle of a Trend: How Trends Actually Begin, Mature, and End
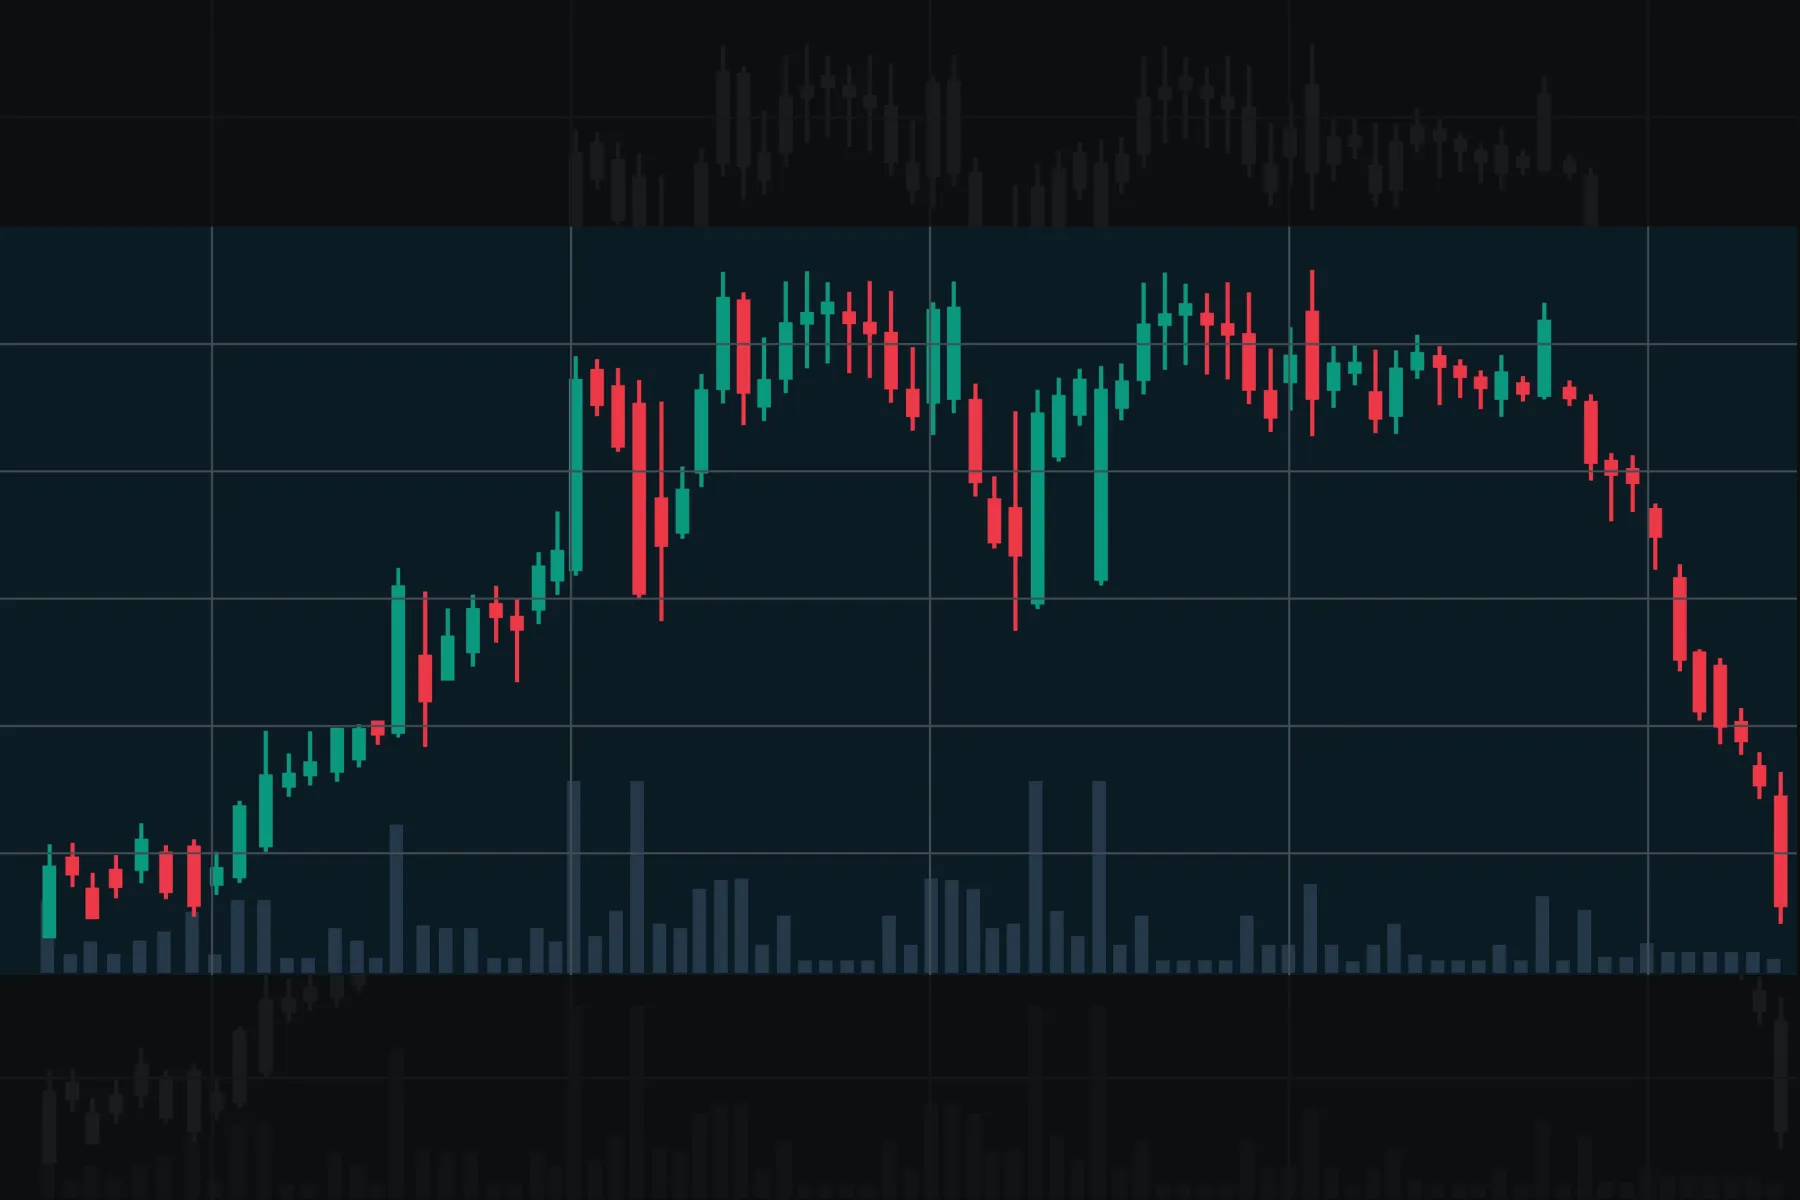
Successful trend trading is not about predicting where price will go next. It is about recognizing why the market is moving in the first place. Every trend begins with a shift in the balance between buyers and sellers. Next, the trend develops as participation, liquidity, and order flow continue changing.
However, not every strong trend lasts forever. As market conditions evolve, the quality of price movement changes long before a reversal becomes obvious on a chart. Therefore, analyzing the entire lifecycle of a trend provides far more insight than simply identifying an uptrend or downtrend.
Read this article to learn how trends form, expand, mature, and eventually lose momentum. Also, understand the role of liquidity, order flow, market participation, and trend exhaustion.
Every Trend Starts With an Imbalance
A market trend begins when the balance between buyers and sellers changes. At first, one side starts placing stronger or more aggressive orders than the other. As a result, price begins to move in that direction. This marks the beginning of the “trend lifecycle”.
However, as per general market observation, market trends do not start because every participant agrees on the same direction at the same time. Instead, trends usually develop as buying or selling pressure gradually increases. Let’s check out the various potential reasons that may contribute to the formation of a trend:
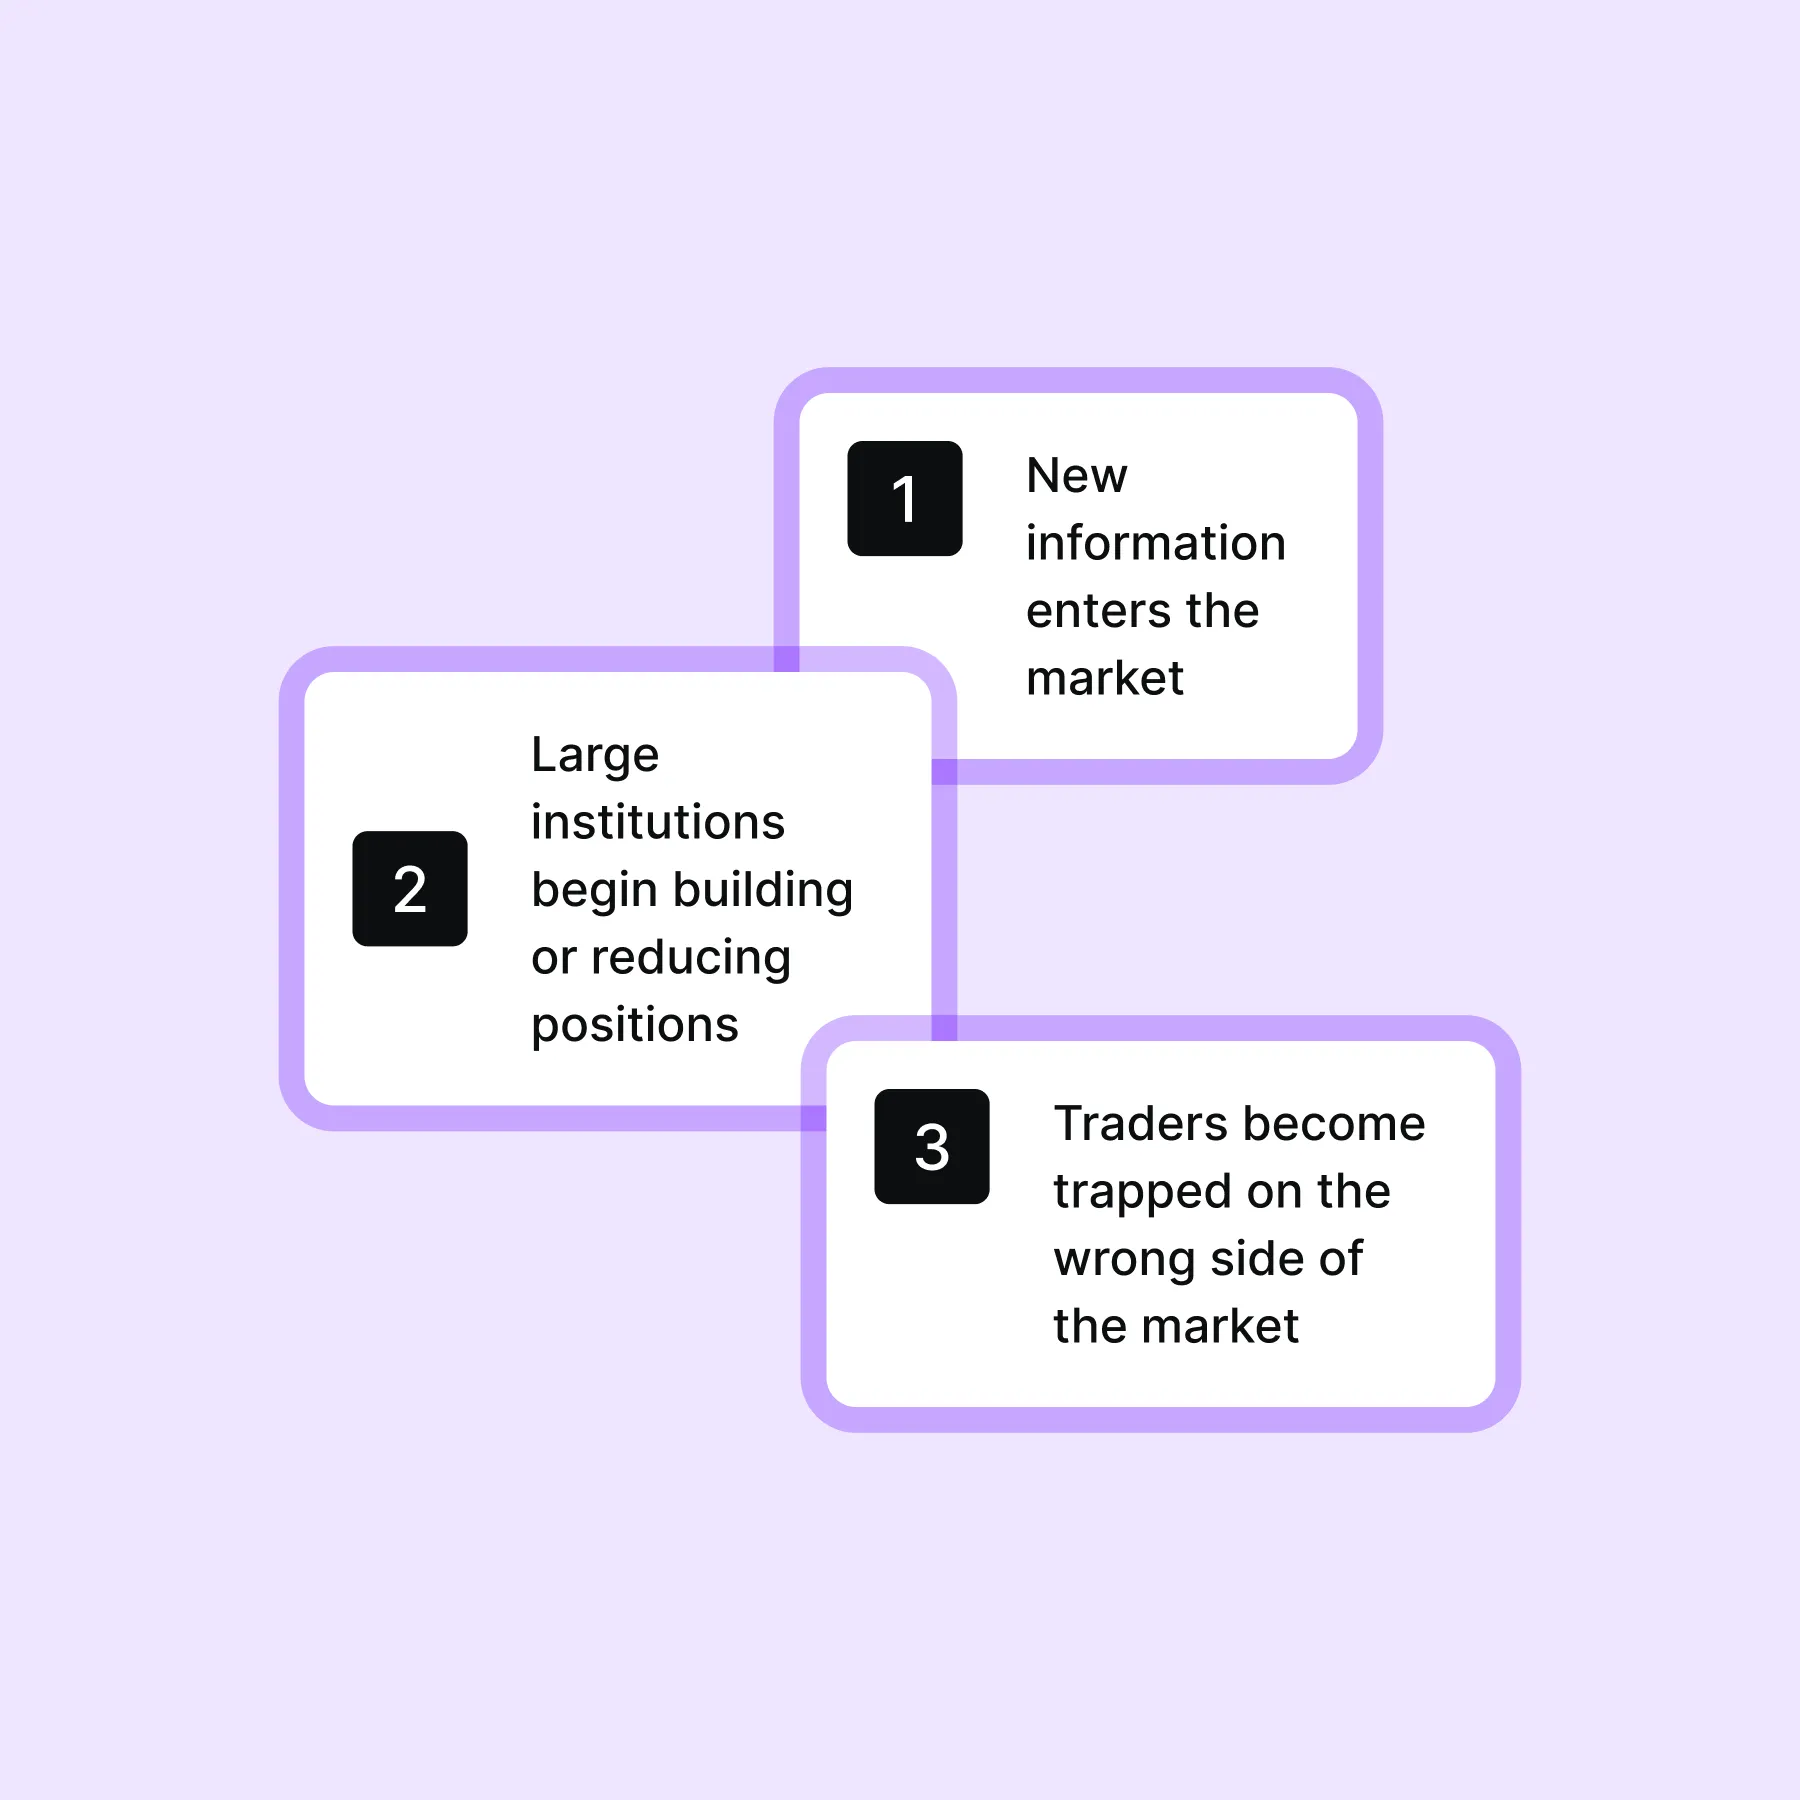
Consequently, price starts moving as the stronger side gains control. During the early stage, the direction is usually “unclear”. In such market phases, price may:
- Continue moving back and forth
- Produce frequent pullbacks, or
- Revisit earlier price levels before a sustained move develops
As buying or selling pressure continues, the market gradually shows stronger directional conviction, which supports trend continuation.
What Creates the Initial Shift?
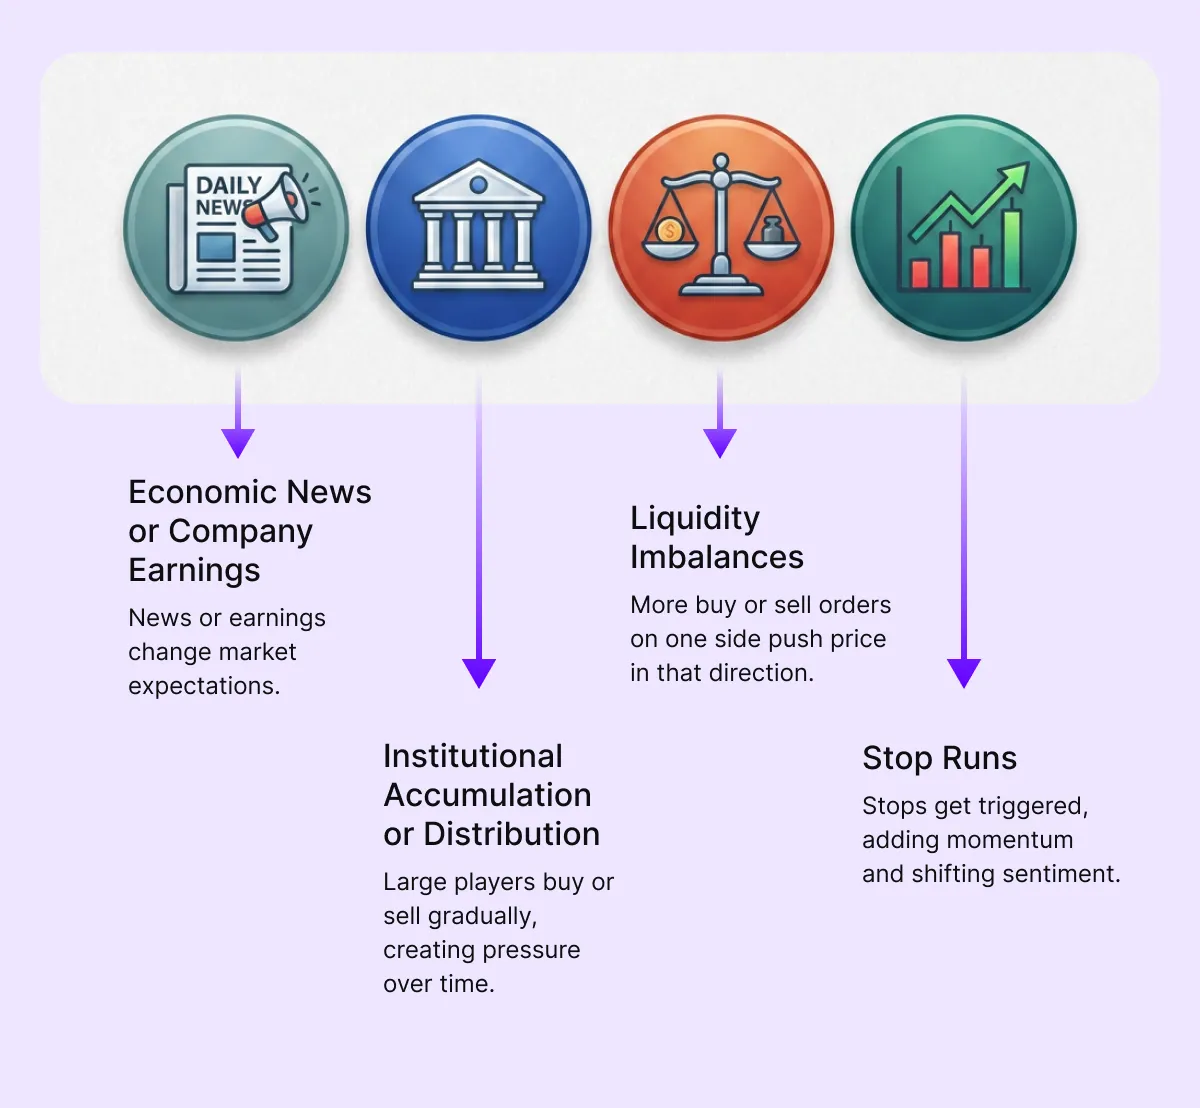
Several factors can trigger the beginning of a trend. Economic news or company earnings may change market expectations. Likewise, institutional accumulation or distribution can create buying or selling pressure over time. In addition, liquidity imbalances and stop runs can also change the overall market sentiment and contribute to the formation of a new trend.
However, the event itself is not the most important factor. Instead, the real driver is how market participants respond to that event. When one side continues to dominate order activity, order flow trends become more visible. This event allows the market to transition from balance into a “sustained directional” move.
The Expansion Phase: When Participation Builds
After the initial imbalance, more market participants begin trading in the same direction. Early traders who entered near the start of the move usually remain in their positions. Besides, at this time:
- Momentum traders also join as the price continues moving.
- Institutions may continue adding to their positions.
Both market participants strengthen the existing market trends. As participation increases, price may move with greater consistency. Therefore, this stage usually represents the strongest part of the trend lifecycle, during which the price direction becomes more established.
This forms the foundation of a “trend trading” strategy. In this phase, the market reflects sustained buying or selling interest instead of short-lived price spikes. Additionally, healthy trends also show broad participation across different groups of market participants rather than isolated bursts of buying or selling.
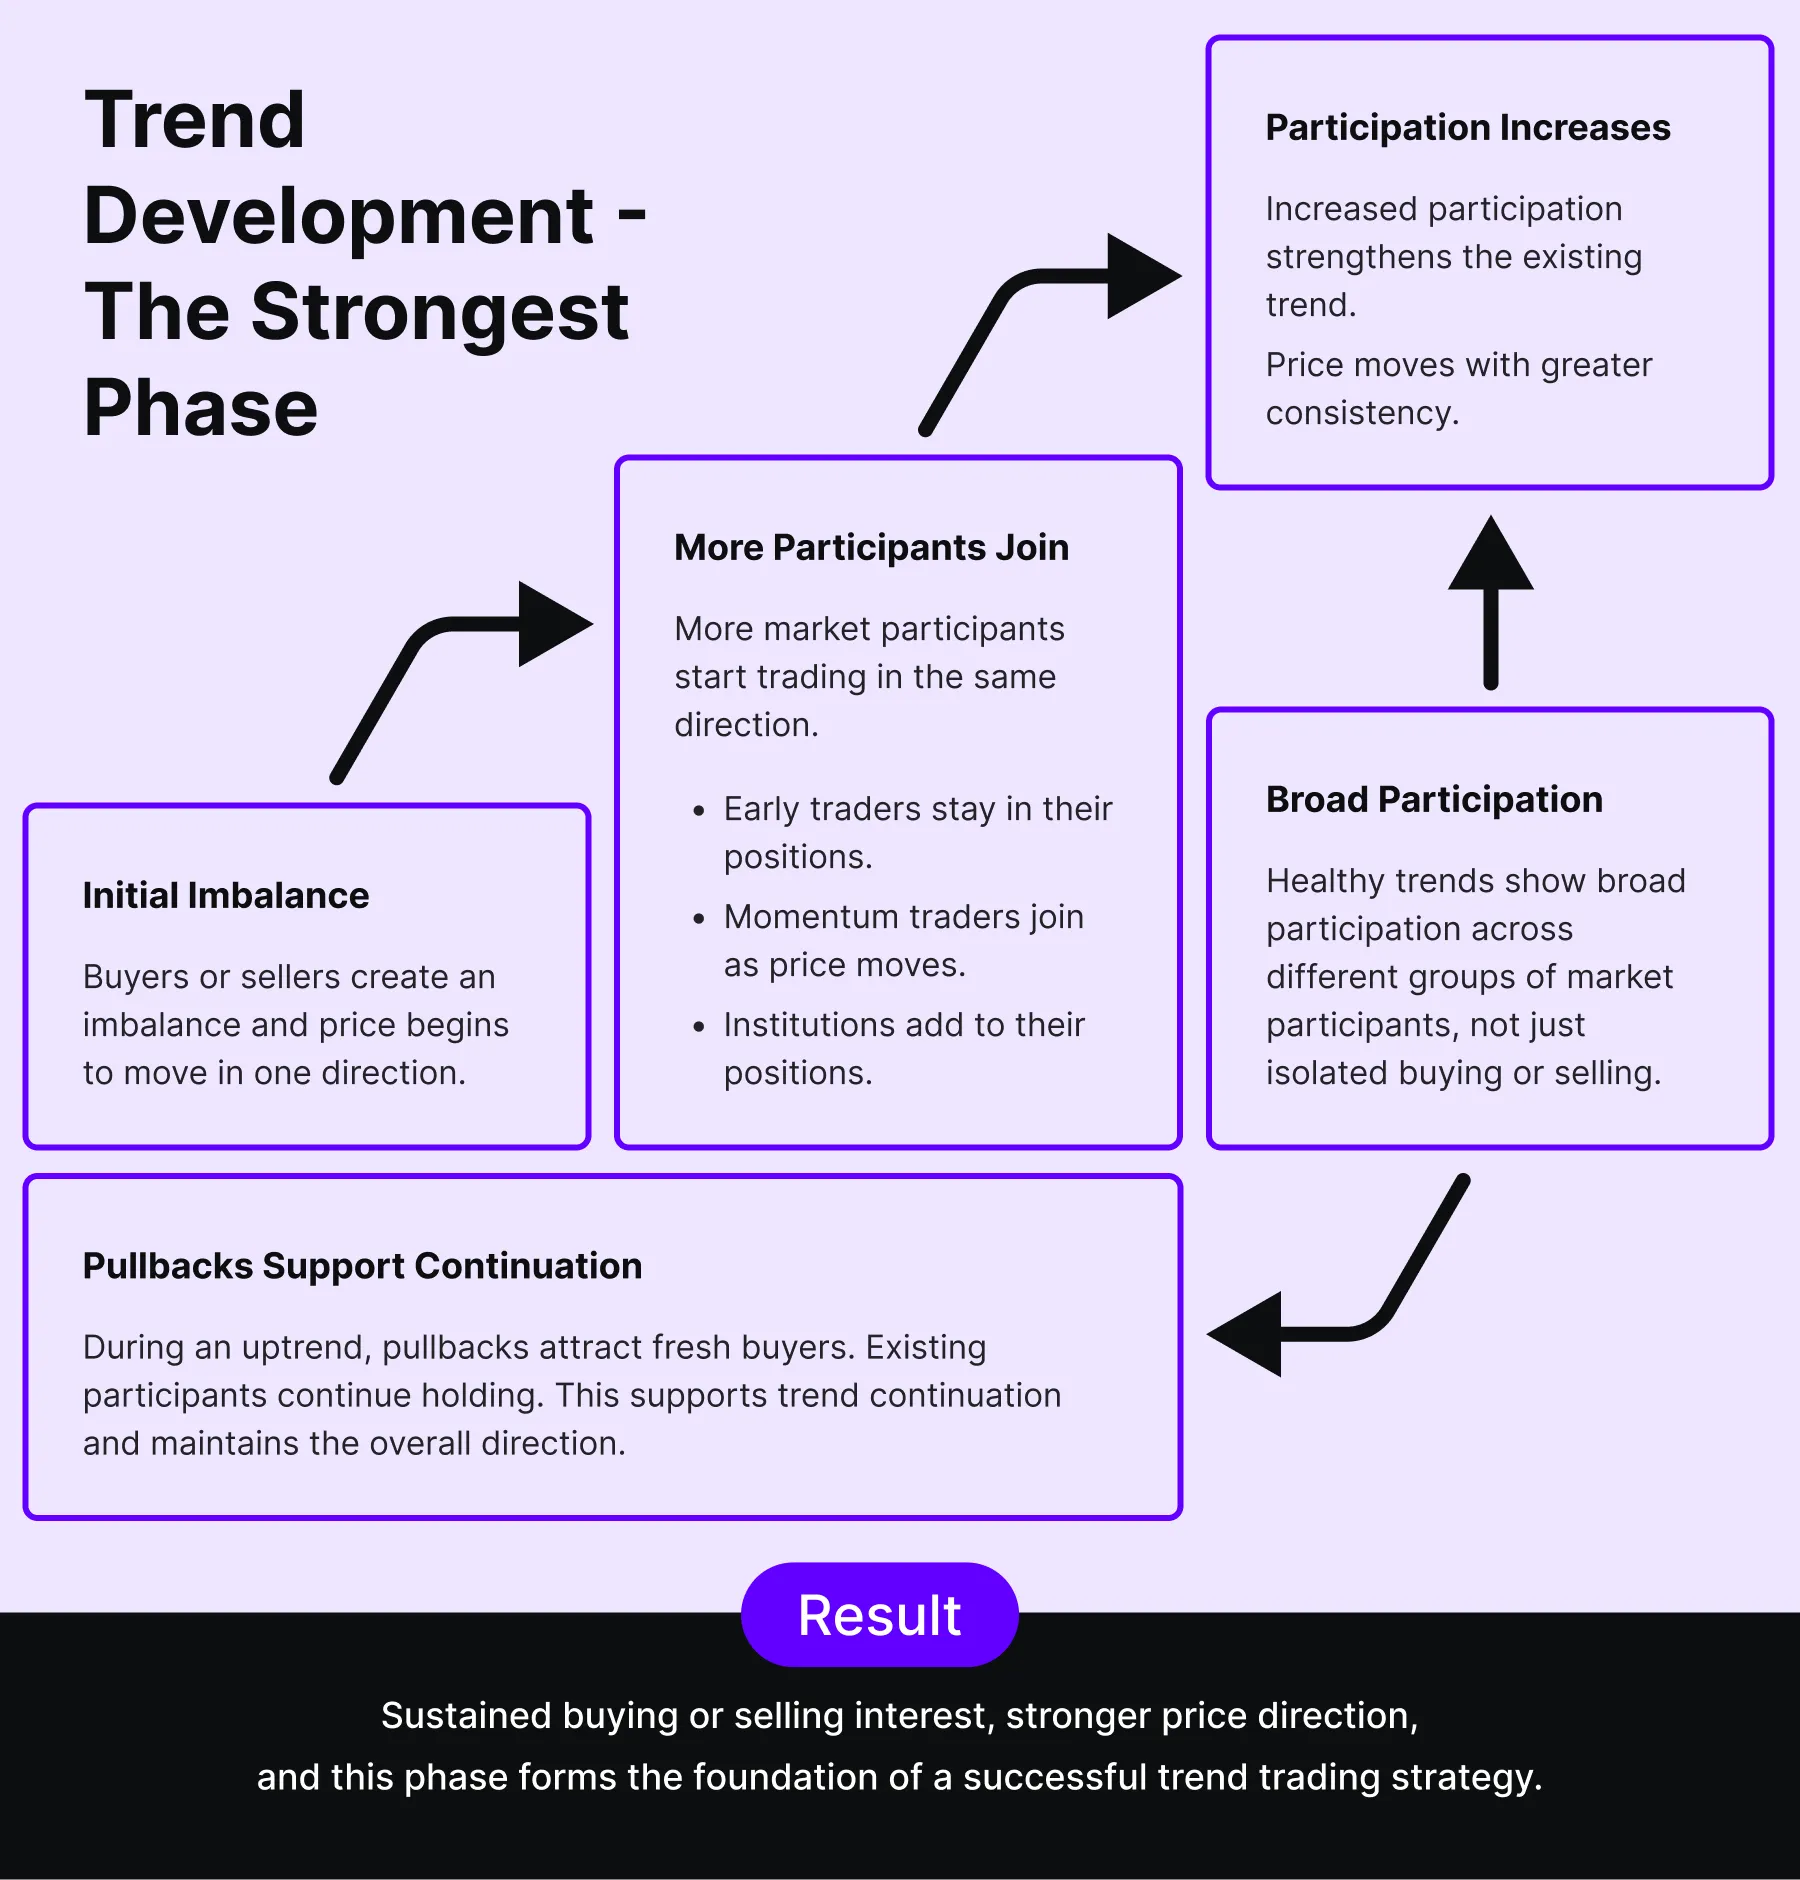
Consequently, pullbacks during an “uptrend” attract fresh buyers while existing participants continue holding their positions. This combination supports trend continuation and maintains the direction until buying or selling pressure begins to weaken.
Characteristics of a Healthy Trend
A healthy trend shows price movement in one direction instead of sudden and unpredictable swings. Although price may pause or pull back from time to time, the overall direction remains intact. This type of movement reflects stable participation and supports the existing market structure trends.
As the trend develops, more buyers or sellers continue entering the market instead of leaving it. At the same time, liquidity is replenished as the price moves. Such a replenishment allows new orders to be filled without disrupting the overall direction. This steady flow of activity supports trend continuation.
For example, if we talk about an uptrend, buyers usually remain aggressive even after temporary pauses. Therefore, pullbacks usually find support in these phases before causing significant damage to the market structure. Consequently, the broader trend remains intact despite short-term price declines.
However, healthy trends do not move in a straight line. Periods of consolidation are a normal part of the trend lifecycle because they allow new participants to enter while earlier participants continue holding their positions. Consequently, these pauses strengthen the trend instead of signalling that it has ended.
When a Trend Becomes Mature
No trend continues expanding forever. As the trend lifecycle progresses, the behavior of market participants gradually changes. Early participants usually begin protecting profits, while late participants enter after seeing the established price move. As a result, the balance between buyers and sellers starts shifting.
Even at this stage, price may continue making new highs in an uptrend or new lows in a downtrend. However, the quality of those moves may begin to weaken beneath the surface. Therefore, a market reaching new price levels does not always mean the underlying trend remains equally strong.
For this reason, trend trading is not only about identifying the direction of price. It also involves evaluating whether the strength behind the move remains healthy or is beginning to fade.
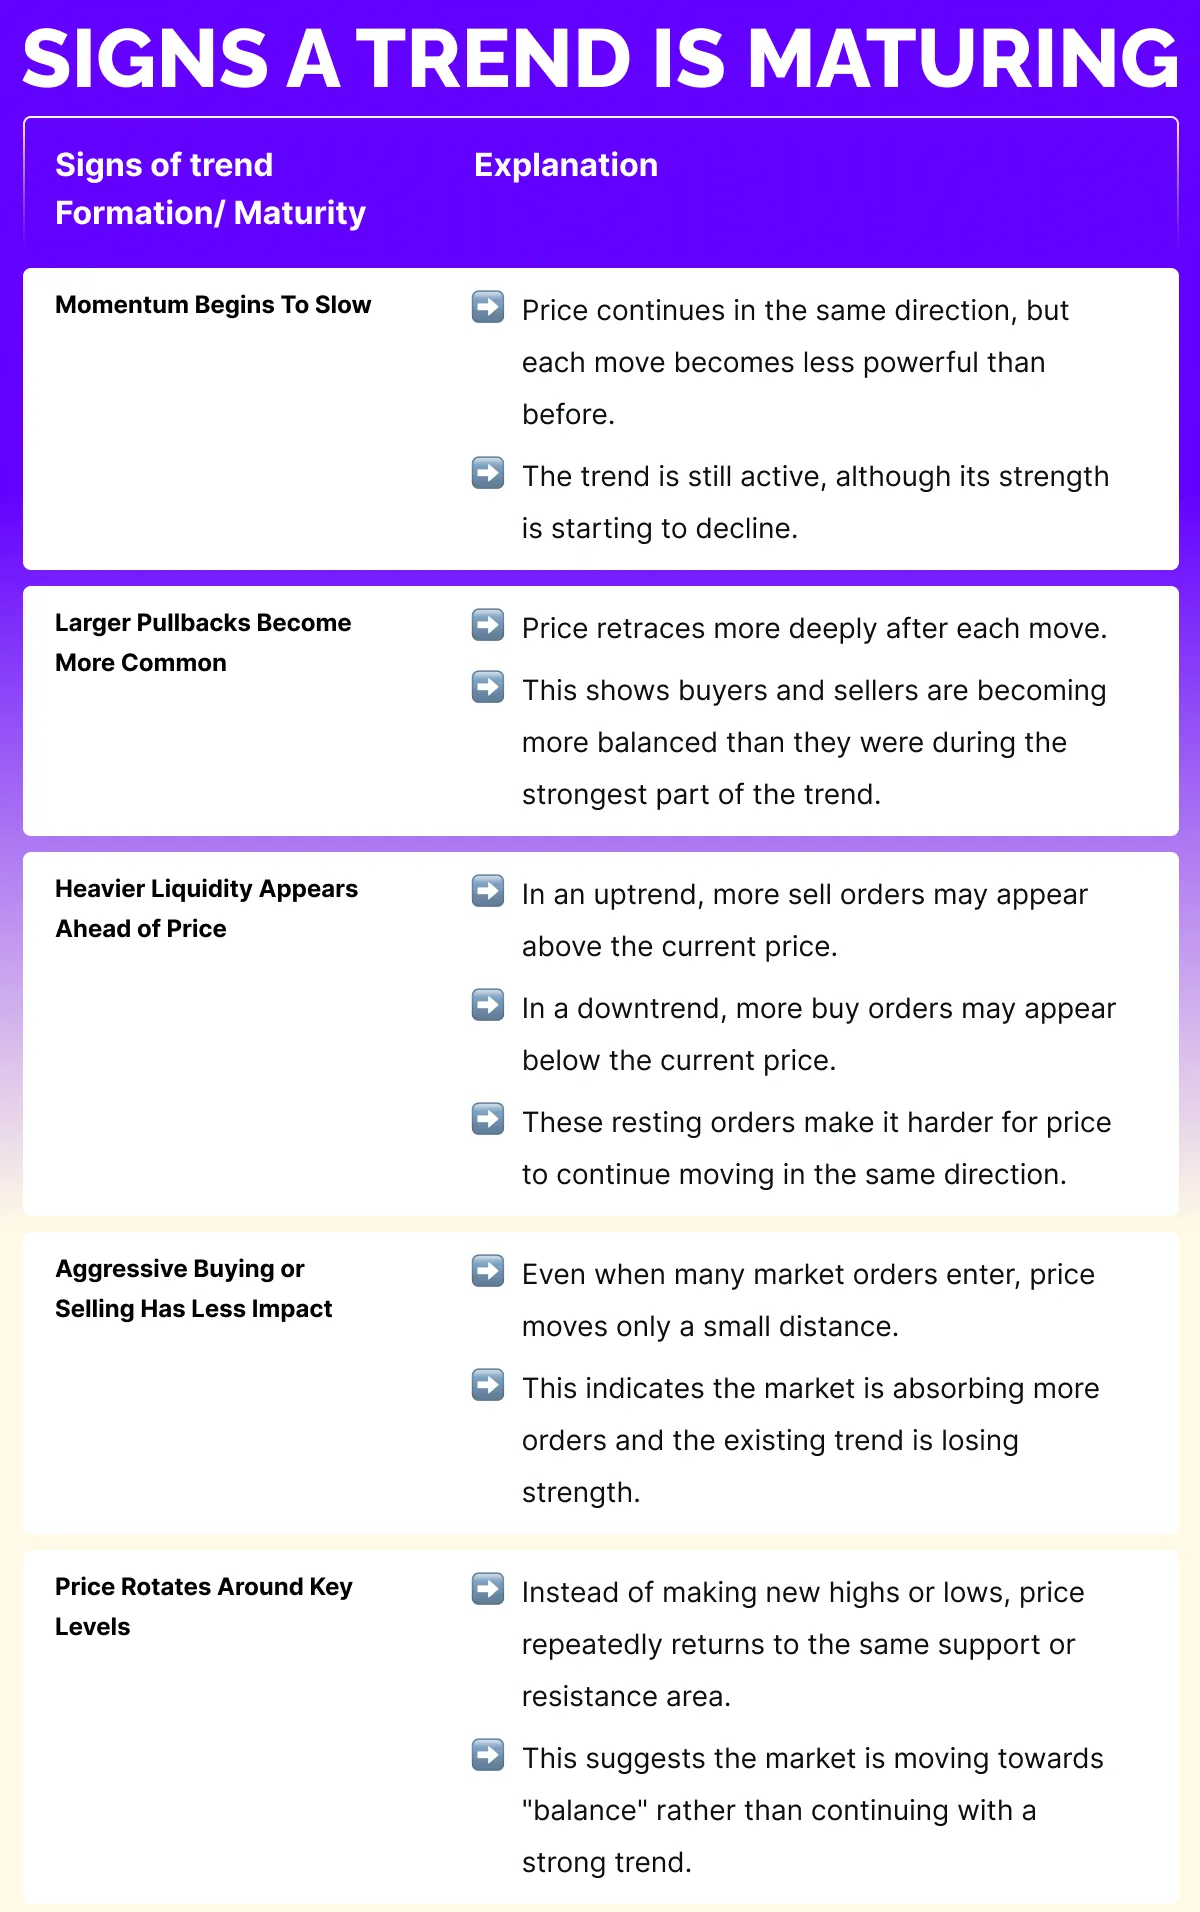
However, these signs do not always mean an immediate reversal is about to occur. Instead, they only show that the trend is losing strength. In many cases, “trend exhaustion” begins with declining efficiency. In such market phases, greater buying or selling pressure produces less directional progress before the market eventually changes direction.
Understanding a trend starts with understanding the market participants driving it.
Trend Exhaustion Doesn’t Always Mean Reversal
One of the most common misconceptions in trend trading is that every exhausted trend immediately reverses. In reality, trend exhaustion only indicates that the existing trend is losing strength. It does not confirm that the market is about to move in the opposite direction.
Instead, the market may enter a period of consolidation, balance, or sideways movement as buyers and sellers search for a new price level where supply and demand become balanced again. Therefore, a slowing trend should not automatically be treated as the beginning of a reversal.
For traders, this distinction is important because price usually pauses before making its next major move. In many cases, the market spends time building a new balance before either continuing the existing trend or starting a new one.
What Exhaustion Looks Like
Several changes may indicate that trend exhaustion is developing.
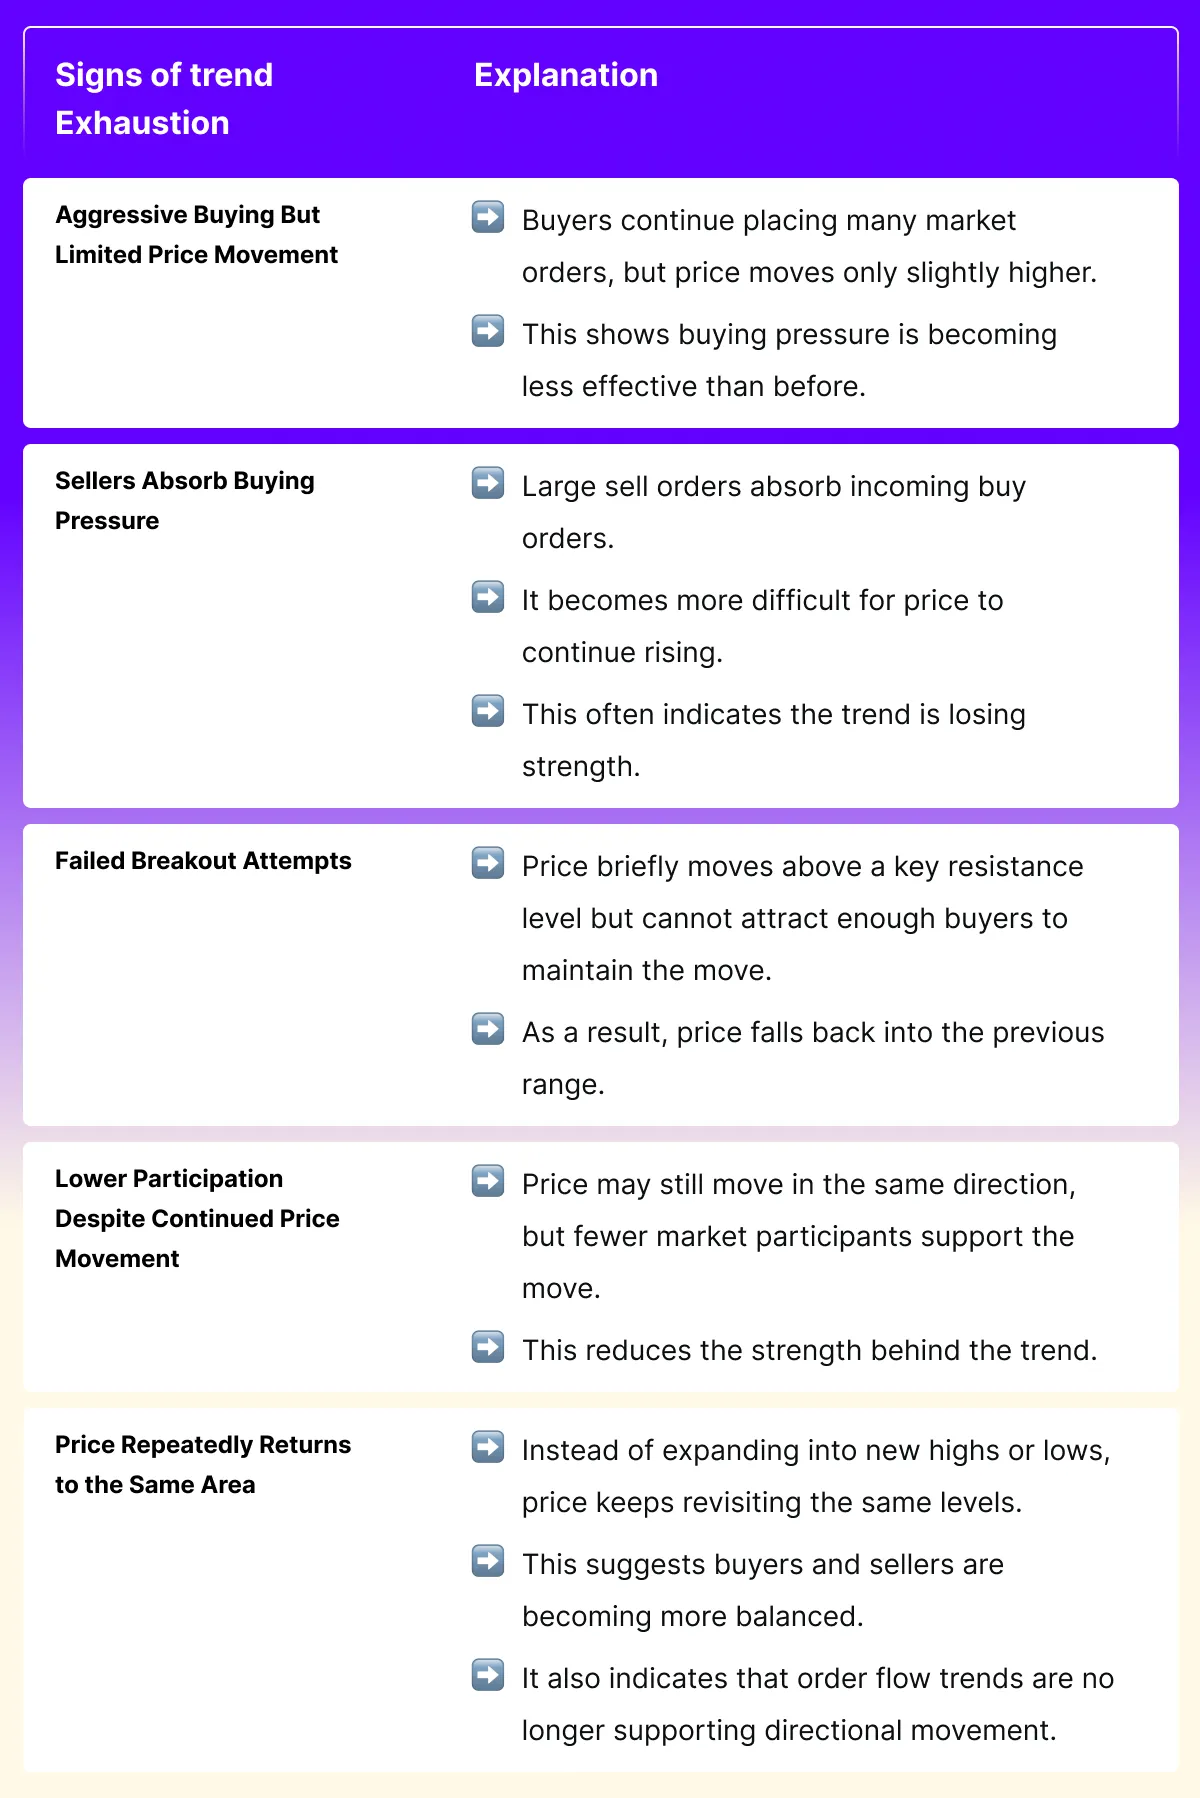
However, these conditions indicate weakening momentum rather than confirming an immediate reversal.
Understanding the Role of Liquidity Throughout the Trend
As per general industry understanding, liquidity changes as a trend develops. These changes usually reveal how market trends are evolving beneath the surface. While price shows the direction of the move, liquidity may explain the strength behind that movement.
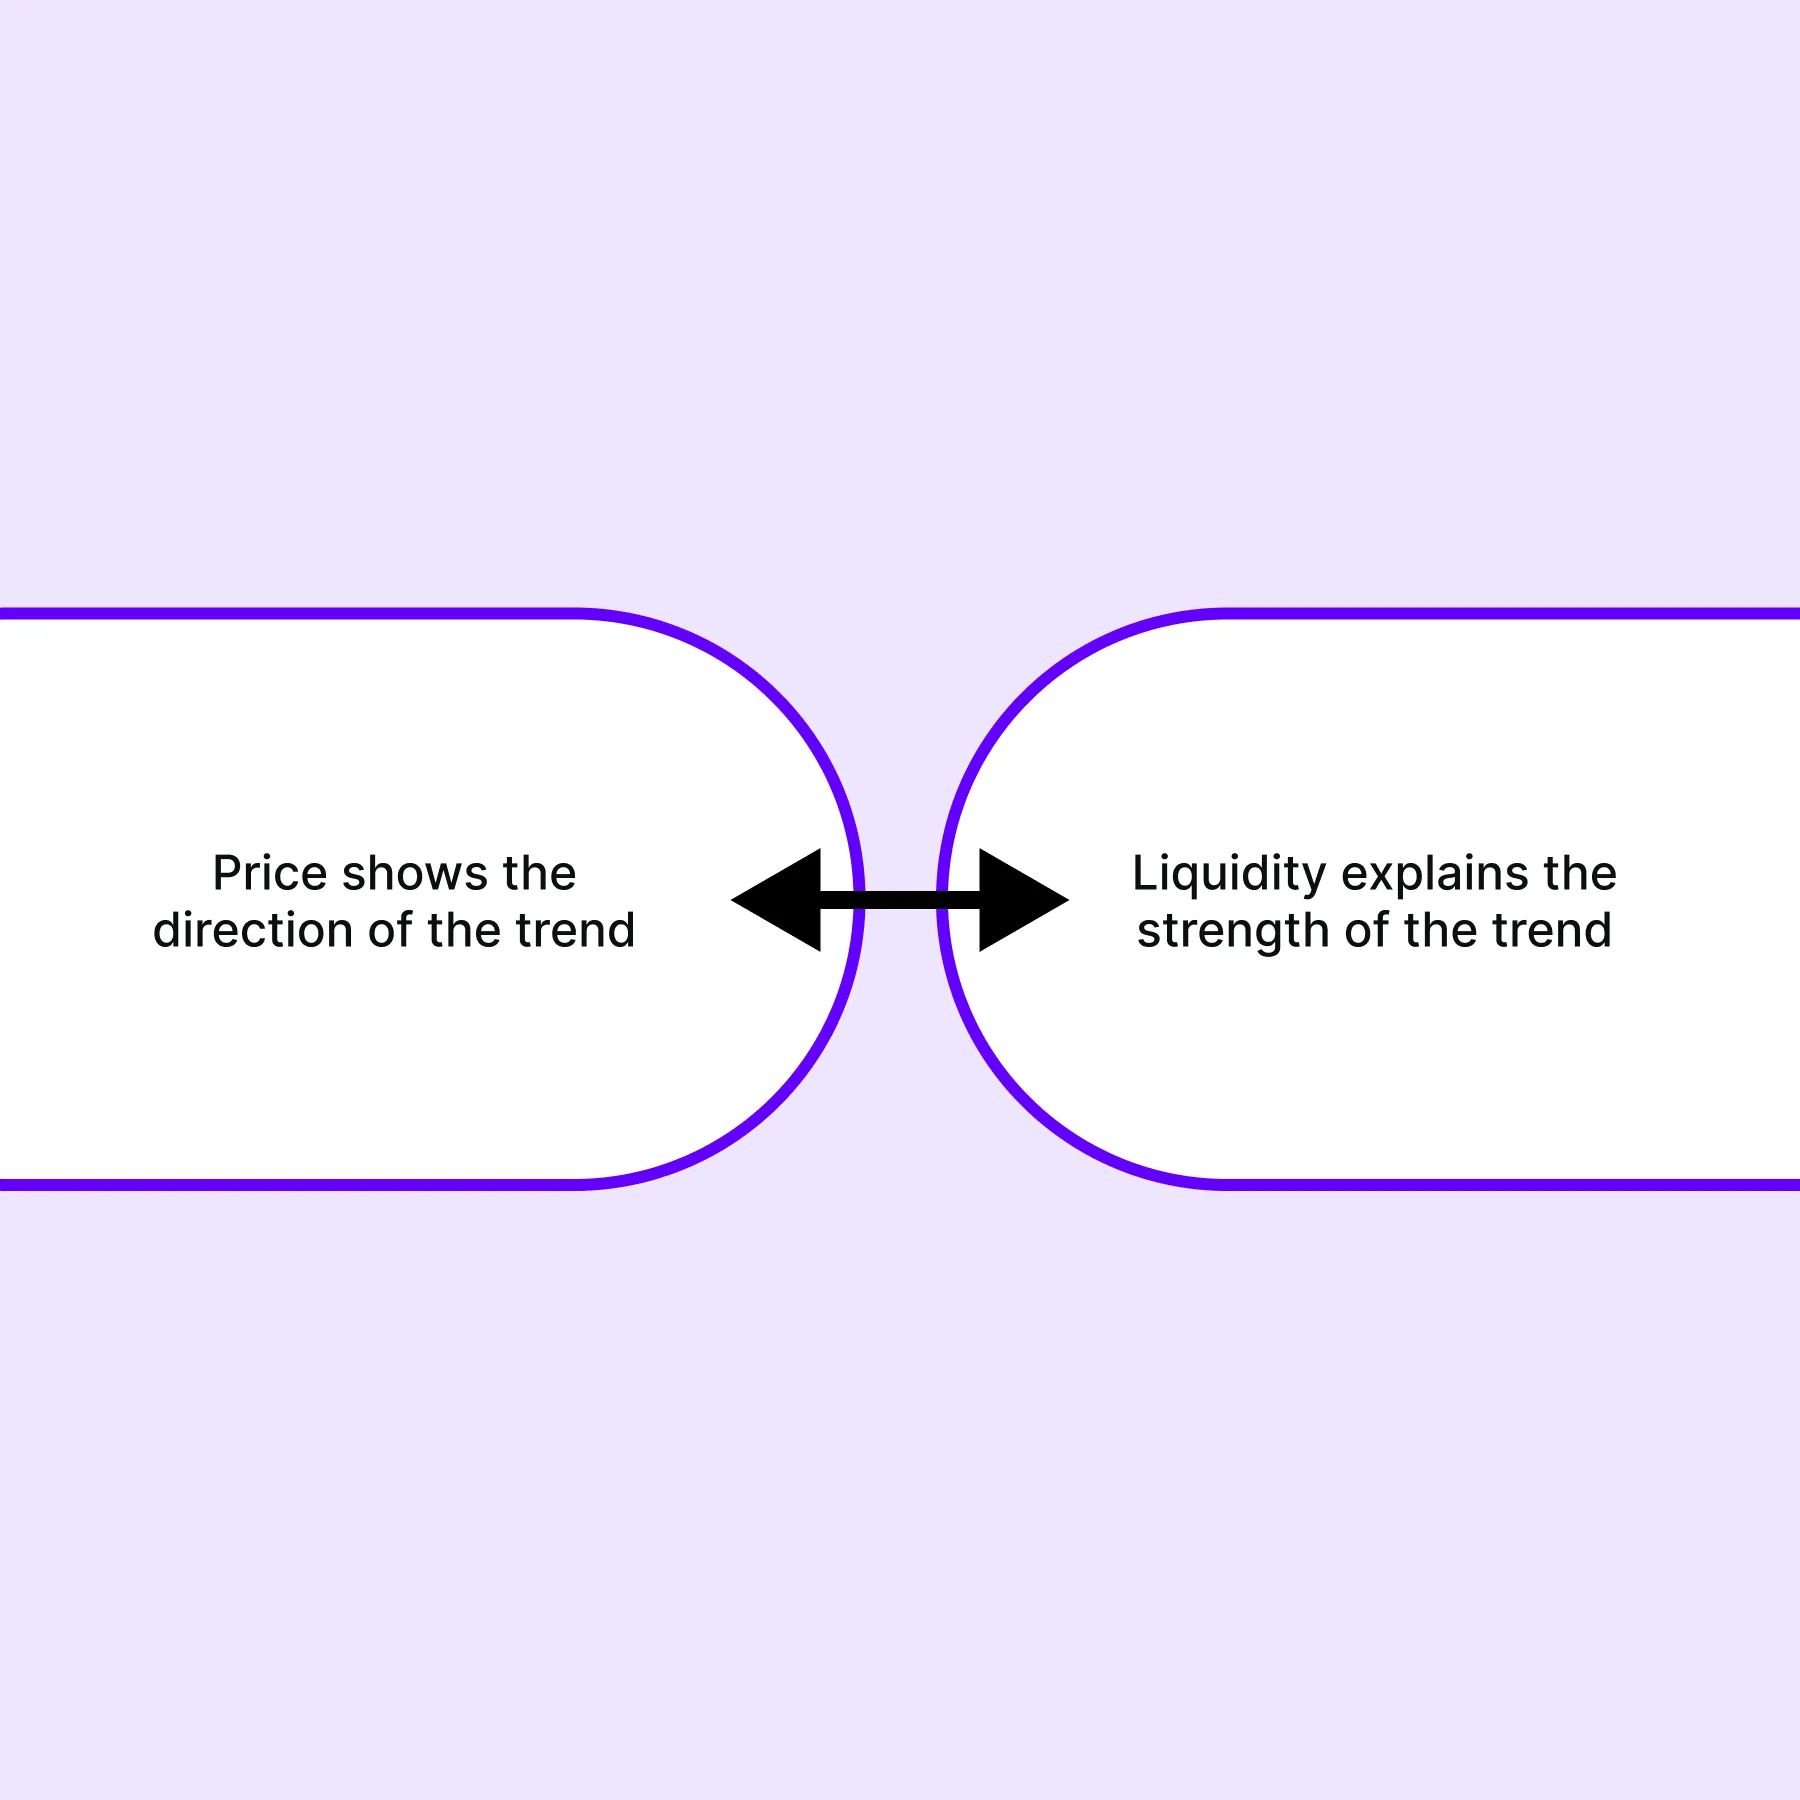
Therefore, several traders analyze both together to get a better view of the market. It is worth mentioning that during the early stage of the trend lifecycle, liquidity may be relatively thin. This happens because the market is still searching for direction. As buyers and sellers compete for control, price may move unevenly until an imbalance develops.
Later, once the trend enters its “expansion phase”, liquidity is both consumed and replenished as more participants enter the market. In this phase, new buy and sell orders continue replacing completed trades. This replacement allows the price to maintain its direction. This steady flow of orders supports trend continuation.
What Happens as The Trend Matures?
Post-continuation, the trend may become mature. In this phase, liquidity begins changing again, and larger resting orders may appear. This usually happens as early participants take profits. At the same time, other traders try to establish positions against the existing trend.
Consequently, price may require more buying or selling pressure to continue moving in the same direction, which can signal the early stages of trend exhaustion.
Additionally, market participants can also observe a “liquidity flip” in many lower-timeframe uptrends. In these phases, bid-side liquidity may become stronger, and fewer sell orders remain above the market. As a result, price may continue chasing higher levels because the offer side contains relatively less liquidity.
Although this pattern does not appear in every trend, it is a common feature of healthy order flow trends and provides additional context that price movement alone cannot reveal.
Reading Liquidity Through the Trend Lifecycle
Liquidity changes throughout the trend lifecycle, and each phase reveals different market conditions. Therefore, observing how liquidity behaves alongside price provides additional context about the strength of the existing trend. Let’s understand better through two different scenarios:
| Scenario I: Liquidity Pulling | Scenario II: Price Consolidation |
|
|
Gradually, as the trend becomes mature, absorption may develop near important highs or lows. In this phase, large resting orders may absorb aggressive buying or selling. This can make further price advances more difficult. At the same time, thick liquidity can slow directional movement because greater order flow is required to move through those levels.
In addition, some key price areas may be defended repeatedly by resting orders. When this occurs, price reacts at the same levels several times before a decisive move develops. These changing conditions highlight that liquidity is not fixed. Instead, it evolves alongside market structure trends.
Watch liquidity, volume, and participation evolve throughout every stage of a trend.
Seeing Trend Development Beyond Candlesticks
Traditional candlestick charts show the final result of buying and selling activity. They reveal where price opened, closed, and moved during a given period. However, they do not show how that movement developed while trades were taking place.
For those unaware, order flow tools provide a deeper view of the market by displaying the following in real-time as the trend unfolds:
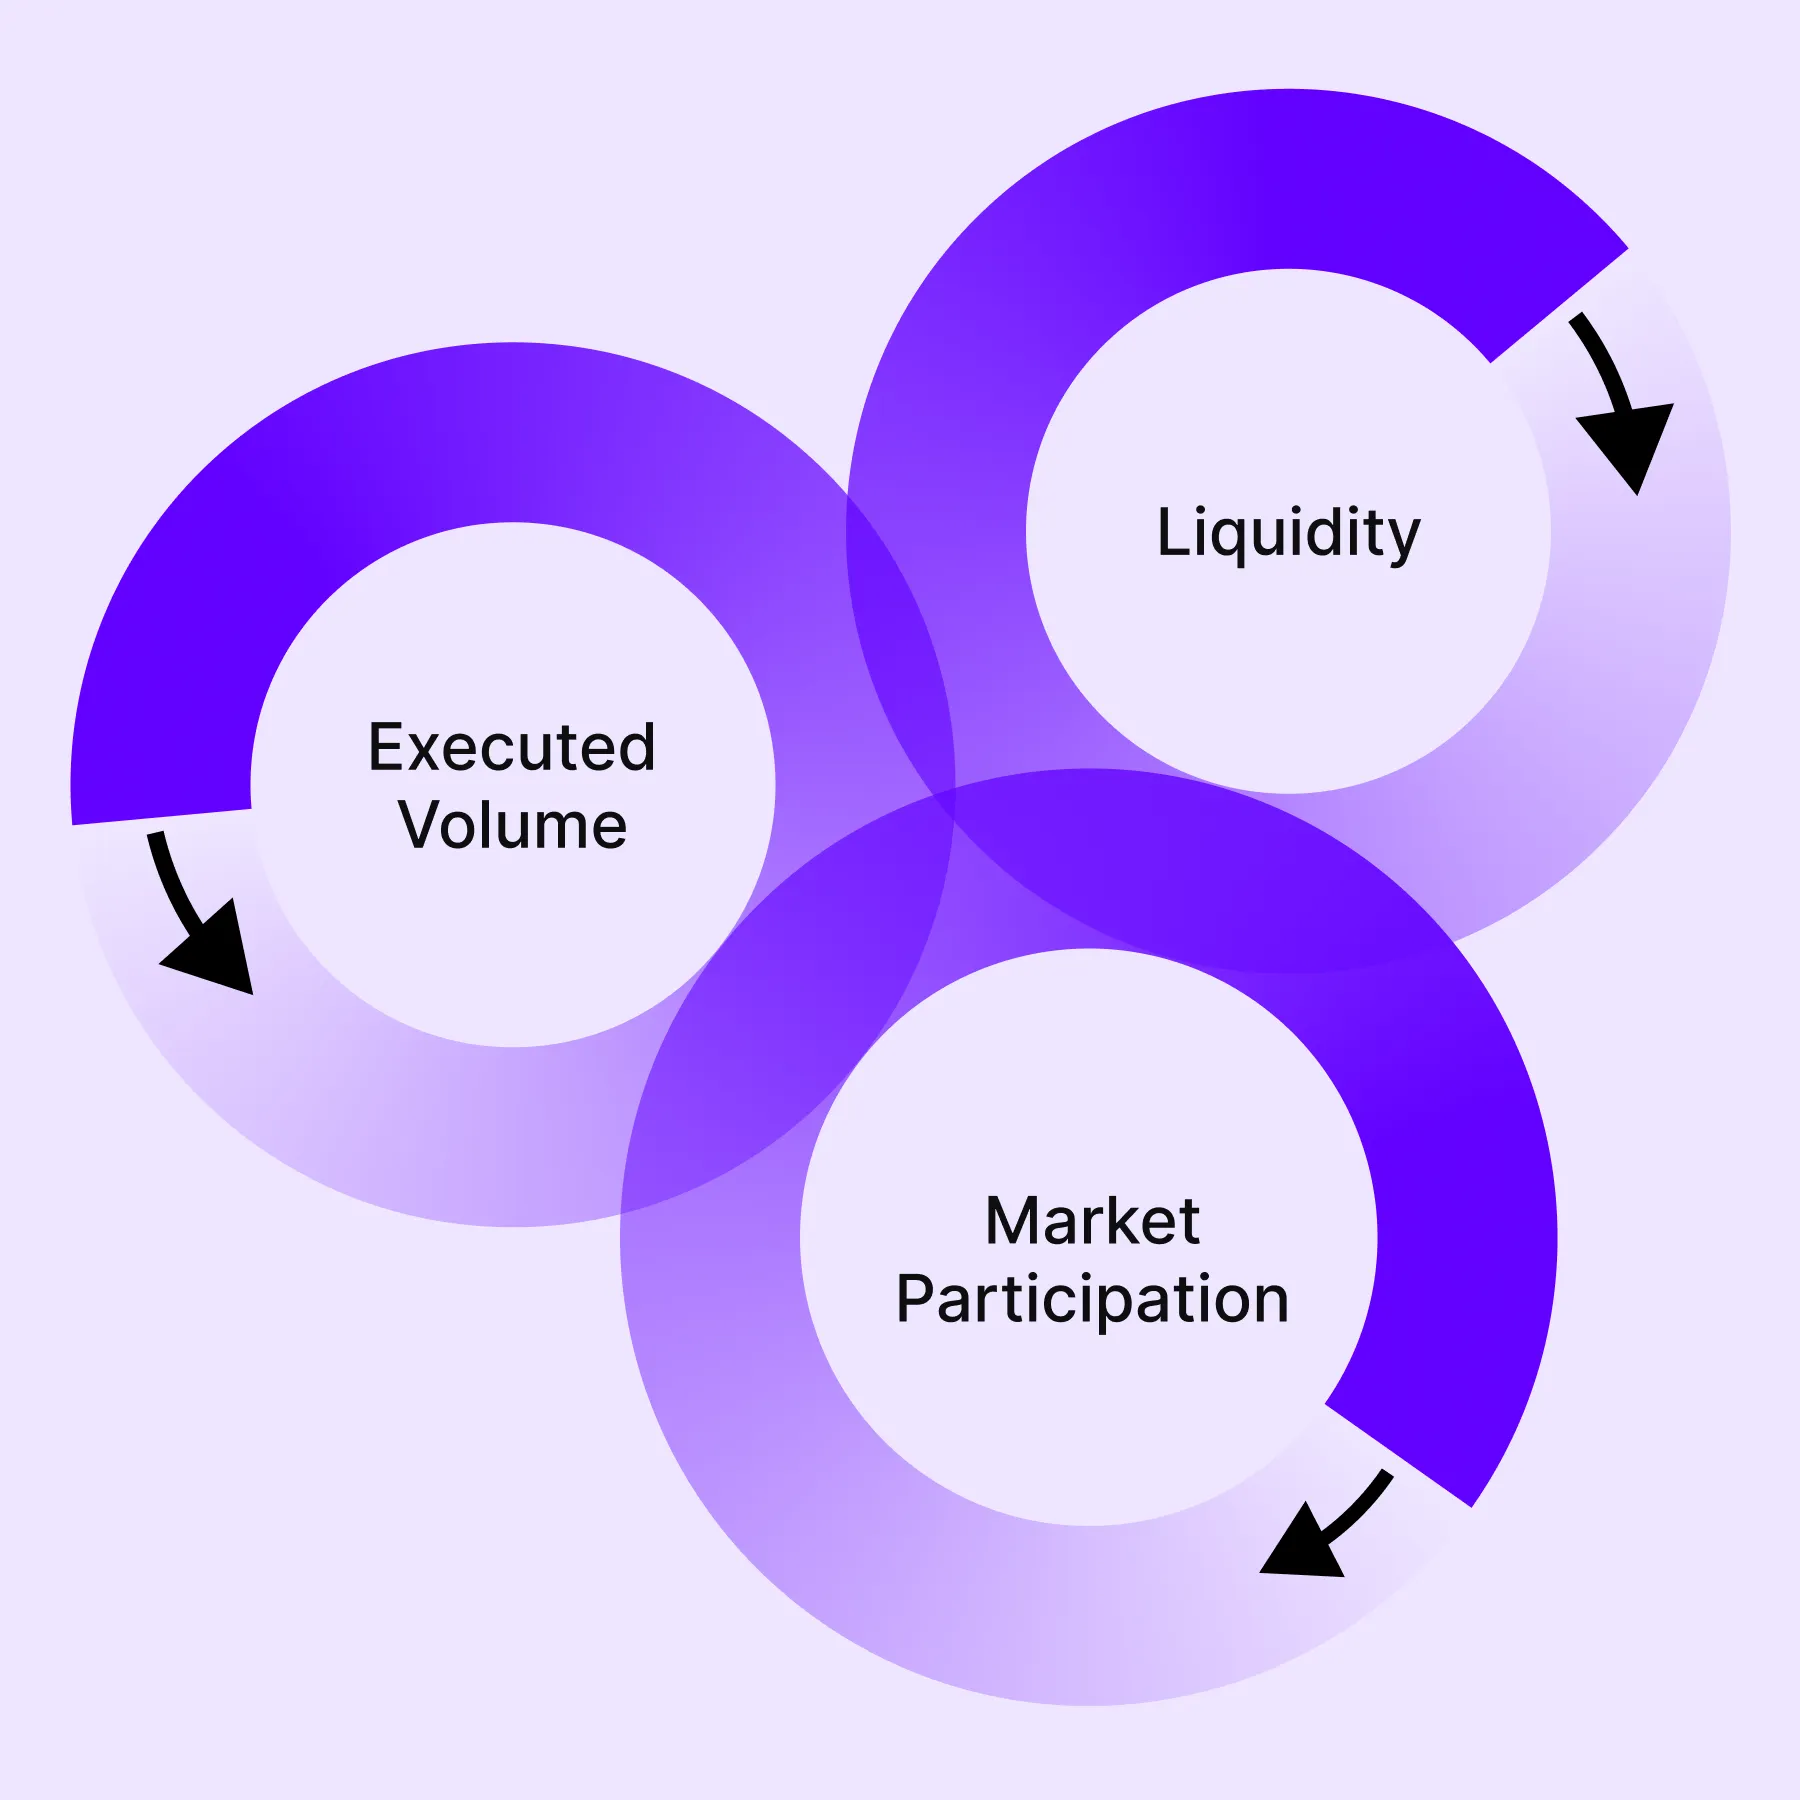
As a result, they help explain whether market trends are strengthening, weakening, or moving into a balanced phase. This additional information makes it easier to evaluate the condition of the trend lifecycle. For example,
- Rising participation may support trend continuation.
- Whereas declining participation can indicate that the existing move is losing strength.
- Likewise, liquidity may either support further price movement or begin slowing it.
- At the same time, signs of buyer or seller exhaustion, along with increasing absorption, may indicate that the market is entering the early stages of trend exhaustion.
Besides, order flow analysis also helps determine whether the market is still discovering new value through directional movement or beginning to trade within a balanced range. These observations provide context that completed candlesticks alone cannot offer.
Bookmap naturally supports this analysis by displaying liquidity, executed trades, and order flow trends in real time. Instead of relying only on completed candles, Bookmap allows market participants to observe how buying and selling pressure changes as the trend develops.
Conclusion
Every trend follows a natural path. It begins with an imbalance and grows as more market participants join. Then it reaches a mature stage, and eventually transitions into consolidation, reversal, or a new trend.
Therefore, trend trading is not only about identifying whether price is rising or falling. It is also about recognizing where the market sits within the trend lifecycle. As participation, liquidity, and order flow trends change, the quality of the trend also changes.
Usually, a strong trend supports trend continuation, while weaker participation and increasing trend exhaustion may signal that market conditions are changing. Traders observing these changes alongside market structure trends may get a broader view of price behaviour and can evaluate trends with greater context (instead of relying only on candlestick patterns or price direction). See how trends develop beneath the surface with Bookmap’s real-time order flow visualization.
FAQs
1. How does a market trend begin?
A market trend begins when buyers or sellers gradually gain more control than the opposite side. This creates an imbalance between supply and demand, causing price to move in one direction. At first, the move may appear uncertain.
However, as more market participants trade in the same direction, the trend becomes stronger and more established.
2. How can you tell if a trend is healthy?
A healthy trend usually moves in one direction while producing controlled pullbacks instead of sharp and unpredictable swings. More buyers or sellers continue supporting the move, and price resumes its direction after temporary pauses.
Generally, this behavior shows that the trend still has broad market participation and has not started losing strength.
3. Does trend exhaustion always lead to a reversal?
No, trend exhaustion only means the existing trend is becoming weaker. After this stage, the market may reverse, but it may also move sideways for some time before choosing a new direction. This happens because buyers and sellers are becoming more balanced, which also reduces the strength of the previous trend.
4. Why do traders often enter trends too late?
Many traders wait until the price move becomes obvious before entering the market. By that time, the trend may already be in its later stages, where momentum is slowing, and pullbacks become larger.
As a result, the opportunity available earlier in the trend may no longer offer the same potential.
5. How can Bookmap help identify different stages of a trend?
Bookmap displays market liquidity, executed trades, and order flow as trading takes place. This helps reveal whether buying or selling pressure is increasing, weakening, or becoming balanced.
As a result, it provides additional context about whether a trend is developing, continuing, becoming mature, or beginning to lose strength.
Sign Up Now
Latest Articles