


Spot low-timeframe breakouts before momentum expands.
Compare plans to track order book skew and Level II shifts in real time.
Education
May 28, 2026
Breakout Trading on Low Time Frames: How to Read Order Book Skew and Level II for Higher-Probability Moves
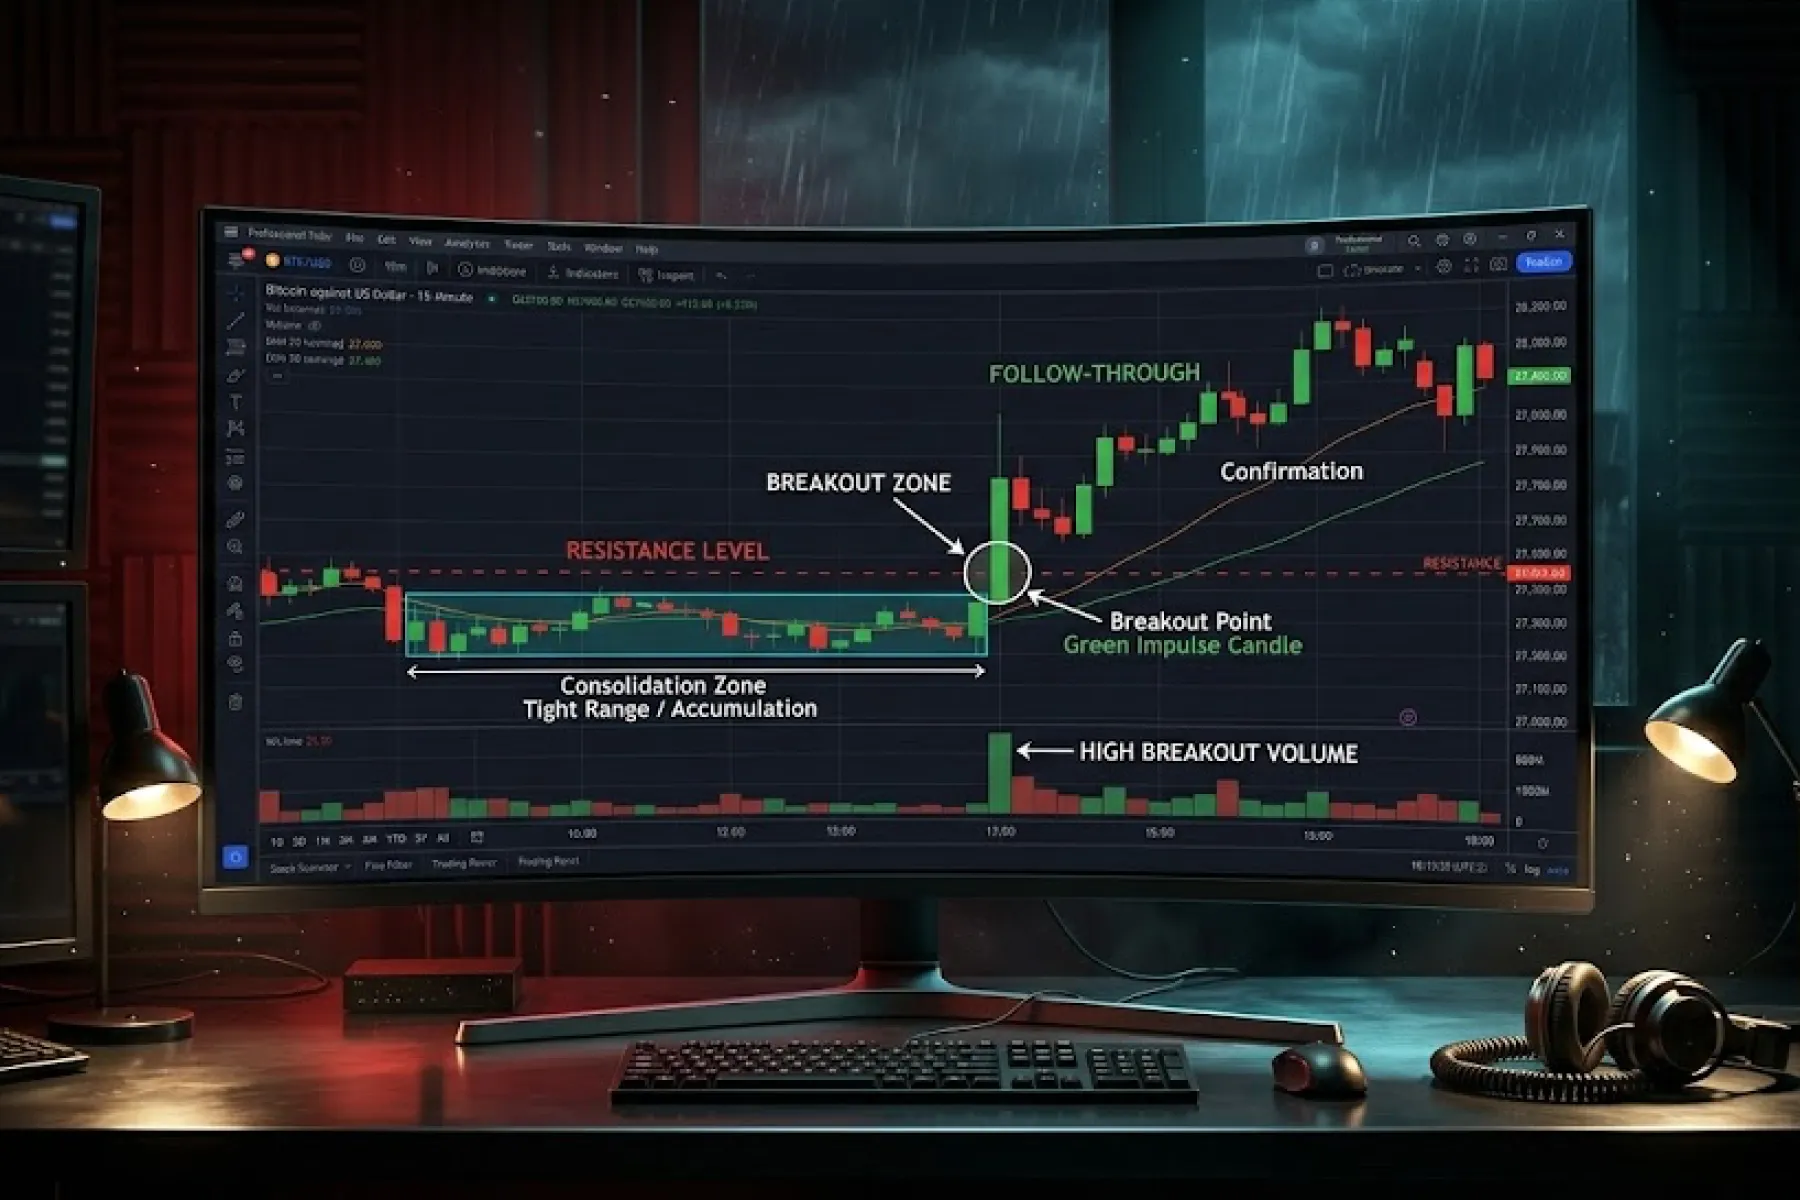
Many breakout traders rely only on price action. But on low time frames, that approach may not yield the desired results. Usually, a price level gets taken, a candle pushes through, and entries follow with the expectation of continuation. However, these moves can reverse within seconds, leading to whipsaws and false breakout signals.
This dynamic plays out because the price alone does not reveal the strength behind the move. A breakout can occur without real participation, influenced by thin liquidity or short-term reactions. As a result, the move triggers entries but fails to hold.
This is the reason why professional traders have resorted to looking beyond the chart. They read breakout trading level 2 dynamics, including order flow, order book skew trading, liquidity behavior, and participation during the move. These factors provide context around whether a breakout is likely to sustain. This article explains how these approaches help identify higher-quality setups and filter out weaker ones in low-timeframe breakout trading.
Why Low Time Frame Breakouts Fail So Often
A move beyond a level on a 1-minute chart can look like a clean breakout, yet still be weak, which is a common issue in “low timeframe breakout” trading, where the price crosses a level but does not sustain above it. This dynamic manifests because a push through a level can be due to the following short-lived factors:
- Thin liquidity near the level,
- Stop-loss triggers getting hit,
- Short-term momentum chasing,
- Temporary imbalance between buyers and sellers, or
- Algorithmic reactions to price levels.
Consequently, the move reflects activity and not commitment. However, many traders treat any move above a level as “confirmation” of strength, which is where confusion begins. Realize that there is a difference between:
- Movement through a level, and
- Acceptance above a level.
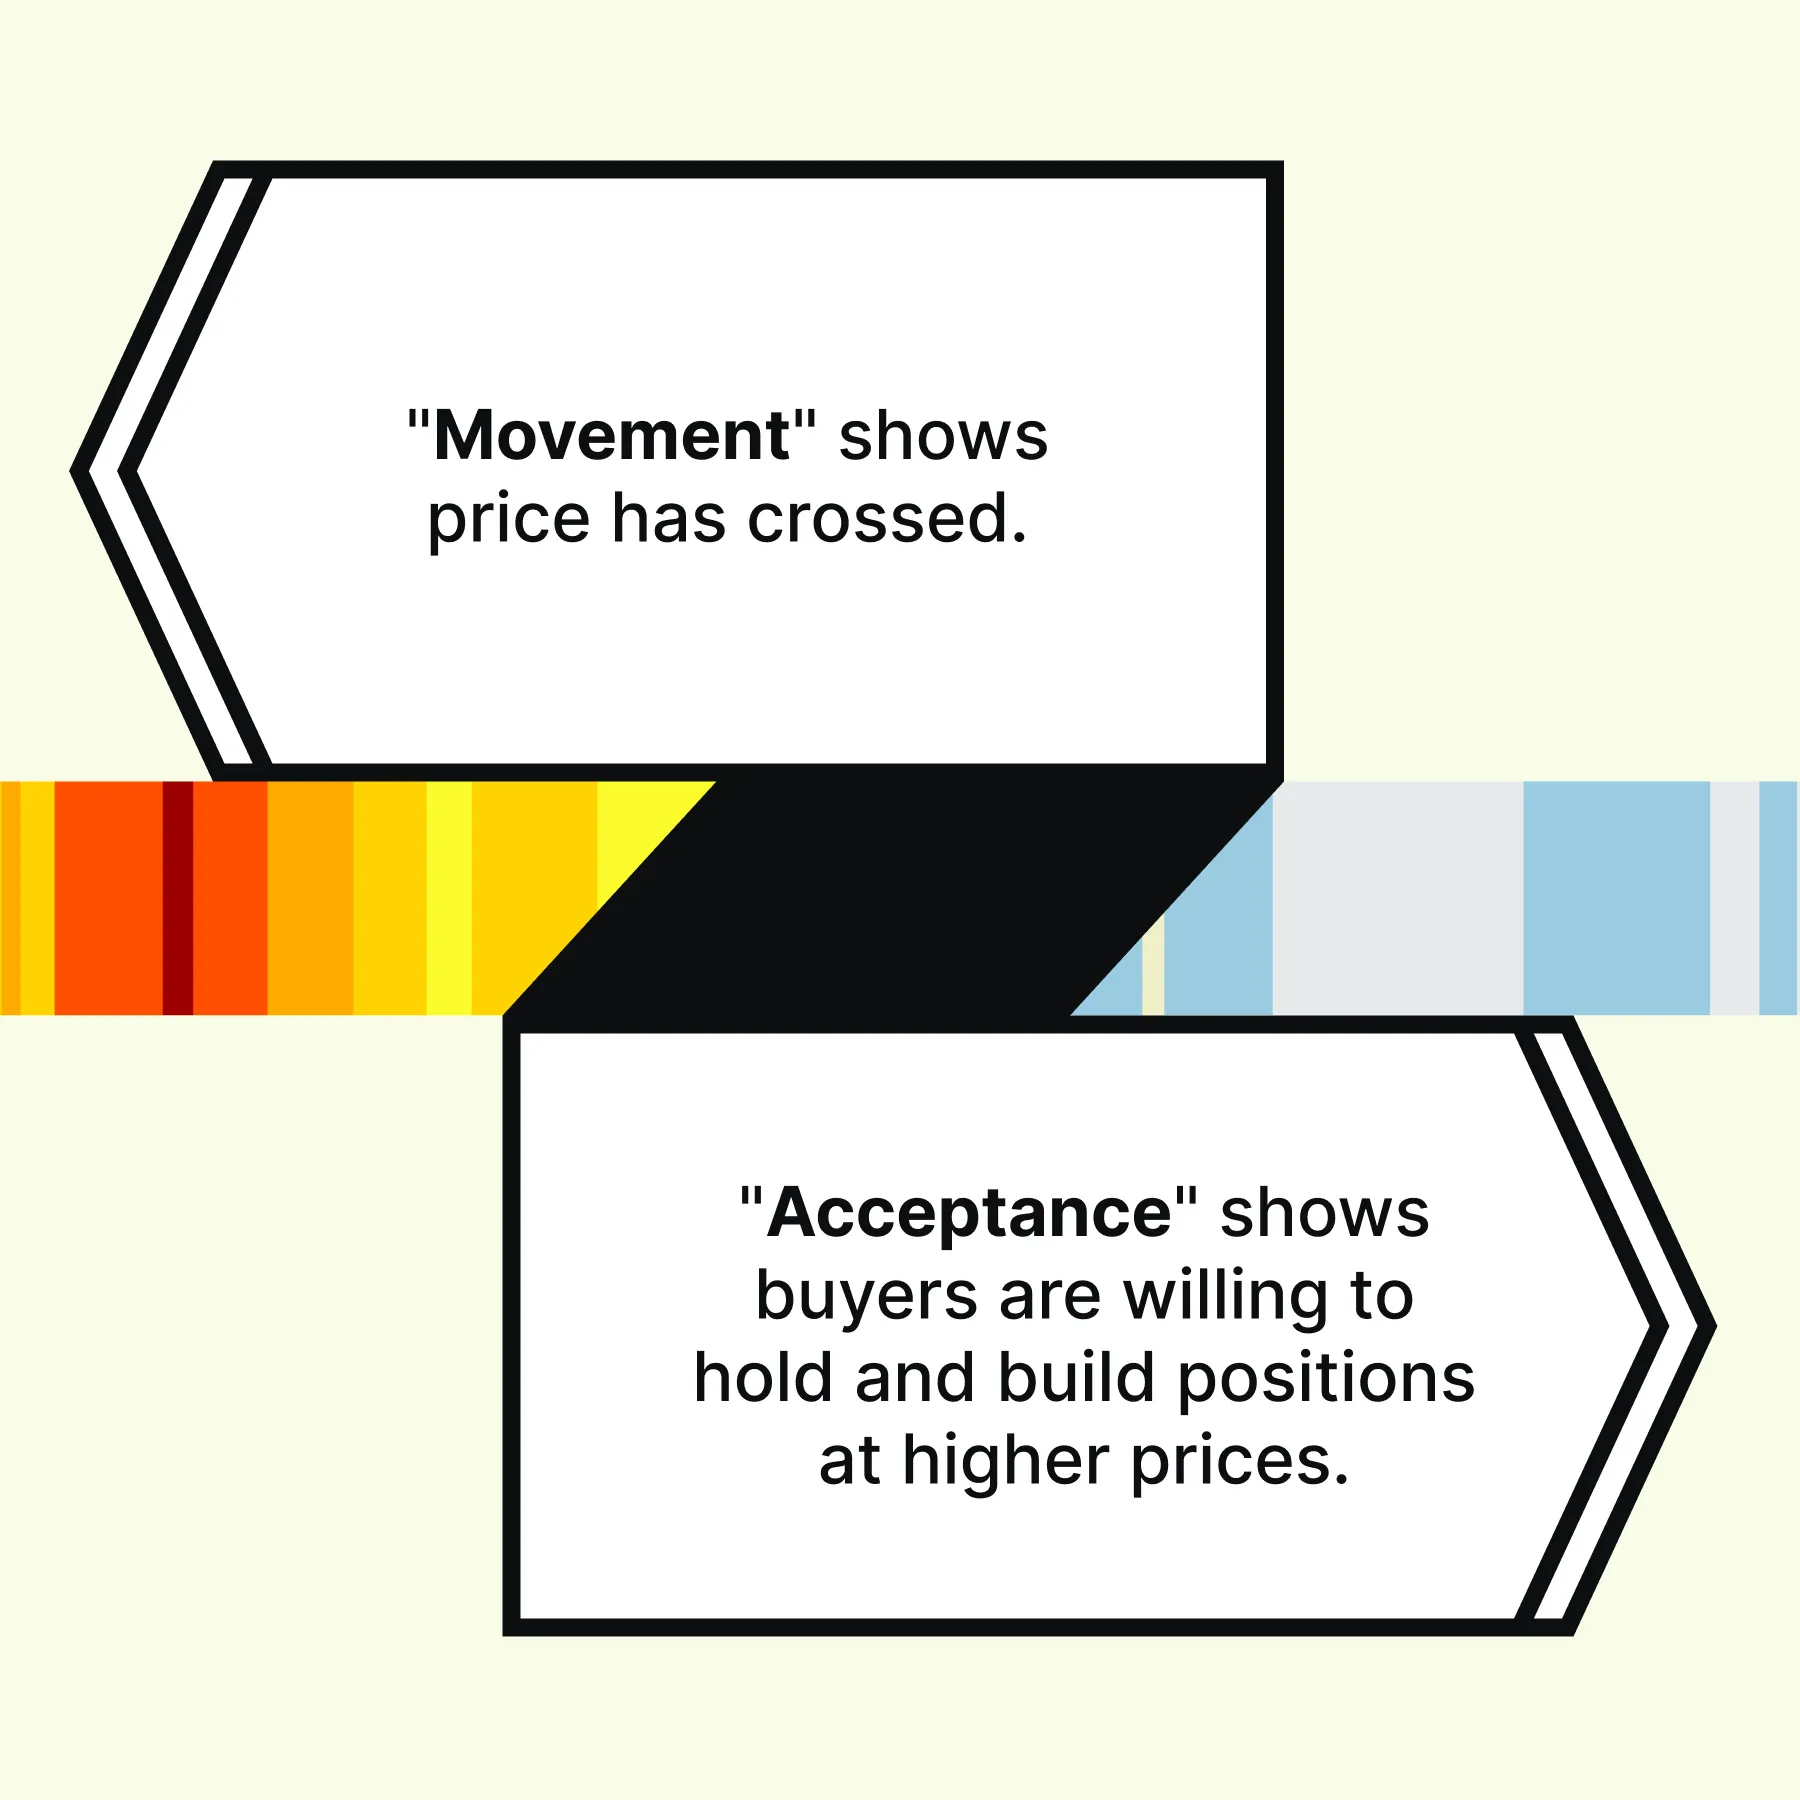
This distinction becomes clearer when viewed through the lens of level 2 trading principles. Additionally, several traders observe the order book to know whether buying interest continues or fades after the breakout. If sell orders keep appearing above the price and buying pressure does not expand, the breakout lacks support.
This dynamic leads to a false breakout signal, where the level technically breaks, but the move does not hold. The absence of sustained demand confirms that the breakout was influenced by temporary forces, rather than genuine interest.
What Order Book Skew Actually Means
Order book skew trading refers to the visible imbalance between buy (bid) and sell (ask) orders. This imbalance provides context around pressure. For example:
- “Heavy ask liquidity” above the price may act as resistance, and
- “Thin ask liquidity” with stronger bids below may support upward movement.
Additionally, “stacked bids” below the price may support pullbacks, whereas “sudden bid withdrawal” may indicate a weakened support. However, skew is not a guaranteed signal.
Large visible orders can be genuine, passive, strategic, or temporary. Therefore, in addition to observing where liquidity sits, traders should also identify how liquidity behaves as the price approaches it.
Bullish Skew Example
Before an upside move, the order book may become more conducive for the price to move through, which does not mean liquidity disappears. Instead, the behavior of that liquidity changes. Usually, stronger breakout conditions appear when:
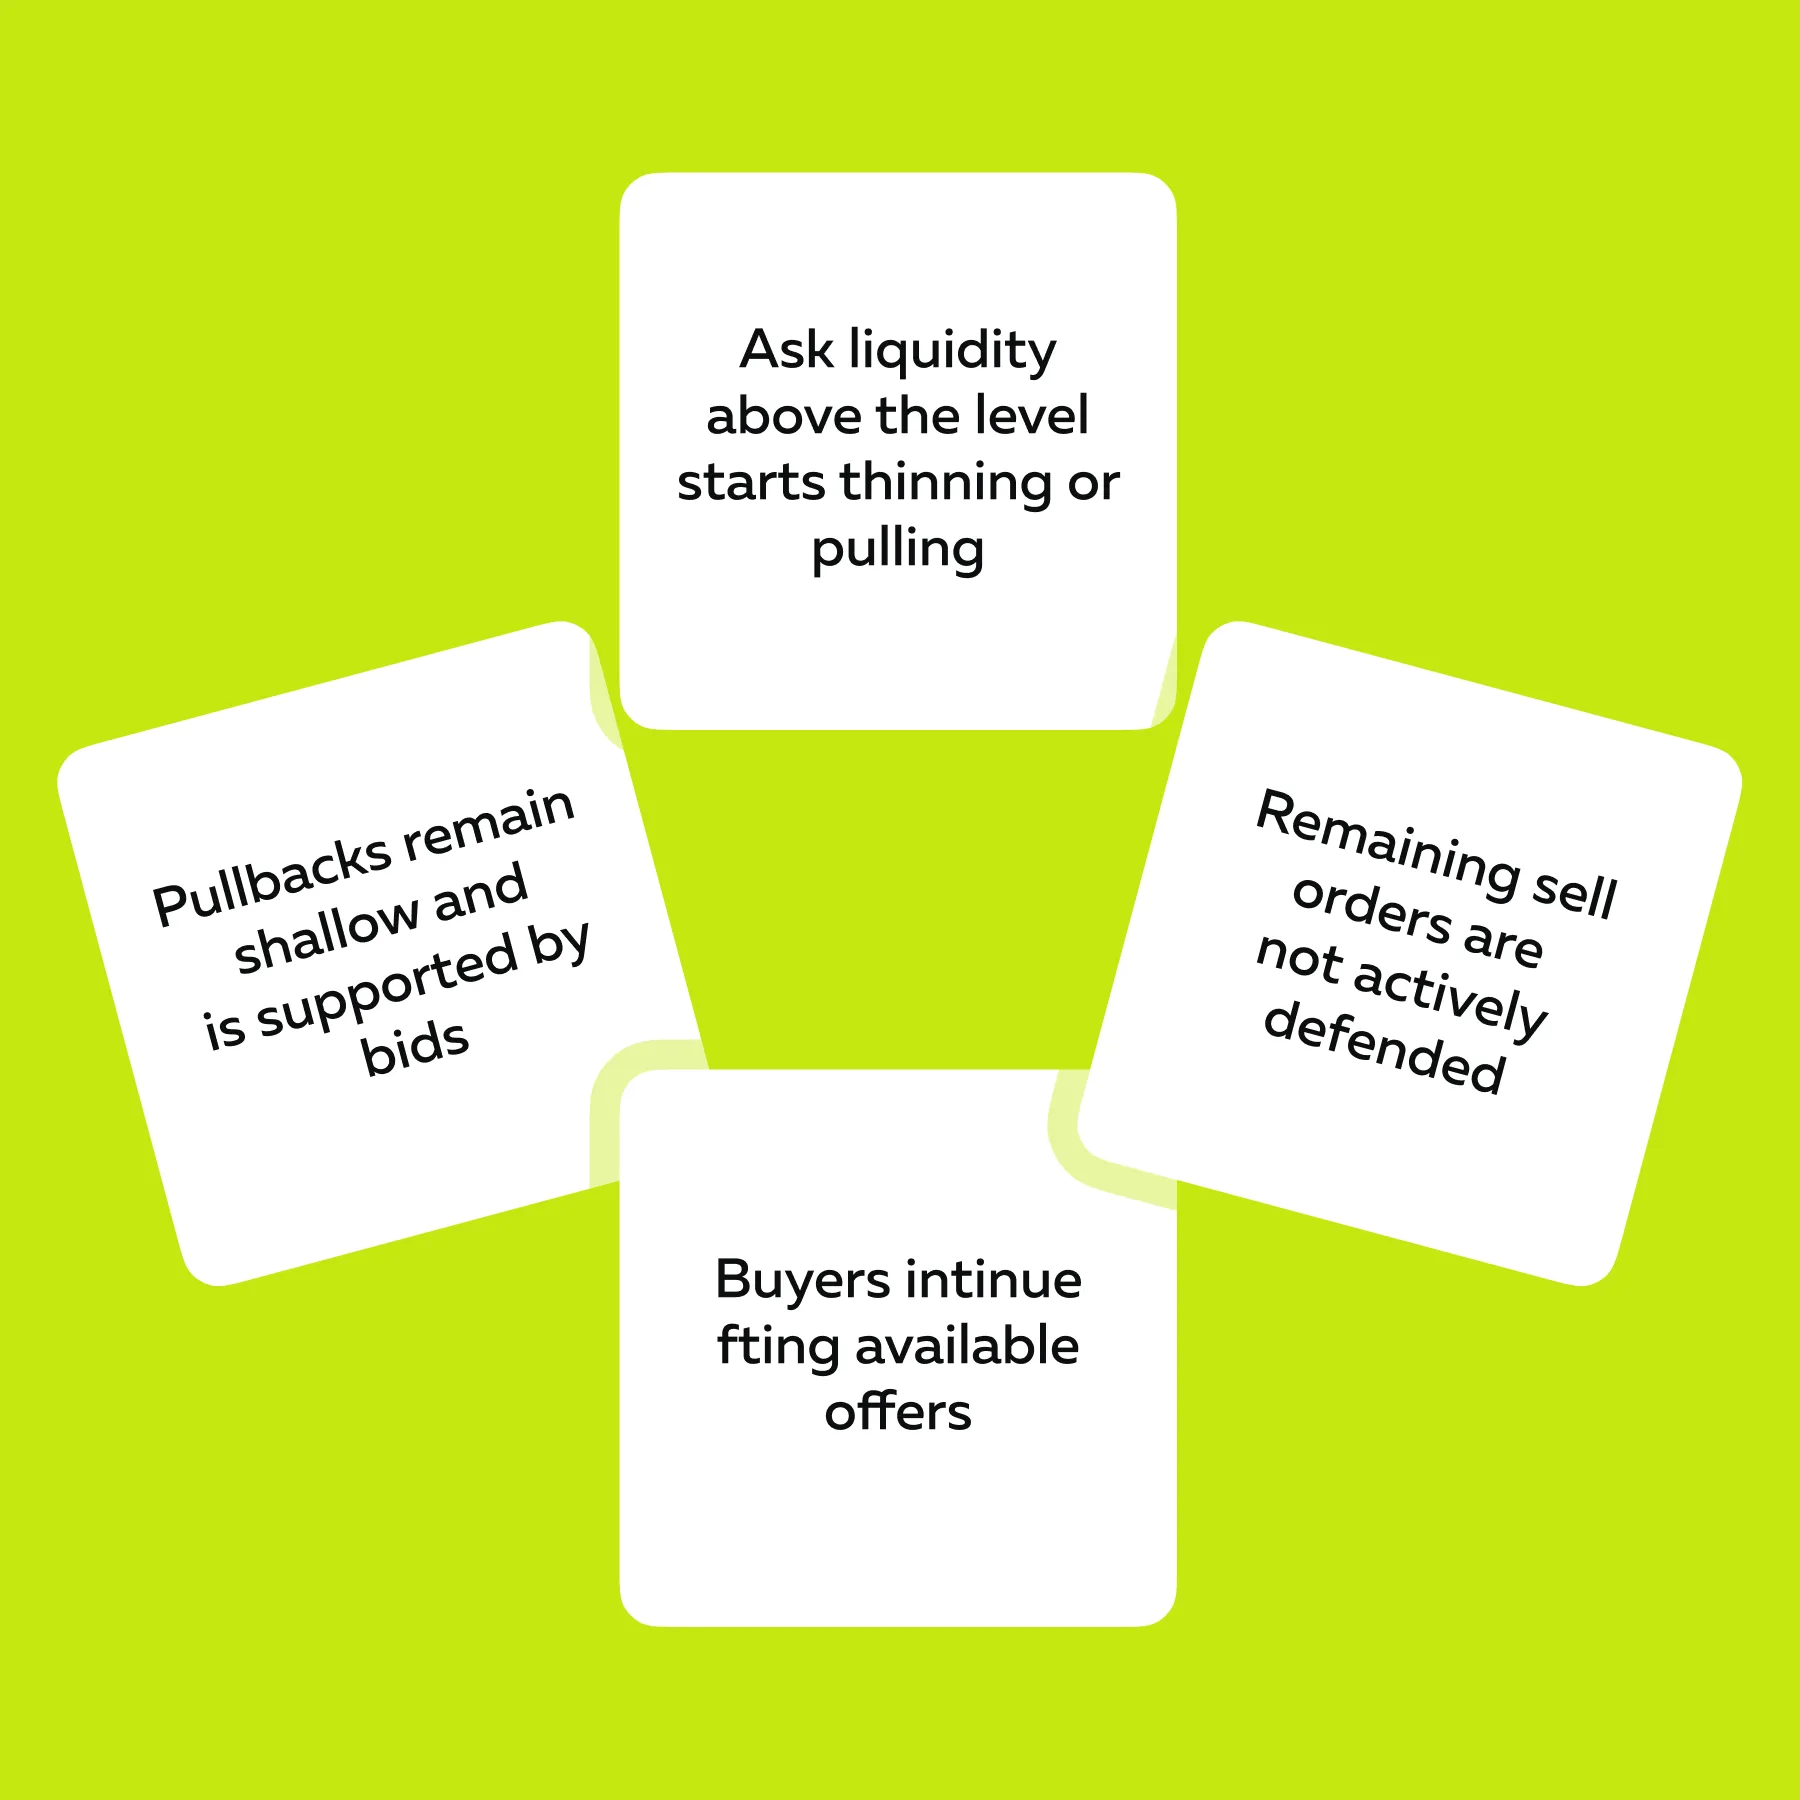
These conditions create an important shift. Liquidity may still exist above, yet buyers are willing to trade through it. That is different from a situation in which large sell orders remain in place and absorb all buying.
At the same time, liquidity pulling can support a breakout. In strong conditions, especially during events, buyers often push through existing liquidity. This situation is where reading level 2 for breakouts becomes highly relevant.
Usually, the presence of a catalyst in such market setups increases the probability of follow-through. Generally, such catalysts may include:
- Economic data releases,
- Earnings announcements,
- Geopolitical developments,
- Broader risk-on sentiment, and
- Strong momentum continuation.
Realize that when a reason for repricing exists, aggressive buying may persist. As a result, breakout continuation could become more likely.
Bearish Skew Example
A different picture emerges when the price rises, but the underlying support weakens. A bearish skew occurs and is observed in the following manner:
| Behavior | Observation | Implication |
| Price rises | Attempts to break higher | Initial strength |
| Ask liquidity | Large offers remain above | Overhead pressure |
| Offer behavior | Orders refresh after each buy wave | Buying is absorbed |
| Bid behavior | Bids below start pulling | Support weakens |
In this case, the breakout becomes vulnerable. Despite the price moving higher, the order book shows resistance holding firm and support fading. This type of structure may lead to false breakout signals, in which the price breaks a level but fails to sustain the breakout. See liquidity shift before breakouts happen → Compare Packages.
How to Read Level II During a Breakout Attempt

Many traders approach Level II expecting a directional signal. However, level 2 does not predict price. Instead, it shows:
- How liquidity behaves,
- Where pressure builds, and
- Whether participants are committed.
Therefore, during a breakout attempt, it is not about checking which side looks larger. Rather, it is about identifying whether the market is poised to move through a level or is likely to reject it, trapping participants.
Is Liquidity Pulling or Holding at the Key Level?
Before the price reaches a key level, the order book provides early clues. The following are some clues traders may get in an “upside attempt”:
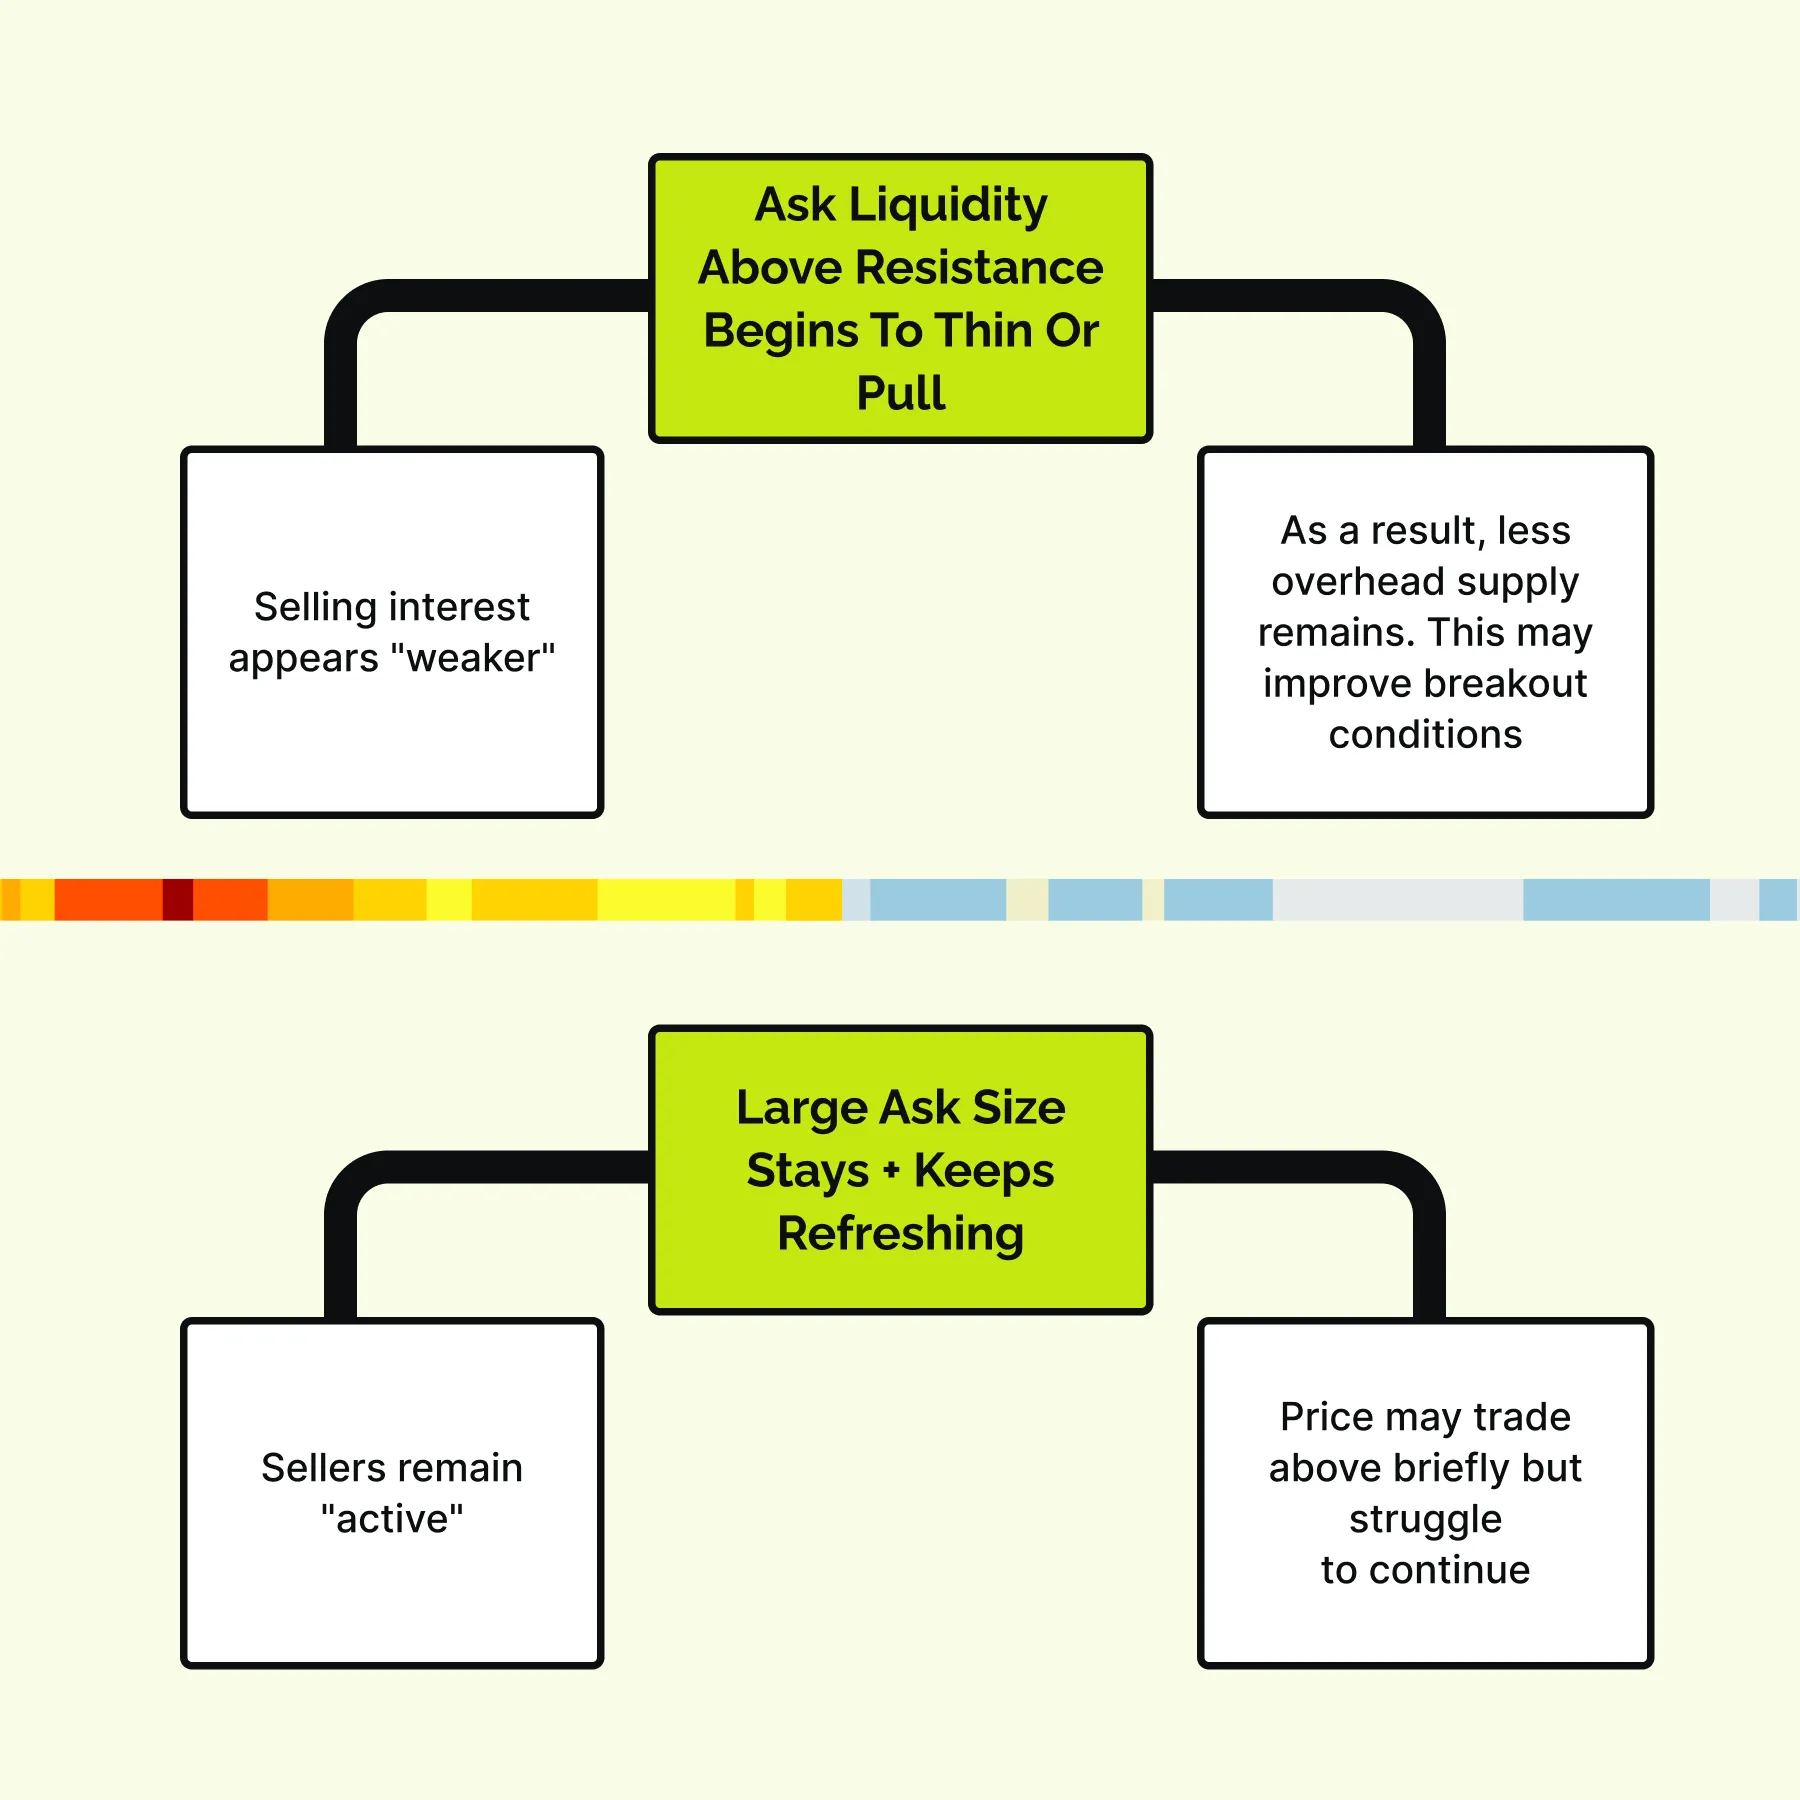
At the same time, liquidity pulling alone is not sufficient. Sometimes orders disappear only to reappear at higher levels. Therefore, price reaction after the breakout becomes the deciding factor.
Is Aggressive Buying or Selling Actually Committed?
A breakout requires participation. Empty order books may allow the price to drift, yet such moves usually lack durability. Note that for an “upside move”, stronger conditions appear when:
- Trades repeatedly hit the ask,
- Transactions occur at progressively higher prices,
- Price does not reverse immediately after each push, and
- Sellers fail to regain control.
This reflects real intent. In contrast, weak activity signals fragility.
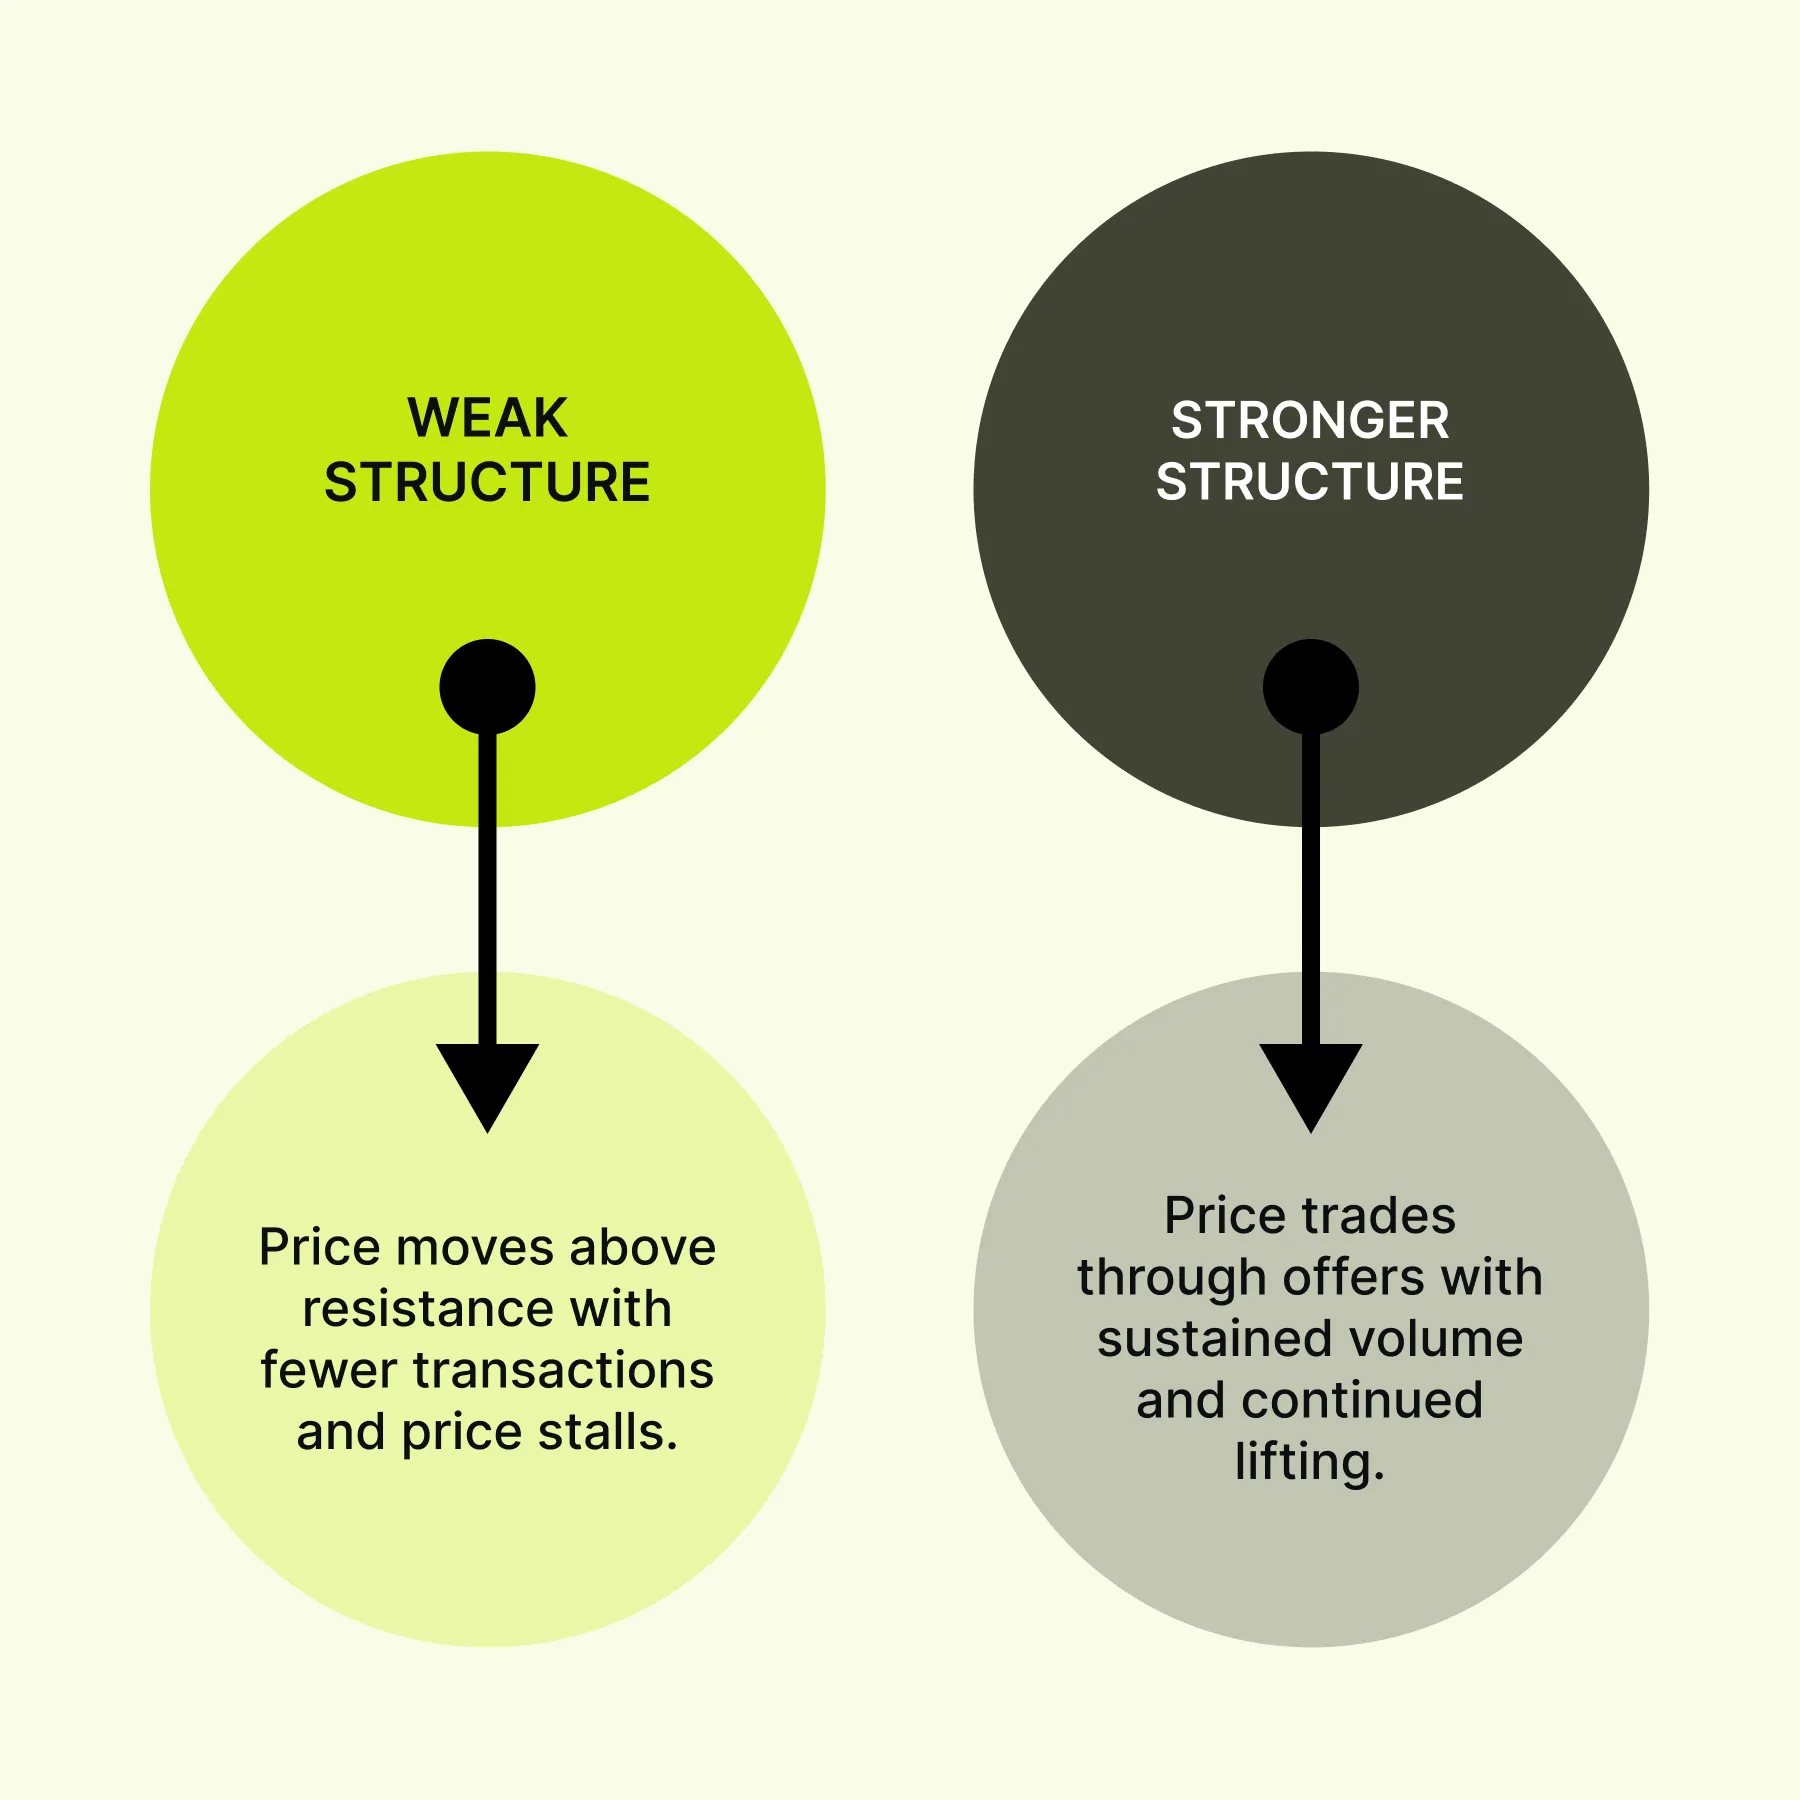
Such a distinction plays an important role in a breakout scalping strategy, where short-term continuation depends on active participation rather than passive movement.
Is the New Price Being Accepted or Rejected?
Note that the breakout itself is only the first step. What follows determines its “validity”. This fact is one of the most important observations in low-timeframe breakout trading. After price clears a level, the market reveals its intent as follows:
- If the price stays above the level, trades actively, and pullbacks hold, this dynamic suggests an acceptance is forming.
- If the price quickly falls back with little trading above, rejection is likely.
For this reason, the breakout candle alone carries limited meaning. The important signal lies in whether the market chooses to remain at the new price.
The Best Breakouts Usually Happen From Pressure Build-Up
Strong moves in low-timeframe breakout trading do not begin with random spikes. Instead, they develop through repeated pressure at a price level, with one side continuing to test until the other side weakens.
Due to this behavior, experienced traders observe not just the first touch, but how the price behaves around the level over time, which is where a breakout trading level 2 approach adds context beyond the chart.
Weak Tops and Repeated Testing
A common structure is a “weak top,” where resistance is tested multiple times, which may exhibit the following dynamic:
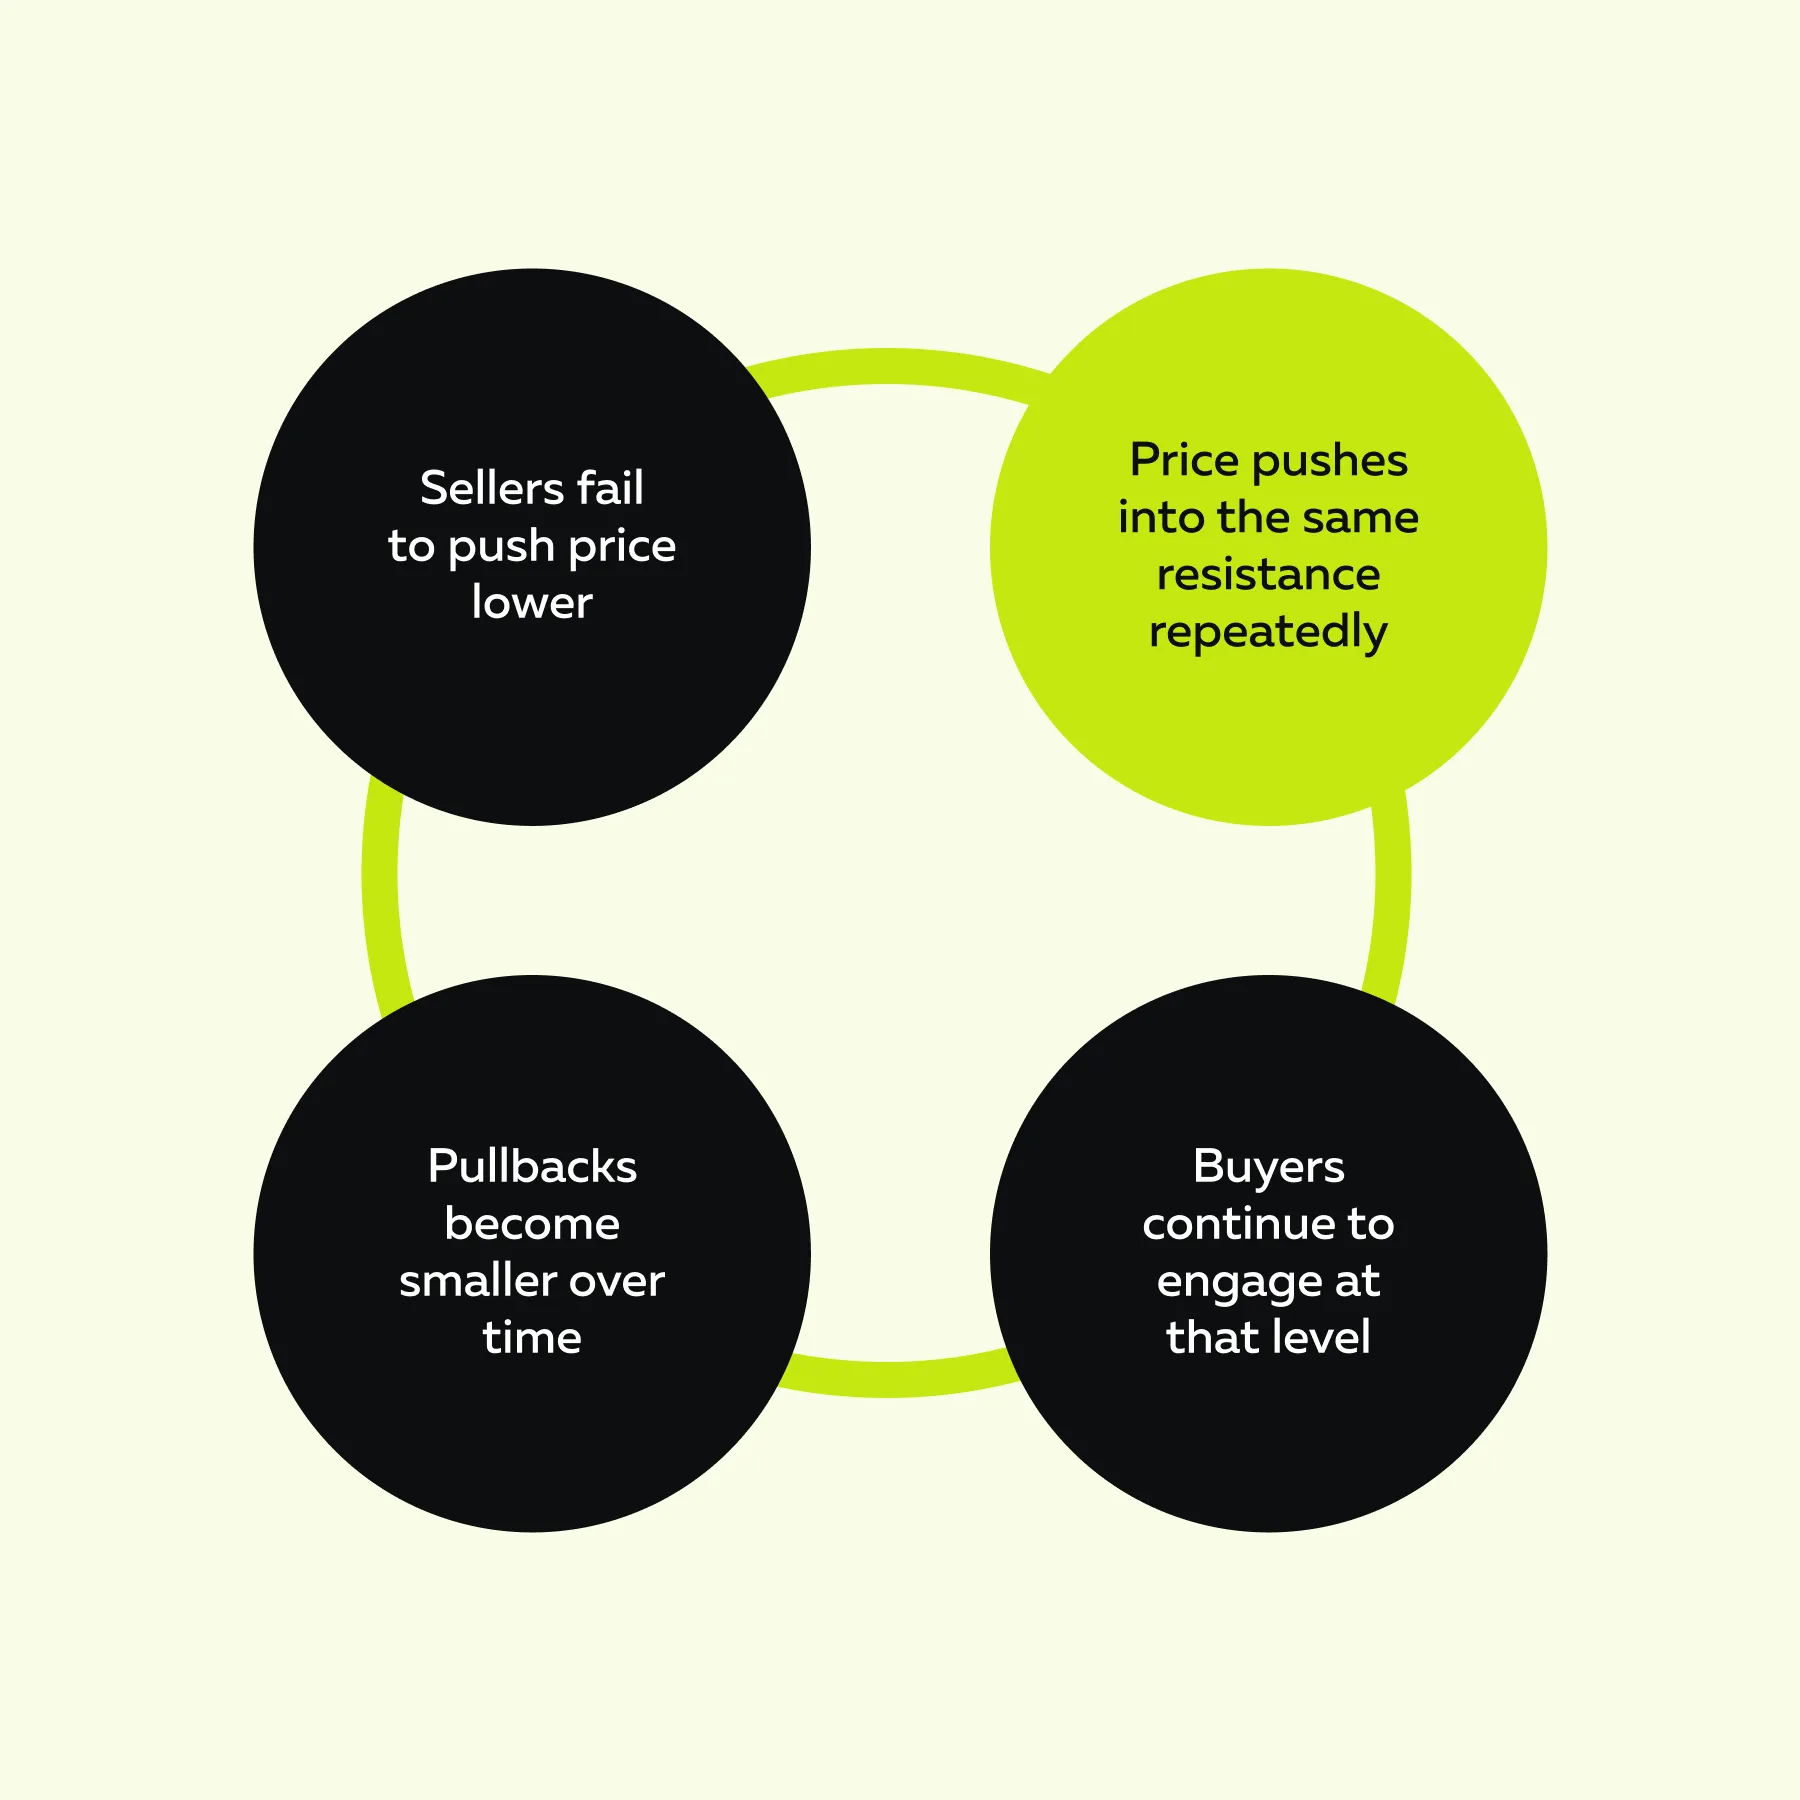
Each test adds pressure. Therefore, the level eventually breaks not because it was weak to begin with, but because it was repeatedly challenged. Visually, this resembles a price pressing against the same ceiling until it gives way.
The “Dam Breaking” Dynamic
As repeated tests continue, positioning begins to build around the level as follows:
- Stop orders accumulate above resistance,
- Breakout traders prepare for entry, and
- Sellers absorb more buying flow each time.
As a result, over time, a “tipping point” forms. Once reached, stops get triggered, and new buyers enter the market. The remaining sell liquidity gets traded through consistently, which creates a rapid price increase, known as a “dam breaking” move. The breakout is not sudden; it is the result of accumulated pressure.
Cup-and-Handle/ Higher Low Structures
Another common pattern during build-up is a tightening structure, which exhibits the following common sequence:
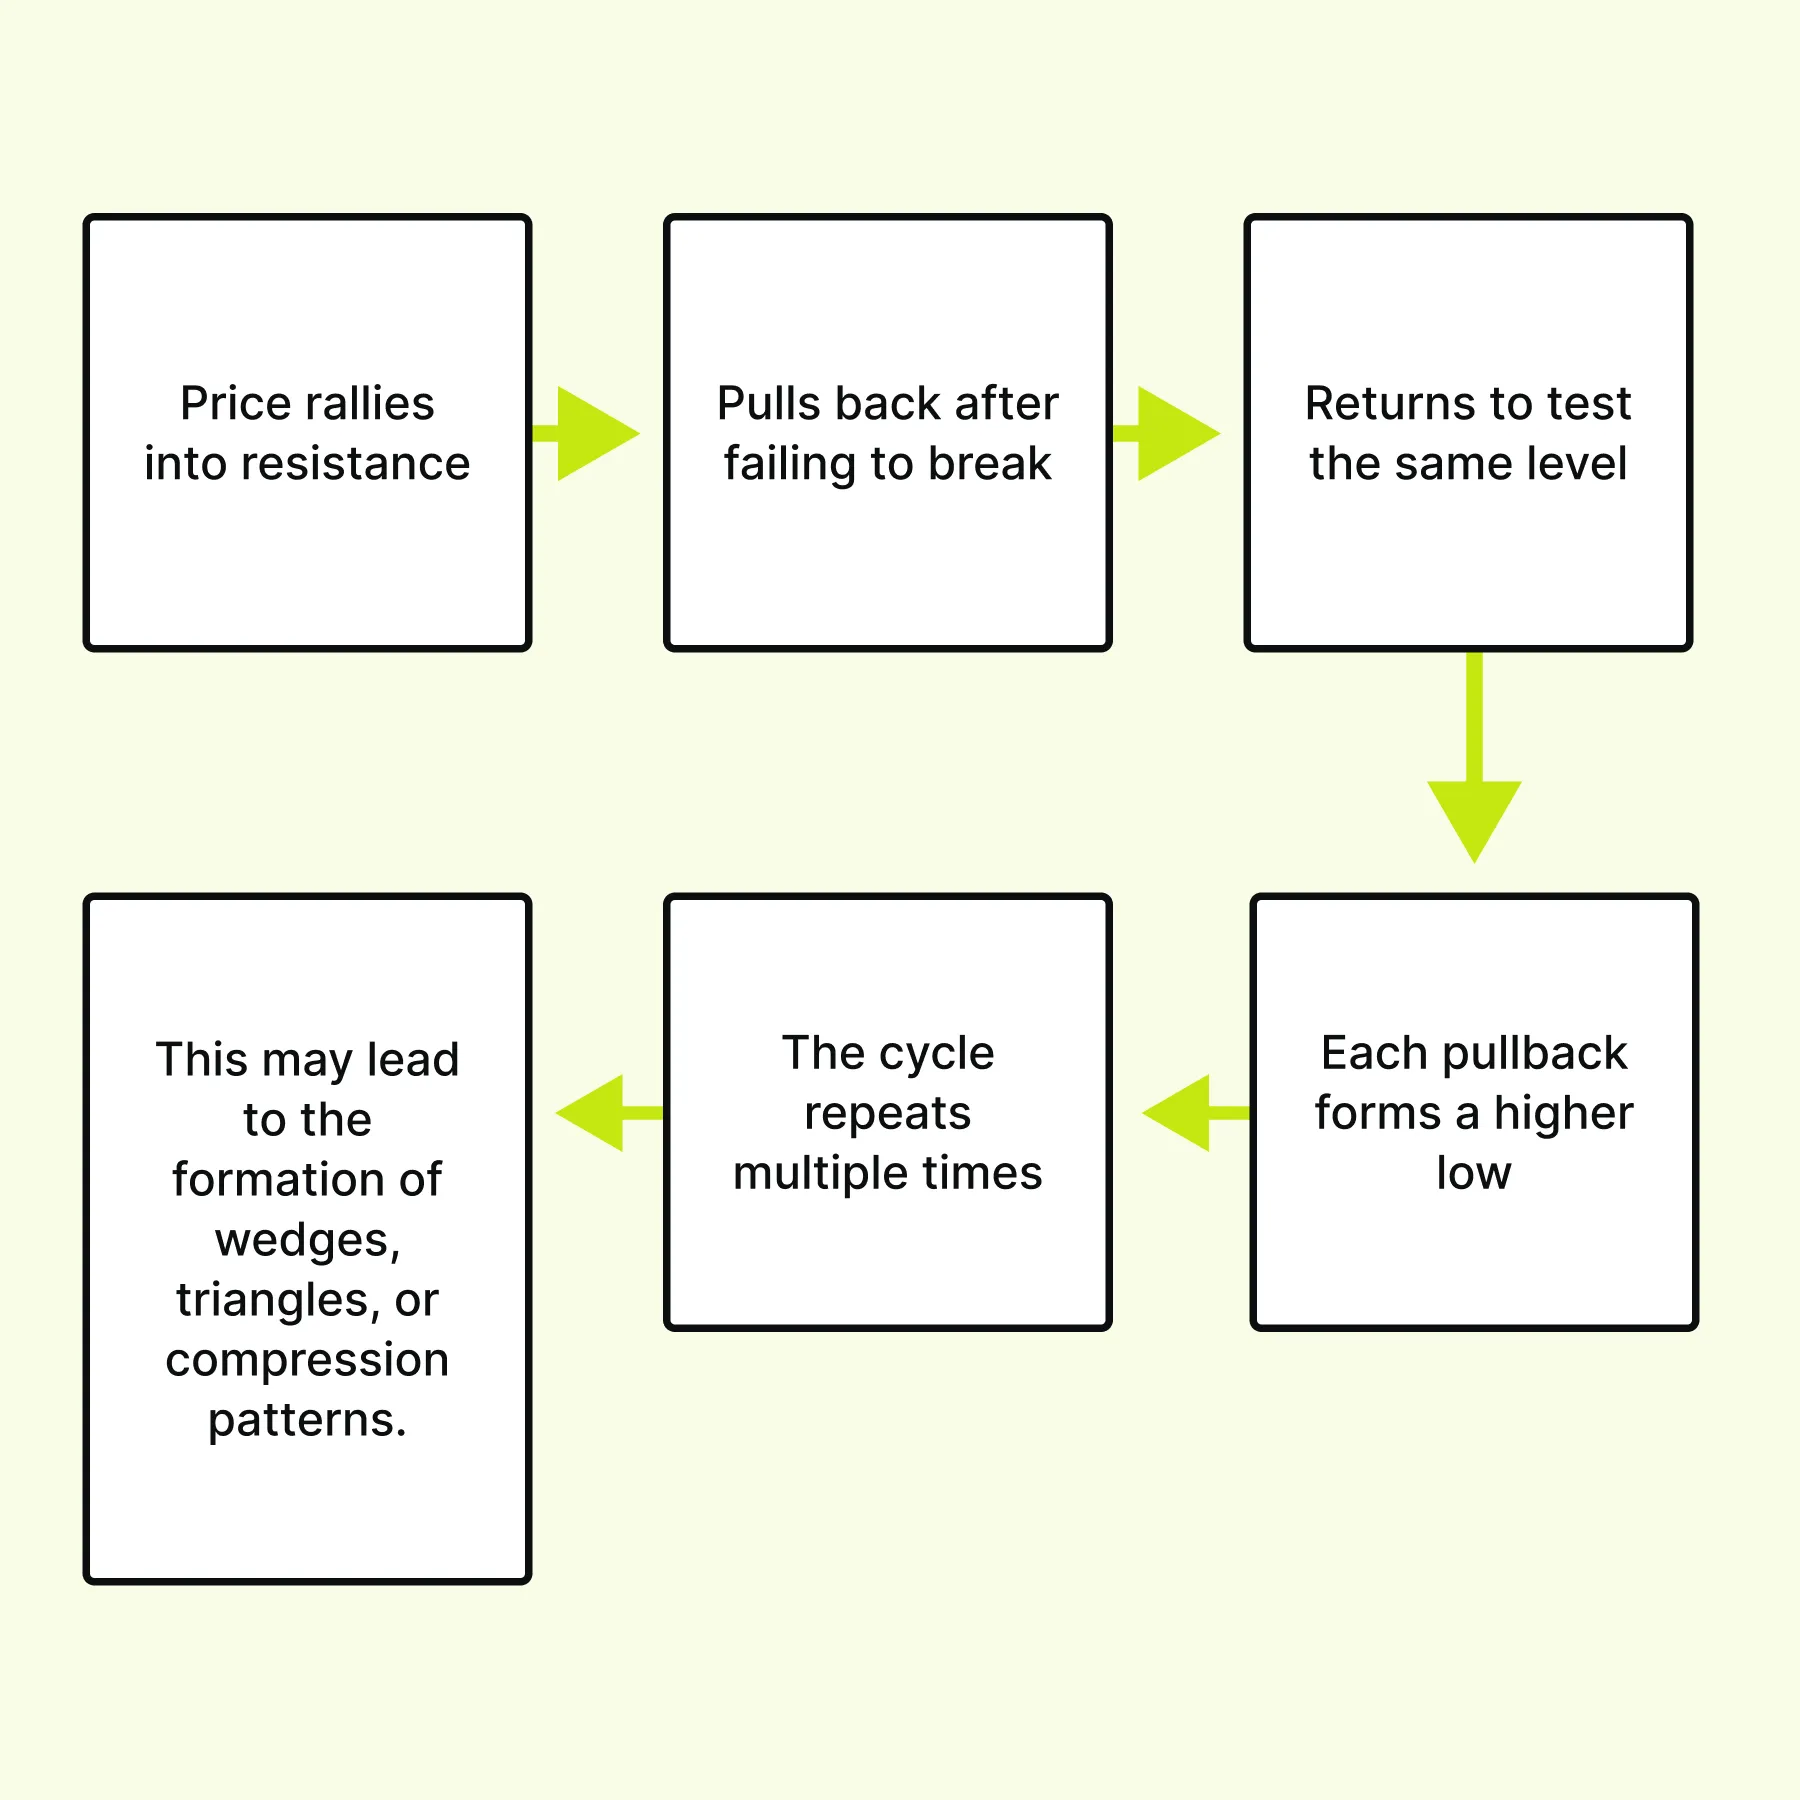
In such a trading scenario, traders could observe that even without an immediate breakout, buying pressure persists and sellers gradually lose control. Understand which breakouts are real and which are traps → Compare Packages.
Why Order Book Skew Matters Here
These compression phases occur when order-book skew trading becomes more informative. Repeated tests can reveal whether pressure is increasing in the order book, which can be checked by looking for these signals:
- Ask liquidity may thin with each approach,
- Buyers may lift offers more aggressively,
- Pullbacks may find support sooner, or
- Selling pressure may weaken over time.
When these conditions align, the setup shifts from a chart pattern to a structural imbalance. Therefore, the best breakouts are rarely surprises. They are built gradually through repeated testing and then confirmed by:
- Liquidity behavior,
- Active participation, and
- Acceptance after the break.
This strategy reduces the likelihood of false breakout signals.
How Scalpers Can Use Retests Instead of Chasing
Many losses occur when traders chase the initial breakout move. In contrast, traders can prefer “retests” instead of chasing price moves. The following example demonstrates this through a 4-point sequence:
- Breakout:
- Suppose the price moves slightly above 4500 to 4503.
- It shows an initial attempt to move higher.
- However, this alone does not confirm strength.
- Pullback:
- Price returns to 4500–4501.
- It tests whether the breakout level can hold as support rather than failing immediately.
- Order Book Reaction:
- Bids remain stable.
- Sellers are unable to push the price back below 4500.
- This behavior indicates that buying interest remains at that level.
- Continuation:
-
- Buying resumes after the retest.
- It shows that the market is accepting higher prices.
- This behavior provides stronger confirmation of the breakout move.
This sequence shows that the breakout holds only if the level acts as support after the break.
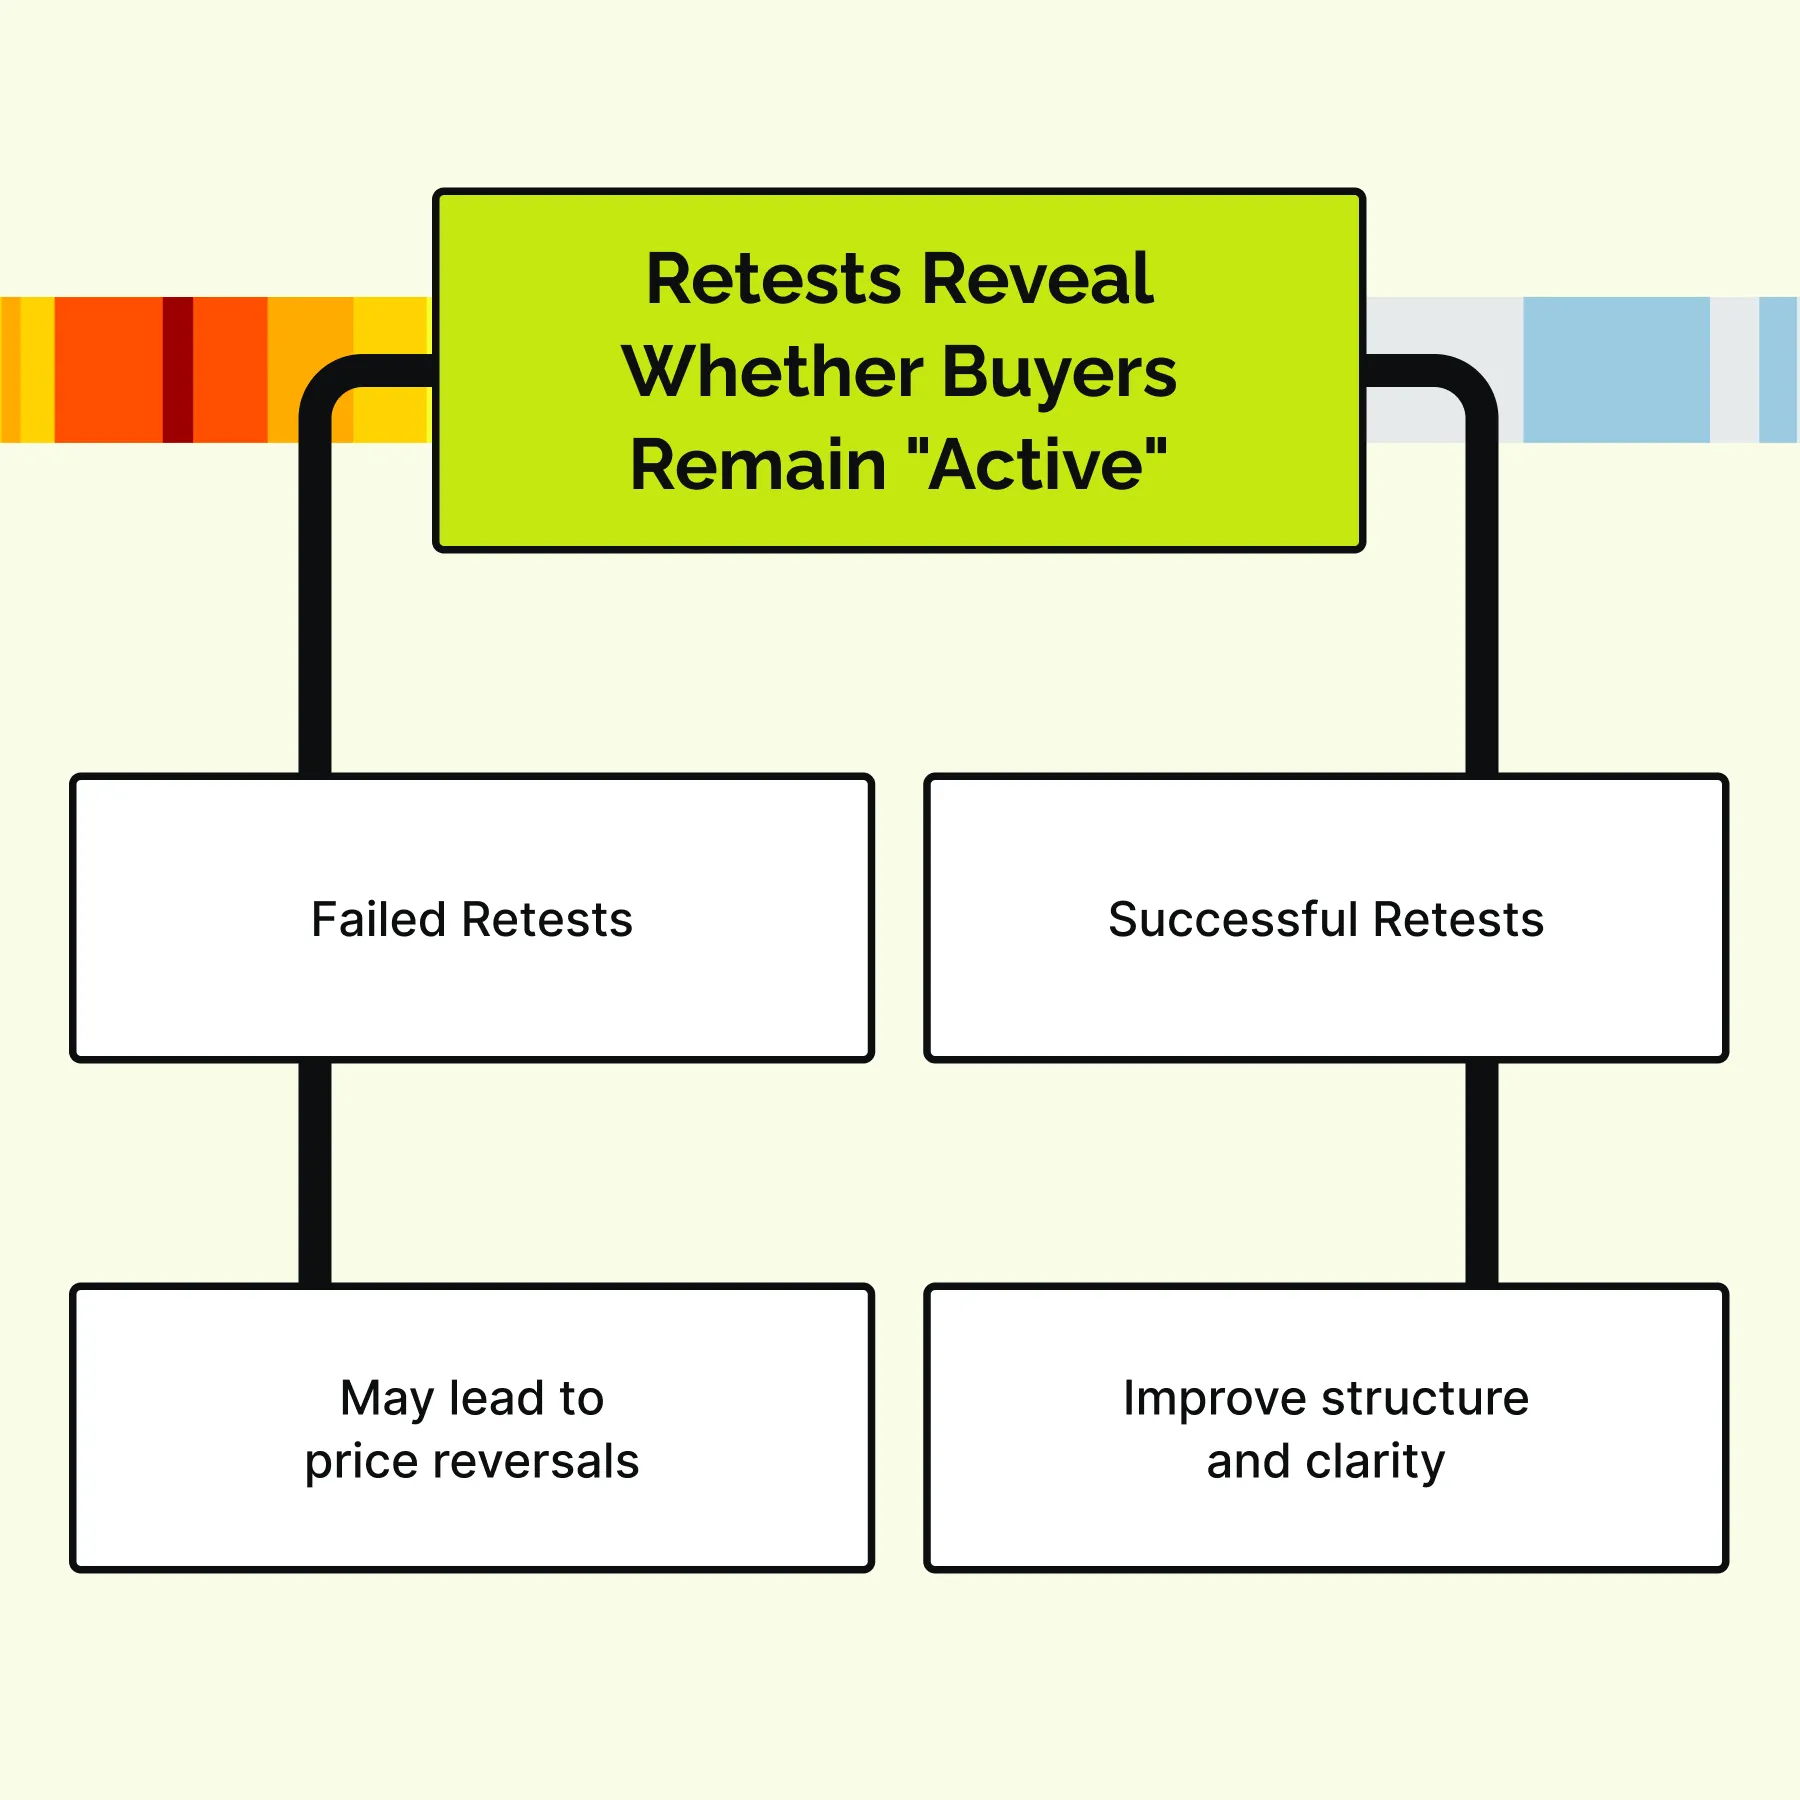
Therefore, the retest acts as a “filter. It helps distinguish between a genuine breakout and a move driven by a temporary imbalance.
What a Weak Breakout Looks Like in Real Time
A weak breakout may look convincing at first, but it lacks the structure to continue. A common issue in low-timeframe breakout trading is that the price briefly moves above a level but fails to hold it. Such breakouts usually share a consistent set of signals:
- Price only slightly moves above the level,
- Volume does not expand,
- Ask liquidity keeps refreshing above the price,
- Very few trades occur above the breakout level, and
- Price quickly returns to the range.
As a result, the move reflects a test rather than a true shift in control. Therefore, a breakout without participation is usually a false breakout signal.
Real Trade Example: ES Breakout Fakeout
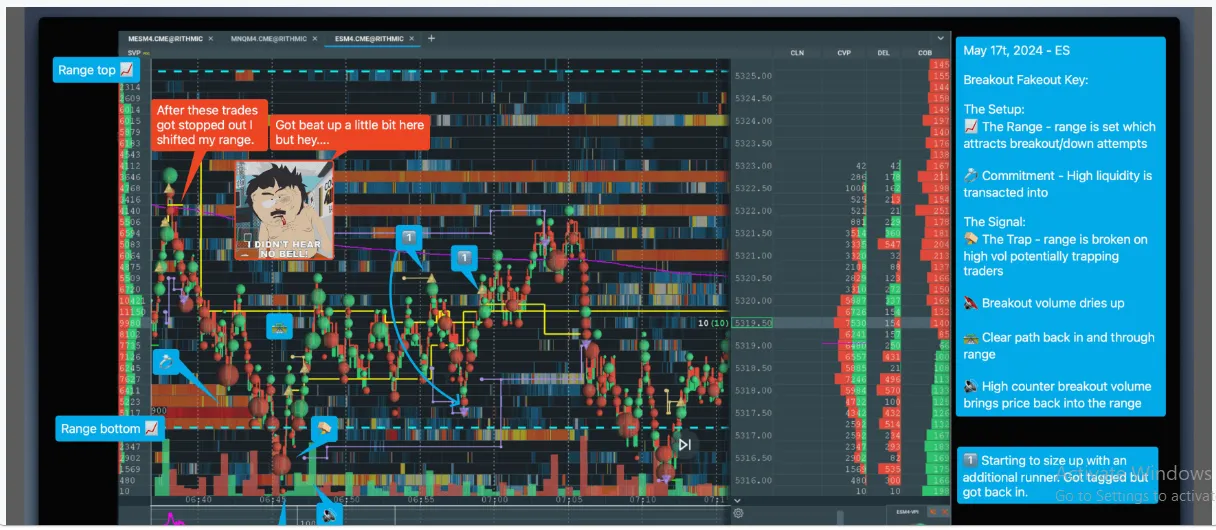
The above Bookmap example shows a “failed breakout” using order flow and heatmap data. The market traded within a defined range, with highs and lows. Over time, range highs became an obvious breakout level. Consequently, market participants expected continuation if the price moved above this price level.
As a result:
- Price pushed above the range highs and triggered breakout entries,
- In response, initial buying appeared, but follow-through did not develop, and
- Later, the price rotated back into the range and moved toward the middle
This sequence shows that the breakout occurred, but the move did not sustain.
What Order Flow and Level II Likely Showed
From a level 2 trading perspective, the order book showed several weaknesses during the breakout attempt:
- Liquidity near the highs did not fully clear,
- Sell orders above the price continued to absorb buying,
- Breakout buying lacked strength and consistency, and
- Once buying slowed, the price lacked support above that level.
Consequently, the price move failed. This failure can be understood as a change in participation. Later, when the price returned inside the range, the breakout lost validity. At that point, trapped buyers became a source of selling pressure.
Key Lesson
Many traders treat the breakout itself as the signal. However, in a breakout trading level 2 framework, the more important signal is what happens after the breakout.
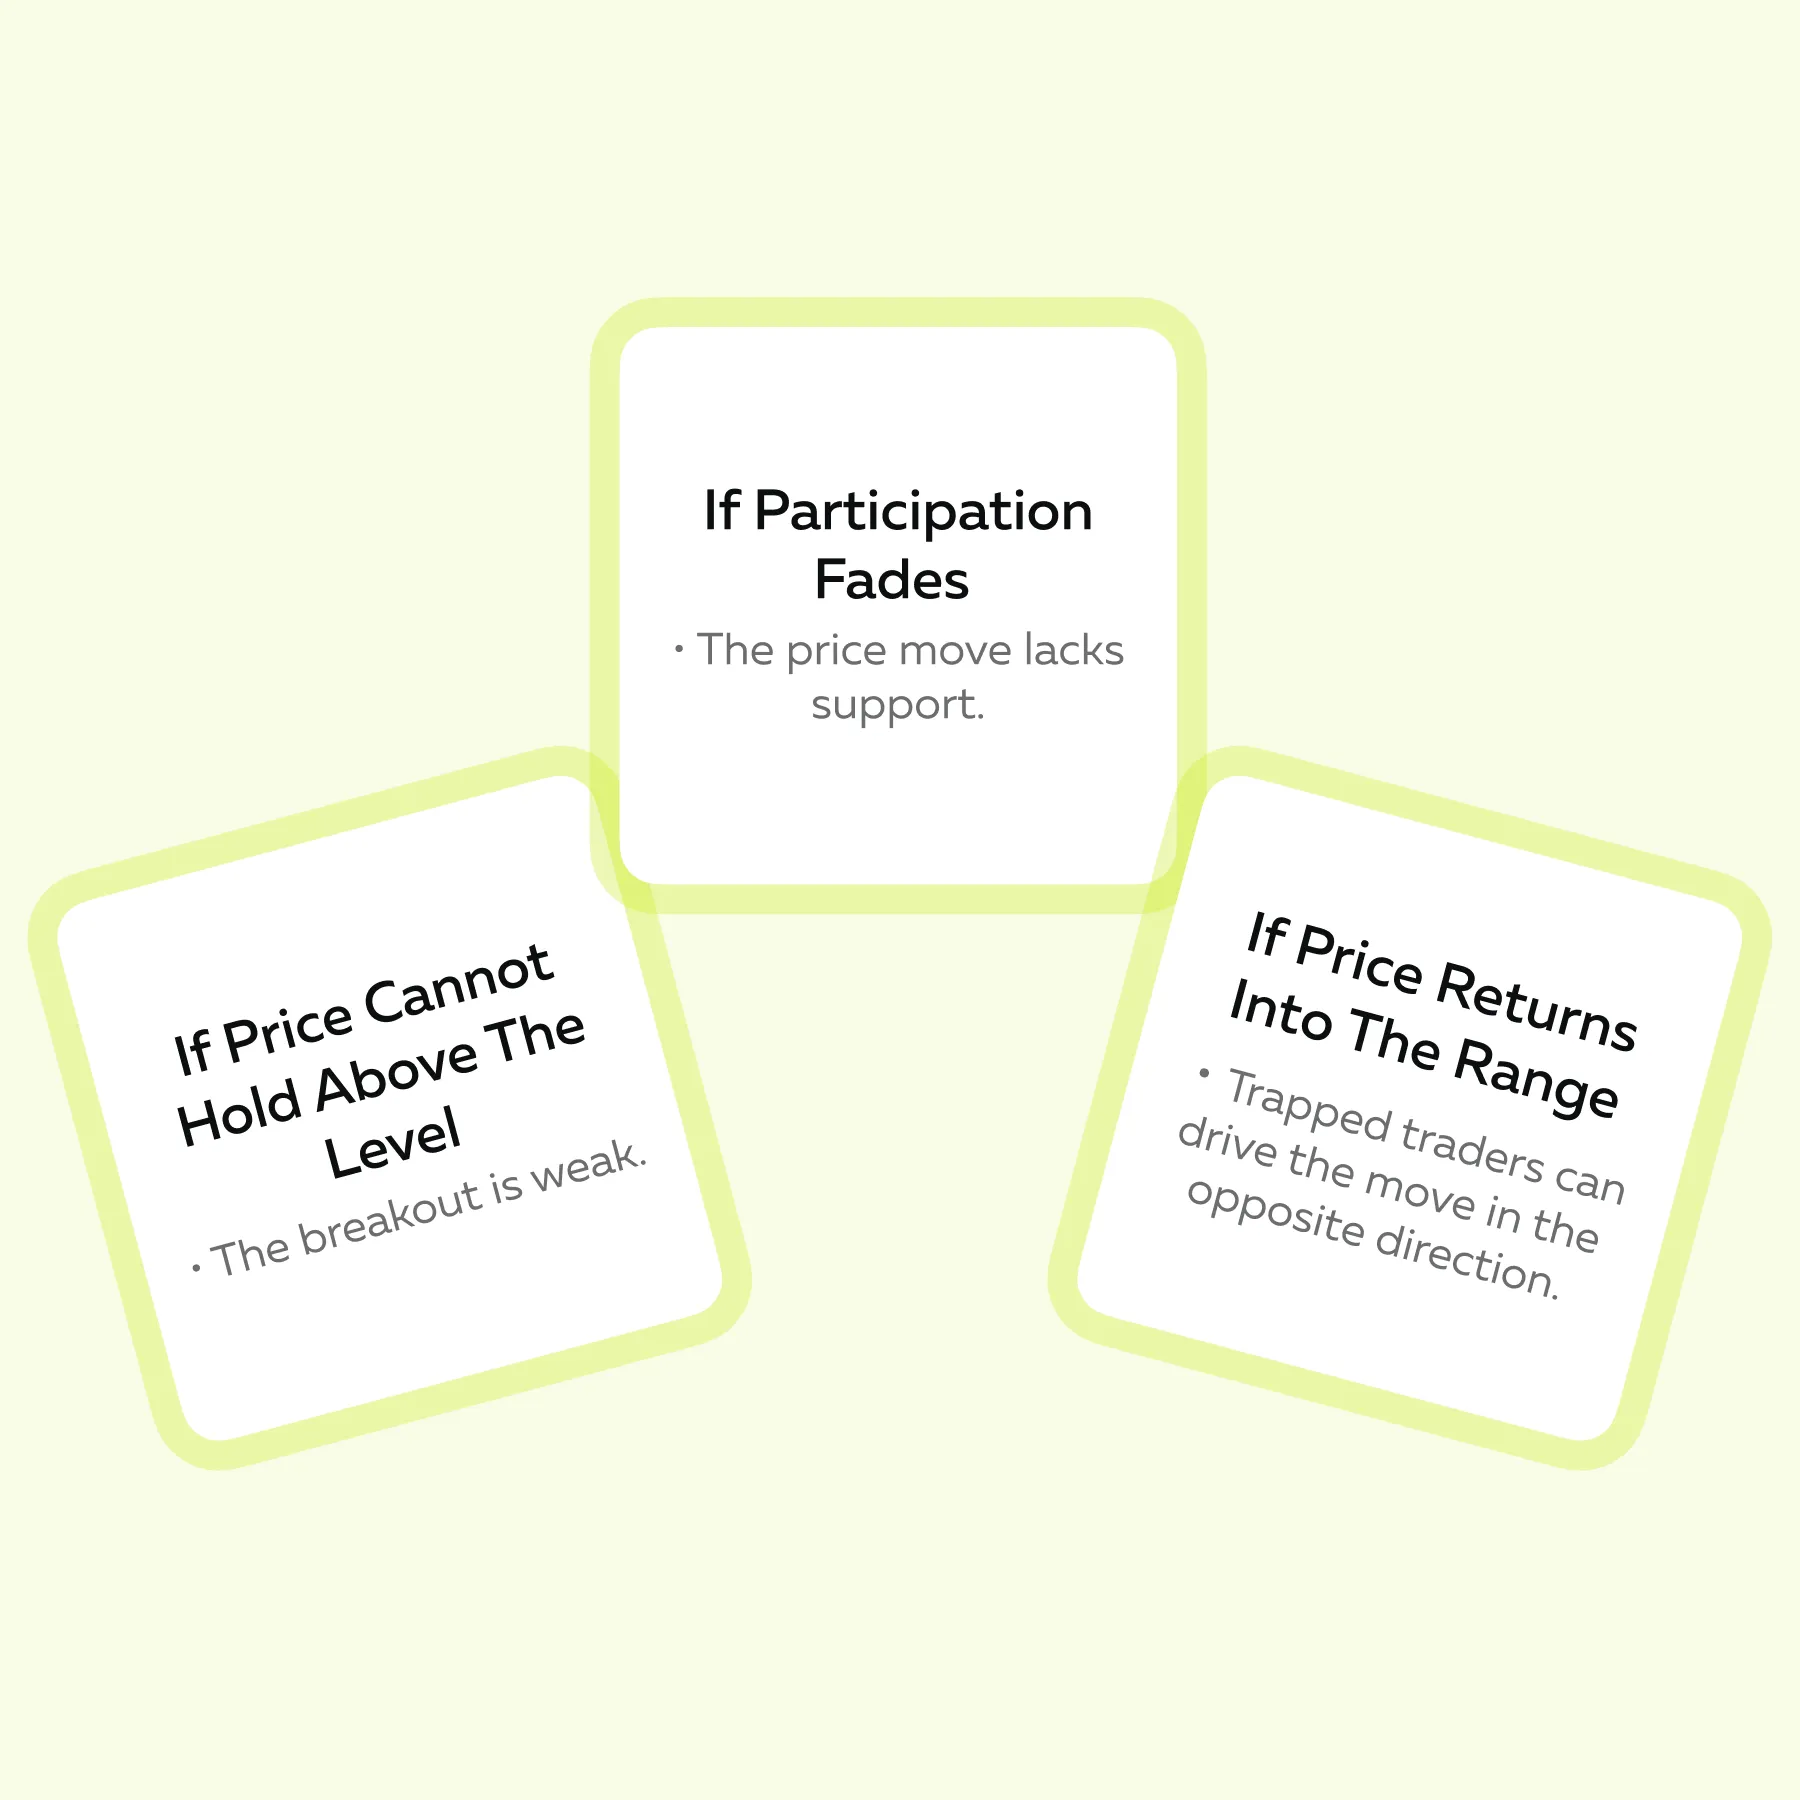
Therefore, failure after the breakout often provides stronger information than the breakout itself. Explore more real trade breakdowns here: https://bookmap.com/insights
Conclusion
Low-timeframe breakout trading goes beyond candles crossing a line on the chart. Stronger moves usually develop when pressure builds over time, rather than from a single spike. This pressure usually appears through repeated testing of a level, where one side gradually gains control.
At the same time, order-book skew trading can reveal whether liquidity supports or resists the move. In addition, real breakouts could show clear participation, with buyers or sellers actively trading through levels rather than hesitating.
Most importantly, continuation depends on “price acceptance”. Price must hold above or below the level to confirm strength. However, Level 2 trading cannot confirm every price move; it can only filter out weak setups and reduce exposure to false breakout signals. Read Level II pressure and breakout participation in real time → Compare Packages
FAQs
1. Can Level II predict breakouts?
Level II does not predict breakouts with certainty. It only reflects real-time order flow and shows how buyers and sellers behave around key price levels. Through it, traders may identify whether a move has support or is likely to fail.
For example, strong participation and liquidity changes can support continuation, while hesitation or absorption can signal weakness.
Therefore, it acts as a decision-support tool rather than a prediction system.
2. What is order book skew?
Order book skew trading refers to the imbalance between visible buy orders (bids) and sell orders (asks). This imbalance can influence short-term price movement. For example, stronger bids below the price may support upward pressure, while heavy asks above may act as resistance.
However, skew alone is not a directional signal. Its value depends on how liquidity behaves as the price approaches it.
3. Why do many breakout trades fail on low time frames?
Many breakouts fail in low timeframes because the price can move beyond a level without real commitment. This event may happen due to:
- Thin liquidity,
- Stop-loss triggers, or
- Short-term reactions.
As a result, the move lacks sustained participation. Without continued buying or selling pressure, the price returns to the level. These situations may turn into false breakout signals, in which the initial move appears valid but fails to hold.
4. Should I chase the first breakout candle?
Chasing the first breakout candle could lead to weak trade positioning. That’s because initial moves may occur without strong participation, making them fragile.
The better approach could be to wait for a retest. It provides more information about whether the breakout holds. If the price returns to the level and finds support or resistance, it usually confirms participation.
Sign Up Now
Latest Articles