See dow theory more clearly in real time.
Compare plans to access deeper market visibility for dow theory.
Trading Basics
October 22, 2024
Updated
SHARE
Understanding Dow Theory: The Foundation of Modern Market Analysis

Stock markets move in waves. One day, prices are soaring, and the next, they are dropping. But why? Interestingly, Charles Dow expressed similar views over a century ago. And, he has figured it out. His insights laid the groundwork for how we understand markets today. Dow Theory, born from his observations, still helps traders make sense of these ups and downs.
In this article, we will learn the history and development of the Dow Theory, starting with Charles Dow’s creation of the Dow Jones Industrial Average (DJIA) and his early market insights. We’ll explore the three key trends Dow identified (primary, secondary, and minor) and how they help traders spot long-term market movements and temporary corrections. We’ll also look at the contributions of William Hamilton and Robert Rhea, who expanded Dow’s ideas into a more structured theory.
Also, we will see how you can optimize your Dow Theory predictions by using it along with our advanced market analysis tool, Bookmap. Let’s begin.
The History & Development of Dow Theory
Charles Dow was an American journalist and economist. He is best known for co-founding The Wall Street Journal and establishing the Dow Jones Industrial Average (DJIA) in 1896. It must be noted that Dow’s experience as a financial reporter gave him unique insights into:
- Stock prices,
and
He noticed that the stock market often moved in trends and began writing editorials outlining his observations. Eventually, these observations became the foundation of Dow Theory. His main focus was on understanding how stock price movements could indicate broader economic trends.
The Development of Dow Theory
Dow’s believed that stock markets move in phases or trends. The three types of trends as observed by him are mentioned in the graphic below:
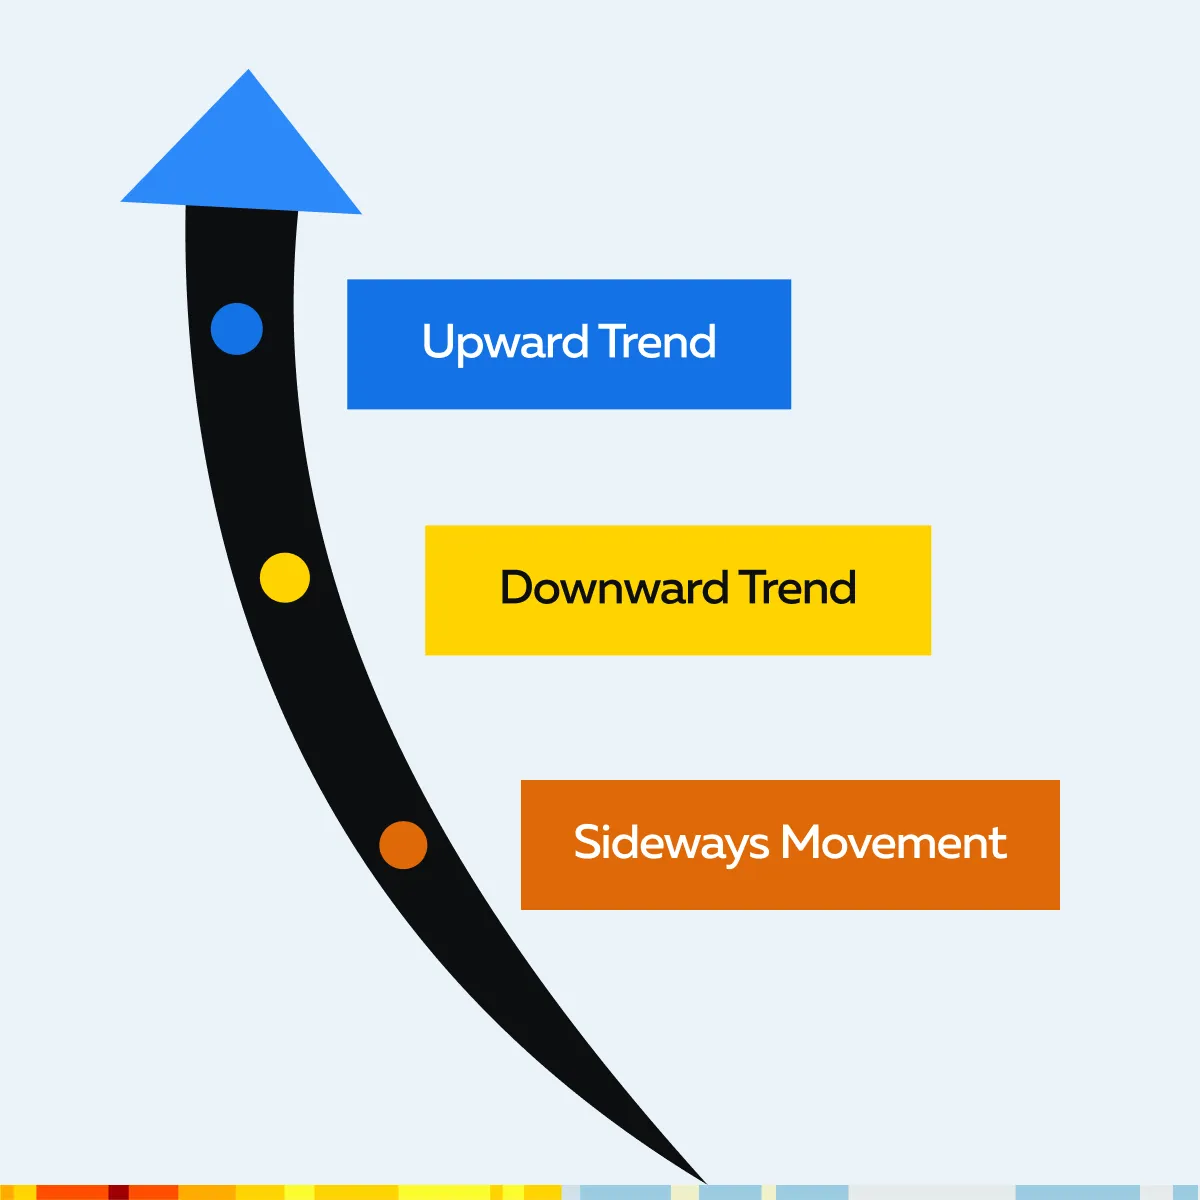
Moreover, he noted that stock prices (particularly industrial and transportation stocks) often moved together in these trends. Also, they signal the overall health of the economy. However, Dow did not formalize his ideas into a theory himself. His work focused on the market’s primary, secondary, and minor trends. These were foundational to modern technical analysis.
Contributions of William Hamilton and Robert Rhea
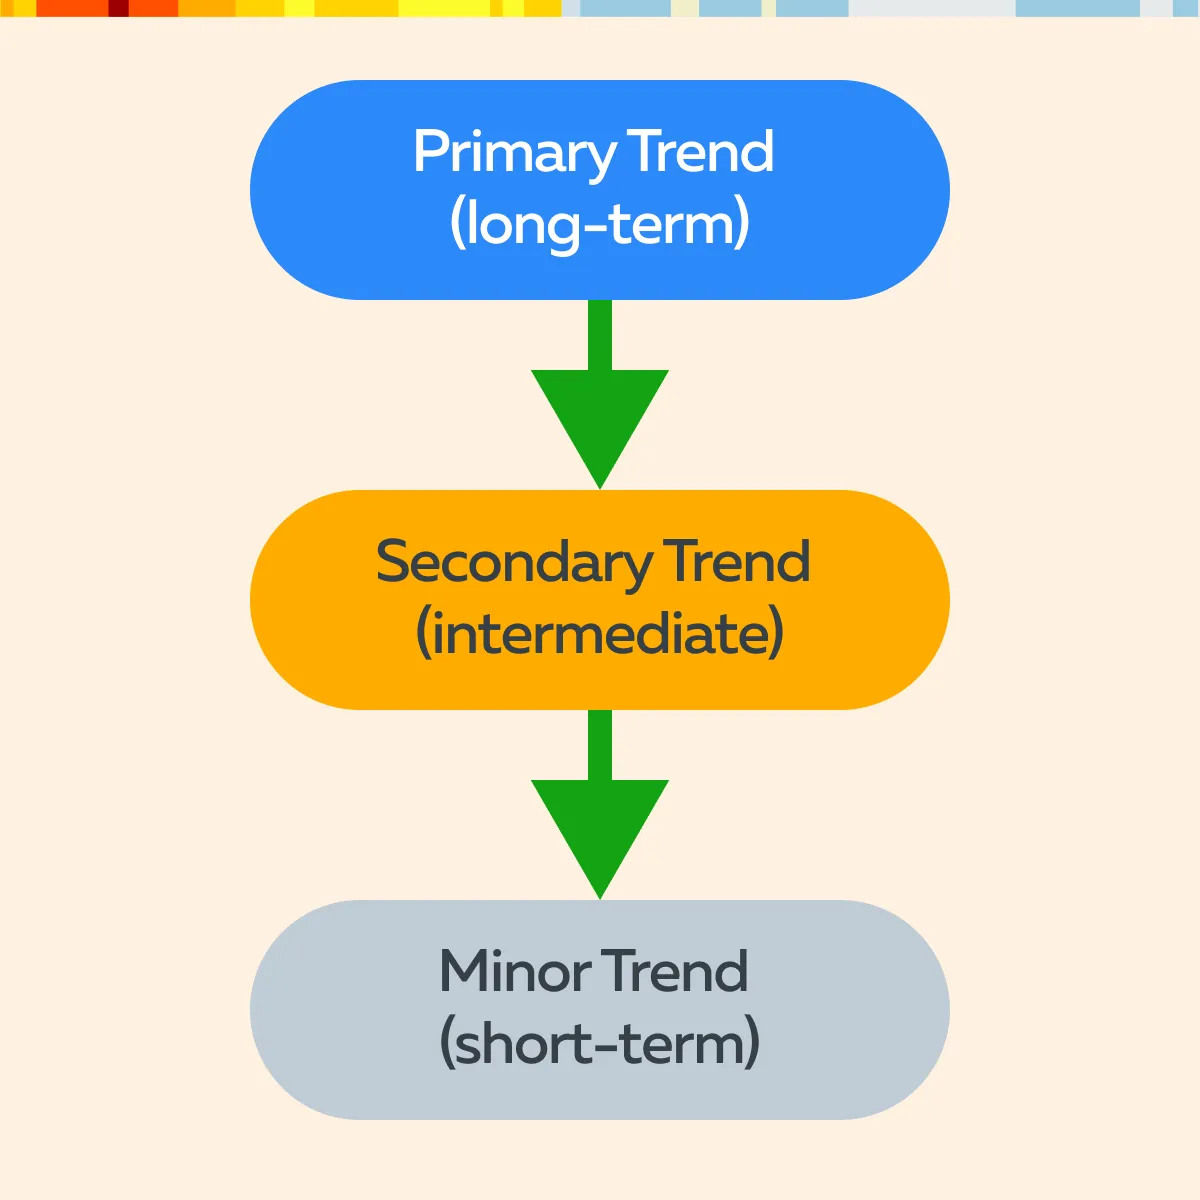
After Dow’s death, William Hamilton, an editor at The Wall Street Journal, continued to expand on Dow’s principles. Hamilton introduced the concept of market phases. See the graphic below:

He also clarified how different types of market participants influence price movements. His book, The Stock Market Barometer (1922), showed the importance of confirming trends between different market indices.
Additionally, Robert Rhea, another prominent analyst, took Dow’s and Hamilton’s work further. In the 1930s, Rhea formalized Dow Theory. See the graphic below to check what market trends exist:
Rhea’s interpretations made Dow Theory more accessible to traders and analysts. This also helped them use it as a tool for:
- Predicting market direction,
and
- Understanding cyclical trends.
Key Principles of Dow Theory
Dow theory states that the market is divided into primary, secondary, and minor trends. Let’s understand each trend type in detail:
- A) Primary Trends (Long-Term Market Moves)
According to Dow Theory, primary trends are the broad and long-term movements in the stock market. These trends reflect the overall direction of the market, which are mostly either:
- Bullish (upward),
or
- Bearish (downward).
It is worth mentioning that a primary trend lasts several years. It represents the market’s response to major economic changes, such as shifts in:
- Economic cycles,
- Policy changes, and
- Geopolitical events.
Most traders and investors focus on primary trends to make long-term decisions. That’s because these trends signify where the market is headed over an extended period. Let’s understand better through an example:
- During the 2008 financial crisis, the U.S. stock market entered a primary bearish trend.
- The prices were falling significantly over time.
- A trader observed the primary trend and avoided large losses by selling positions early.
Similarly, in 2009, when the market reversed into a primary bullish trend, a long-term investor noticed this trend and capitalized on the upward move. This resulted in significant gains over the next decade.
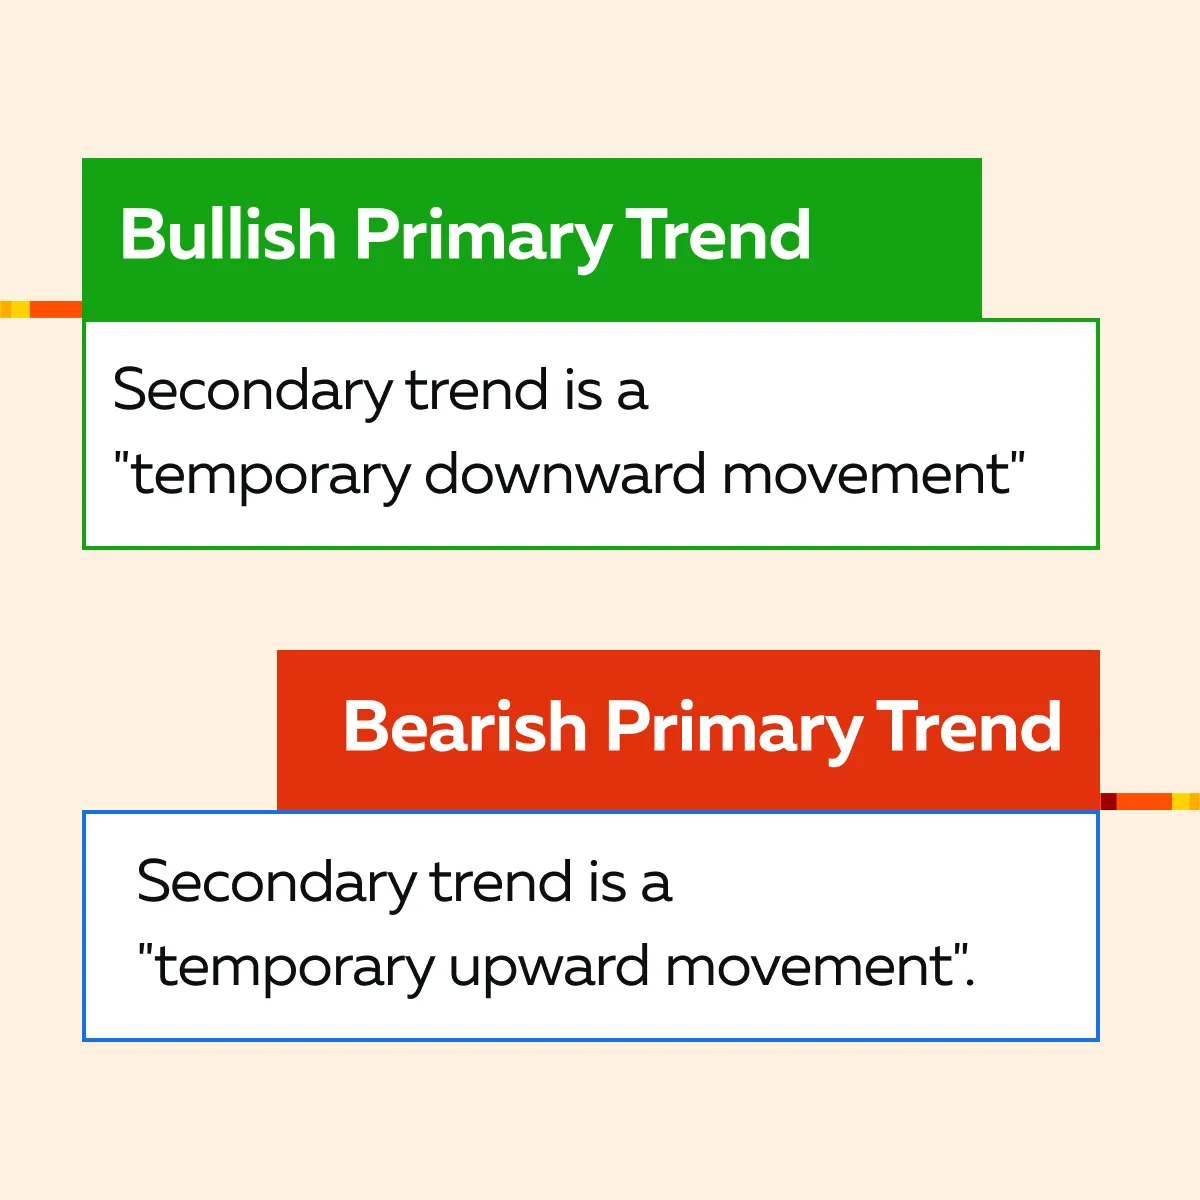
- B) Secondary Trends (Market Corrections)
Secondary trends are corrections. You can also call them retracements within the larger primary trend. They usually last from a few weeks to several months. Please note that in a bullish primary trend, a secondary trend also occurs, which is usually a temporary downward movement. On the other hand, in a bearish primary trend, the secondary trend appears as a temporary upward movement. See the graphic below:
One must be aware that these corrections usually involve a 10-20% price movement and help to “reset” the market before the primary trend continues. Moreover, secondary trends are important because:
- They provide opportunities for short-term traders,
and
- Allow long-term investors to buy or sell positions at better prices.
For Example, During the long-term bull market that followed the 2008 financial crisis, there were several secondary corrections, such as the market dip in 2011 due to the European debt crisis. An informed trader could have used this secondary trend to buy stocks at lower prices before the primary bullish trend resumed.
- B) Minor Trends (Day-to-Day Fluctuations)
Minor trends are short-term price fluctuations. They occur daily or weekly and are usually driven by:
- News events,
- Trader sentiment, and
- Technical factors.
Within the context of Dow Theory, these trends are considered “noise.” That’s because they do not impact the broader primary or secondary trends. Traders often look past minor trends when focusing on long-term investments. Also, they are important for day traders or those using short-term strategies.
For example,
- Say, on a given day, there is news of a corporate scandal or an earnings miss.
- This causes the stock to drop.
- However, this short-term trend is unlikely to affect the stock’s long-term primary trend.
- Day traders, however, attempt to profit from these short-term moves.
The Market Discounts Everything in Dow Theory
One of the core principles of Dow Theory is that the stock market reflects all available information. This means that stock prices at any given time account for all known factors. Commonly, these factors are:
- Economic reports,
- Earnings data,
- Geopolitical events, and
- Market sentiment.
Dow believed that any new information is quickly priced into the market as soon as it becomes available. The opinion implies that investors cannot easily “beat the market” by reacting to news since prices adjust almost instantly. Instead, traders should concentrate on understanding the underlying market trends to make informed decisions.
This belief is a precursor to the efficient market hypothesis (EMH). This theory also states that stocks always trade at their fair value. Hence, developing strategies based on predicting price movements from known information is largely “ineffective.” To understand better, let’s study an example of market reaction to earnings announcements:
- Say there is a company “XYZ Corp.”
- The current stock price before the earnings announcement was $100.
- Expected earnings per share (EPS) was $2.00.
- The company announced actual earnings of $2.50 (higher than expected).
- Now, XYZ Corp. beats the expected earnings (EPS of $2.50 vs. expected $2.00).
- This implies the company performed better than analysts predicted.
- Traders react immediately by buying the stock.
- They are anticipating future growth due to better-than-expected results.
- The stock price jumps from $100 to $110 within minutes after the earnings are released.
- The demand for the stock increases.
- This 10% price rise reflects the positive sentiment around the company’s performance.
Confirmation and Divergence in Dow Theory
To understand Dow Theory better, you must understand both the principle of confirmation and divergence. Let’s check them out:
Principle of Confirmation
This principle states that for a market trend to be valid, it must be confirmed by both The Dow Jones Industrial Average (DJIA) and The Dow Jones Transportation Average (DJTA). See the graphic below:
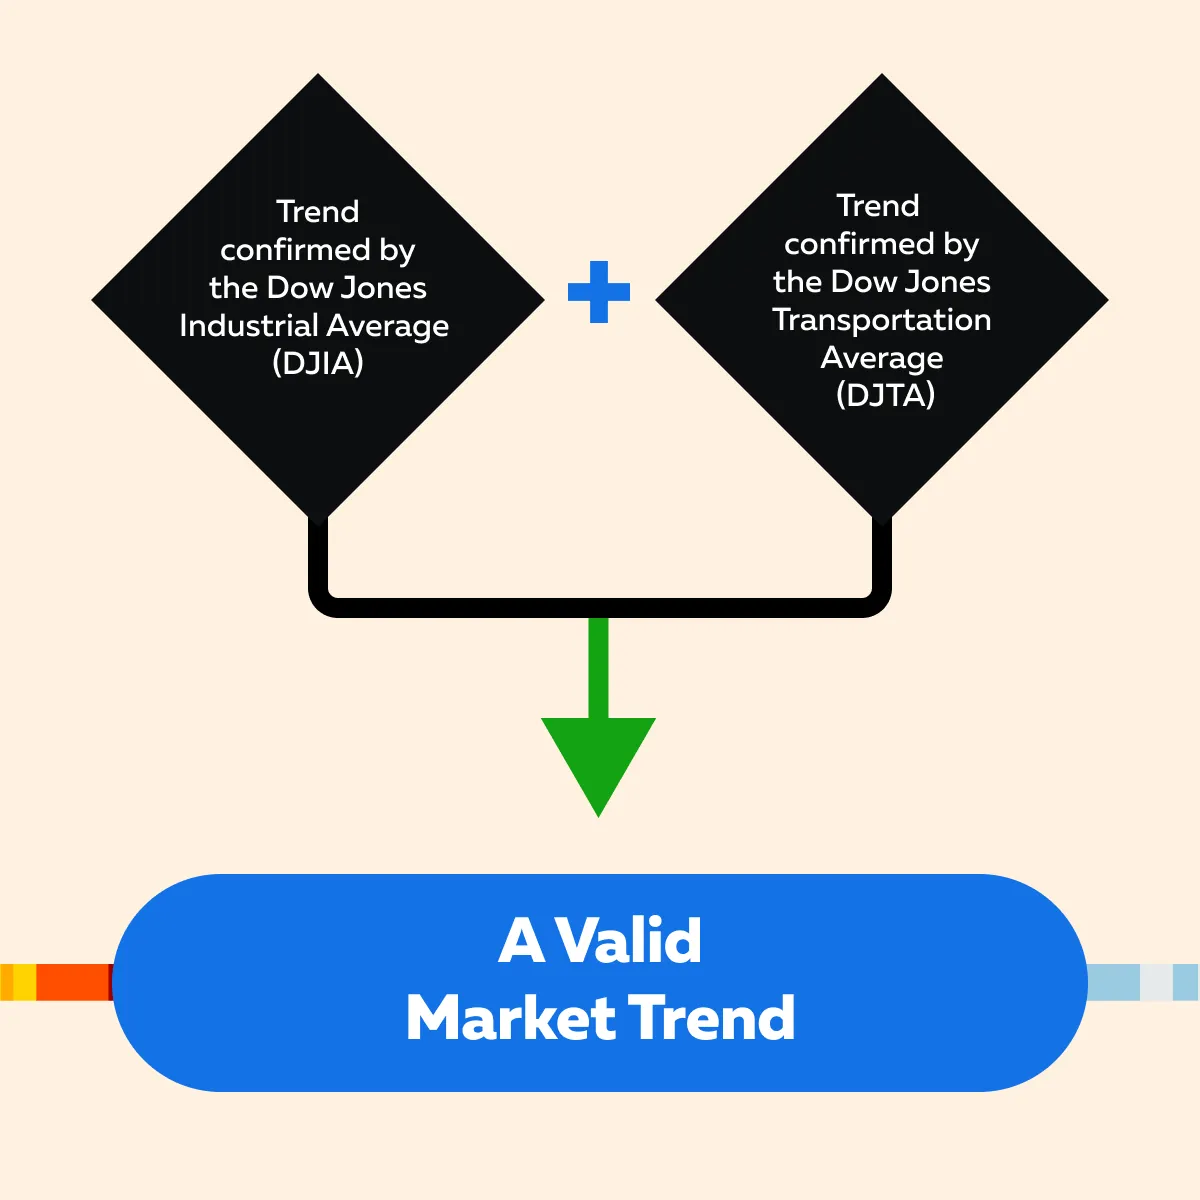
Now, be aware that the DJIA represents the broader industrial sector, while the DJTA tracks transportation stocks like railroads, airlines, and shipping companies.
According to this principle, if both indices are moving in the same direction, either upward in a bull market or downward in a bear market, then the market trend is considered strong and valid. This is because the industrial sector (producers of goods) and the transportation sector (movers of goods) are interconnected. For a healthy economy, both sectors must thrive together.
Divergence (Acts as a Warning Signal)
Divergence occurs when one index (DJIA or DJTA) reaches new highs or lows, but the other fails to follow suit. In such scenarios, Dow Theory indicates that:
- The market might be weakening,
or
- A reversal could be imminent.
If the DJIA is making new highs while the DJTA is lagging, it indicates that while industrial stocks are performing well, the transportation sector is not keeping pace. This disparity signals that the broader economic activity will not support continued growth. This will happen because goods production is not being matched by transportation or distribution.
For more clarity, let’s study the example of divergence between DJIA and DJTA:
- A notable example of divergence occurred in 2014-2015.
- During this time, the DJIA was hitting new highs.
- Indicating bullish sentiment in the market.
- However, the DJTA did not follow and started to decline.
This divergence raised concerns among analysts and traders. It indicated that while industrial companies were performing well, transportation companies were struggling. The lack of confirmation from the DJTA suggested that industrial gains were unsustainable.
- Shortly afterward, in 2015-2016, the market experienced a significant correction.
- This proved that the divergence was a warning signal of market weakness.
Dow Theory’s Role in Modern Market Analysis
Despite the evolution of financial markets and the rise of technology-driven trading, Dow Theory still helps in understanding broader market trends. Its emphasis on primary, secondary, and minor trends allows traders to:
- Identify the direction of the market over different time frames,
- Anticipate larger market movements, and
- Avoid being misled by short-term volatility.
Now, let’s understand the practical usage of Dow Theory in today’s modern world.
How to Use Dow Theory with Modern Indicators?
Modern traders use Dow Theory alongside more advanced technical indicators. This combination significantly enhances their market analysis. Some common indicators used alongside are:
- Moving averages,
- Relative strength index (RSI), and
- MACD (moving average convergence divergence).
These indicators are used to confirm trends indicated by Dow Theory. For example,
- Say both DJIA and DJTA confirm a bullish primary trend.
- Now, a modern trader uses RSI to check if the market is overbought.
- By doing so, they gain additional insight into whether the trend will likely continue.
This combination of Dow Theory’s big-picture analysis with specific technical tools helps traders more accurately assess when to enter or exit a position. Learn to spot market trends using Dow Theory with our advanced tools at Bookmap. Start here!
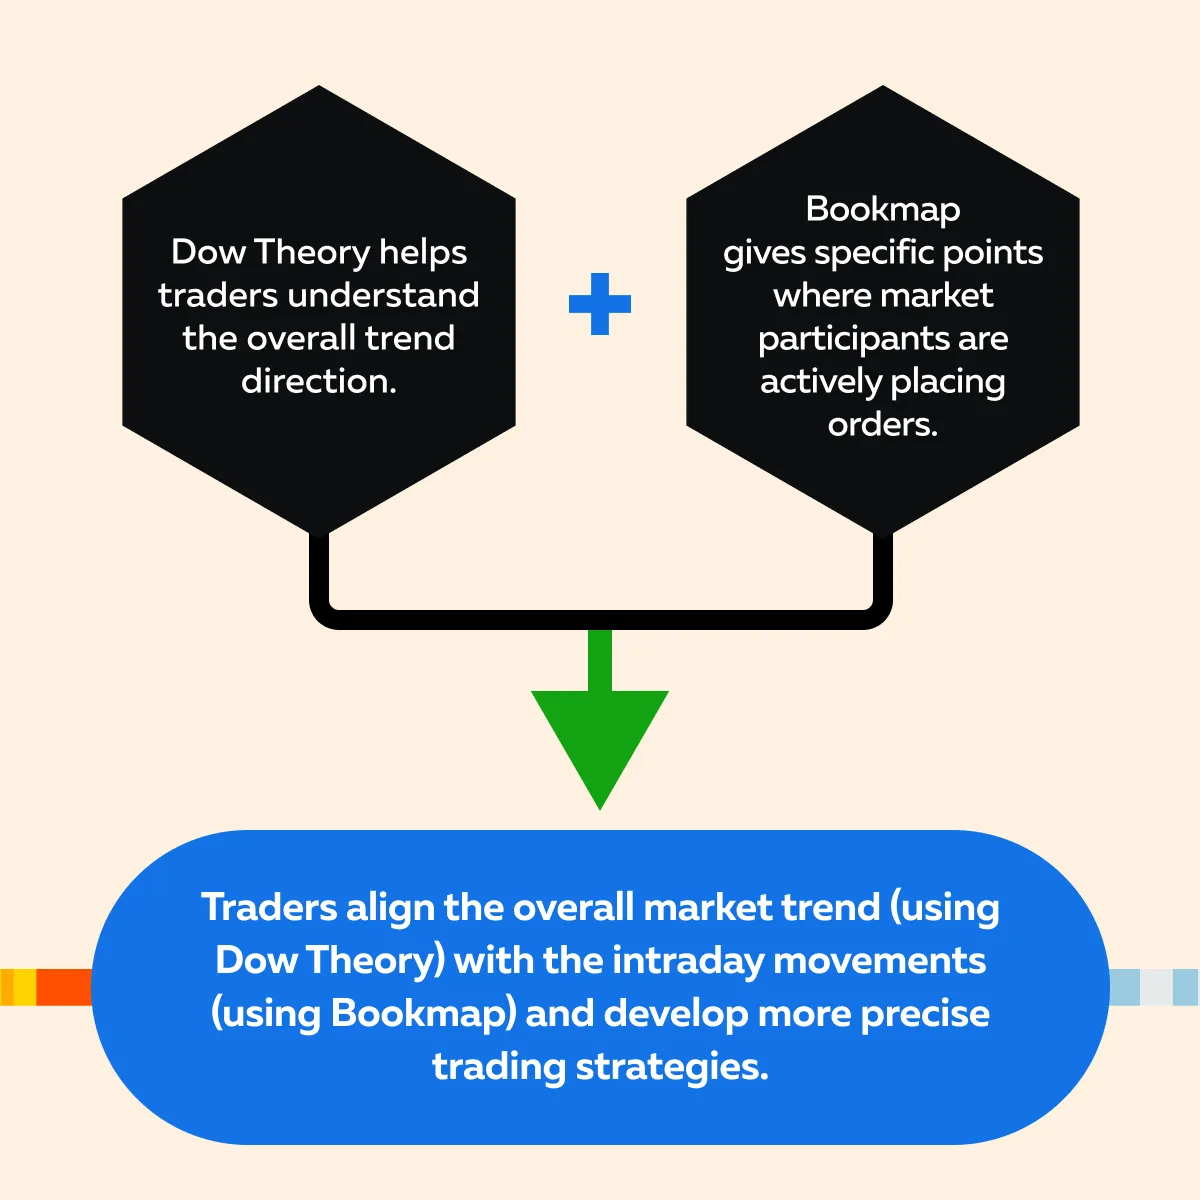
How to Combine Dow Theory with Advanced Tools Like Bookmap?
You can also combine the Dow Theory principle with our advanced market analysis tool, “Bookmap.” By doing so, you get an understanding of:
and
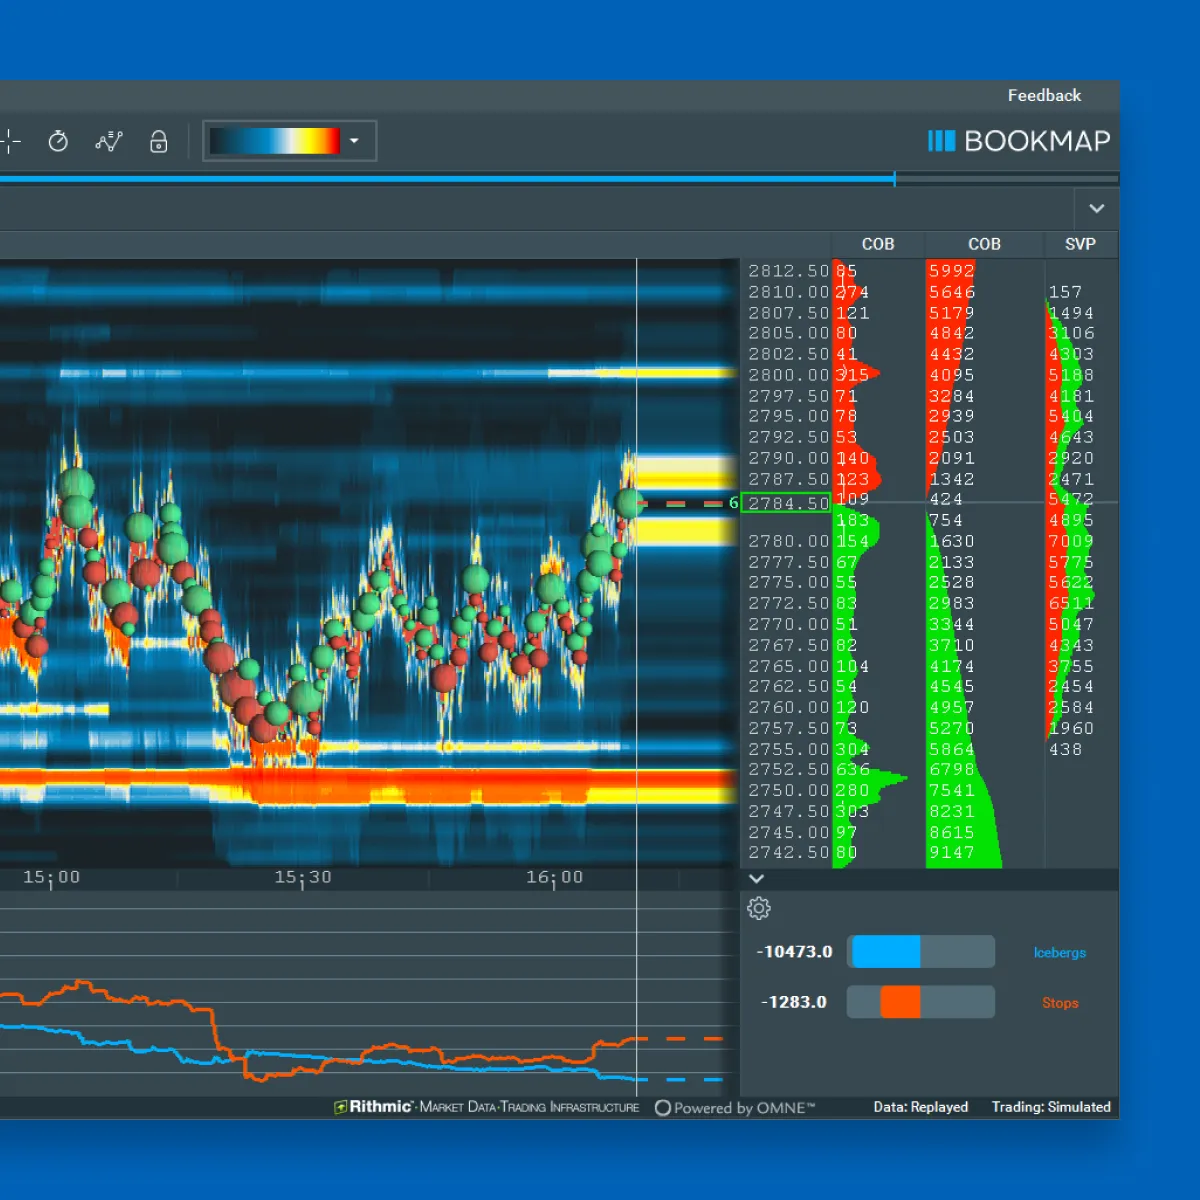
This understanding also helps you to comprehend the actual buying and selling activity at various price levels. Moreover, by combining Dow Theory with our detailed analysis at Bookmap, traders can gain both a macro and micro view of the market. For more clarity on combined usage, see the graphic below:
Additionally, to check the flow of buy and sell orders at each price level, traders can use our liquidity heatmap and real-time order flow at Bookmap. This data helps traders fine-tune their entry and exit points by identifying areas of:
or
- Support and resistance.
Therefore, traders must note that while Dow Theory provides a broader trend direction, real-time order flow highlights specific moments when it’s most advantageous to buy or sell. Use Dow Theory to enhance your market predictions with real-time insights from our platform. Sign up at Bookmap today!
Example of Dow Theory in Action
Dow Theory’s principles show how to identify market trends, including major bear markets. A clear historical example is the 2008 financial crisis, where the stock market experienced one of its most severe downturns. By applying the Dow Theory, traders and investors could have identified the early stages of the bear market before it fully unfolded. Let’s see how:
- A) Early Signs of the Bear Market
In late 2007, both the Dow Jones Industrial Average (DJIA) and the Dow Jones Transportation Average (DJTA) achieved new record highs. However, by early 2008, divergence began to appear between these two indices. While the DJIA continued to rise slightly, the DJTA began to lag, signaling trouble in the transportation sector. According to Dow Theory, this divergence suggested that economic weakness was emerging.
- B) Application of Dow Theory
By mid-2008, both the DJIA and DJTA were in clear decline. This confirmed the onset of a primary bearish trend. Traders who followed Dow Theory principles could have used this confirmation to adjust their portfolios. Consequently, it could mean selling off stocks or moving into defensive investments like bonds or gold.
Integrate Dow Theory with our modern tools at Bookmap for sharper market analysis. Join now!
Criticisms and Limitations of Dow Theory
One of the main criticisms of Dow Theory is its “lagging nature.” Because it depends on confirming trends in both the Dow Jones Industrial Average (DJIA) and the Dow Jones Transportation Average (DJTA), traders often identify a trend after it has already begun.
It must be noted that by the time a primary trend is confirmed, a significant portion of the market move could already have occurred. This delay can cause traders to miss the initial profits from a new trend. Therefore, this requirement of both indices to confirm a trend limits its timeliness in volatile or fast-moving markets.
Apart from this, Dow Theory’s applicability in short-term trading has always been criticized. That’s because Dow Theory is primarily designed for long-term market analysis. It focuses on primary trends that last months or years. This makes it less suitable for short-term or day trading, where traders are often more concerned with minute-to-minute price movements rather than broader trends.
Also, if short-term traders rely solely on Dow Theory, these factors can obscure their signals:
- Market noise,
- Minor trends, and
- Price fluctuations.
This makes Dow Theory challenging to apply in fast-moving environments.
Conclusion
Dow Theory is a fundamental approach that divides market trends into primary, secondary, and minor trends. It was developed based on Charles Dow’s observations about stock prices moving in phases. Later, William Hamilton and Robert Rhea formalized these ideas and made them more accessible for traders.
The core principles of Dow Theory, such as market trends, confirmation between indices, and the notion that the market reflects all available information, are still valuable today. However, Dow Theory has its limitations, especially in fast-moving markets, due to its lagging nature. To enhance market analysis, traders can also combine Dow Theory with our modern tools like moving averages, RSI, and real-time data analysis platforms at Bookmap.
By using our trading platform, Bookmap, traders get real-time order flow and liquidity insights. They can see precise buy/sell activity at various price levels. Moreover, by combining Dow Theory’s big-picture trends with our micro-level analysis, traders can time their entries and exit more effectively. Don’t miss out on your trading gains. Join us at Bookmap today!
Sign Up Now