Price Levels Indicator
What Is the Price Levels Indicator add-on?
The Price Levels Indicator add-on displays multiple price levels over a specific time interval, allowing traders to customize and track specific price movements and trends. For example, you can plot the highest and lowest traded price from the last 5 minutes to help you see the range in trading prices in that time period.
These price levels are super customizable, and traders can configure their name, color, and select specific price levels based on their percentage from the minimum or maximum traded price levels.
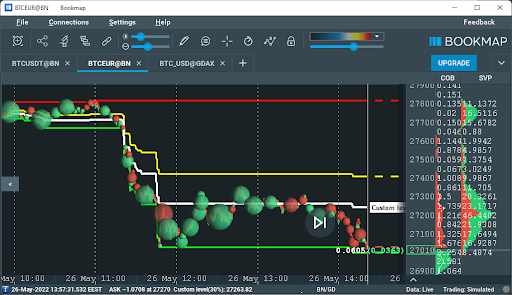
Three price levels are plotted by default:
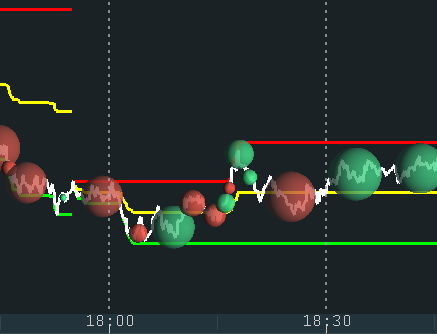
- Highest Price Level (100%) - The maximum traded price of an instrument over a specific period of time (red line on the above screenshot)
- Middle Price Level (50%) - The average of the maximum and minimum traded price over a specific period of time (yellow line on the above screenshot)
- Lowest Price Level (0%) - The minimum traded price of an instrument over a specific period of time (green line on the above screenshot)
How to Configure the Price Levels Indicator
Open the Configure addons dialog and select Price Levels.
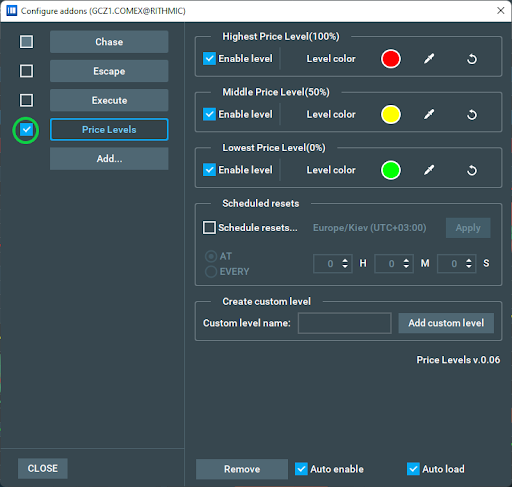
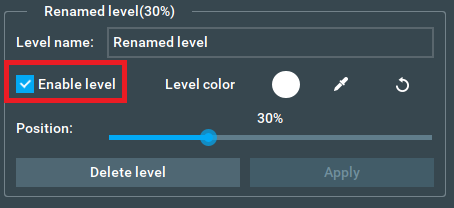
Enable Level
The Enable Level checkbox allows you to show or hide any price level from the main chart window. The highest (100%), middle (50%), and lowest (0%) levels are all enabled by default, but can be easily disabled by traders using this checkbox.
This "Enable" checkbox will also appear on any custom-created price levels, allowing you to toggle off price levels you’ve created without deleting them completely.

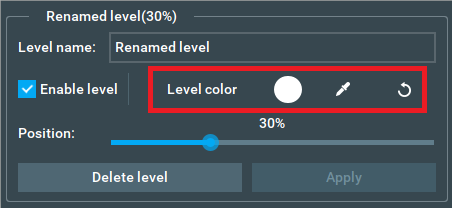
Level Color
The Level Color setting allows you to choose a color for each price level. This can be done for all price levels, and traders can either select a preset color, or use the color picker to click anywhere on their screen for a custom color.
Though any color can be selected, we recommend choosing contrasting, bright colors so that they show up well on the heatmap, and are easily distinguishable.

Scheduled Resets
The Scheduled Resets setting allows you to configure how and when price levels are reset.
There are two reset types:
- AT
- EVERY
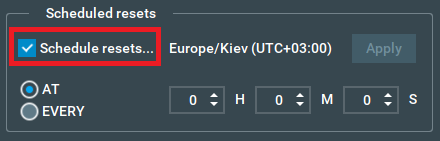
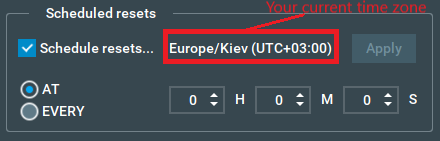
To start configuring Scheduled Resets you must first enable the "Schedule Resets…" checkbox.
AT Reset
The AT Reset allows you to reset the price level at a fixed time each day. You can specify the time using the Hours-Minutes-Seconds input boxes.
After specifying the reset time, press the Apply button.
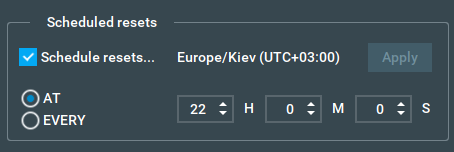
The above screenshot shows a reset time of 22:00:00 each day.
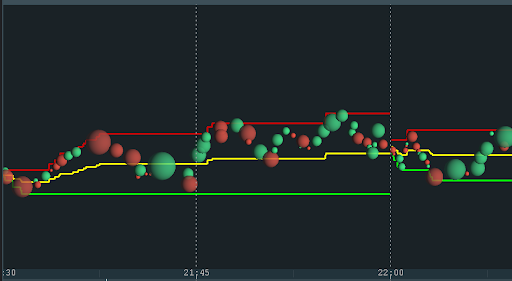
The above screenshot shows the price levels being reset at 22:00:00 on the main chart (heatmap disabled for clarity).
Alternatively, you can reset the price levels directly from the chart using the context menu.
- Right-click on the price level at the time you want to reset
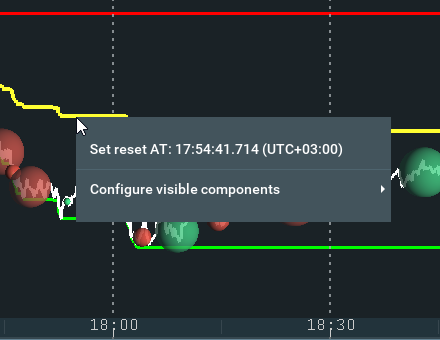
- Select the "Set reset AT..." option from the context menu
The price levels will now reset each day, at this selected time.
NOTE: The time is specified in your time zone and may be different from the time zone selected in Bookmap, your current time zone is displayed in the Scheduled resets configuration.
This setting is useful for day traders, or anyone wishing to focus on the broad market average for each day.
EVERY Reset
The EVERY Reset allows you to continually reset the price levels after a certain period of time (from the start of the day, when data was first loaded by Bookmap).
You can specify the exact time interval between resets using the Hours-Minutes-Seconds input boxes.
After specifying the reset time interval, press the Apply button to make sure your changes are applied to the instrument.

The above screenshot shows a reset interval of 5 minutes.
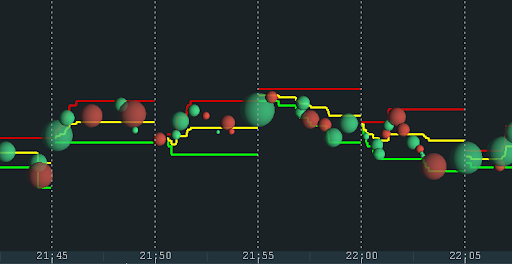
The above screenshot shows the price levels being reset every 5 minutes on the main chart (heatmap disabled for clarity). This setting mode is useful for more specified customization, as well as being perfect for traders who wish to see how the maximum and minimum trader prices shift throughout a shorter period of time.
Create Custom Level
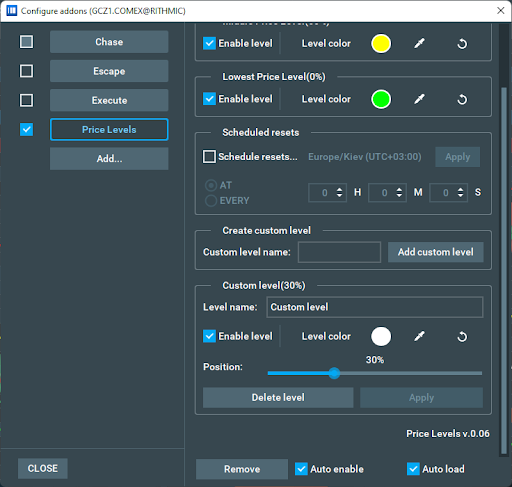
In the "Create Custom Level" section, you can add custom levels to your main chart. To do this, simply enter a name for your level and press the "Add Custom Level" button.
A panel will appear with the settings for your new custom level.
Level Name
The Level Name input box allows you to rename your custom price level at any time.
Note: You can only rename custom levels. You can’t rename the default levels (Highest Price Level, Middle Price Level, and Lowest Price Level).
To rename your custom level:
- Input your new name in the Level name field
- Press the Apply button
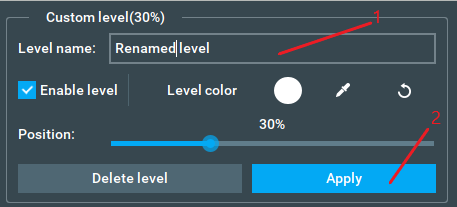
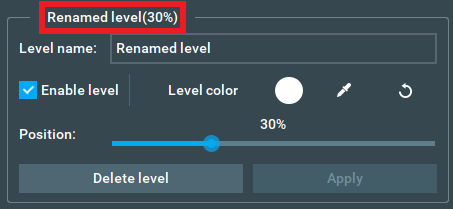
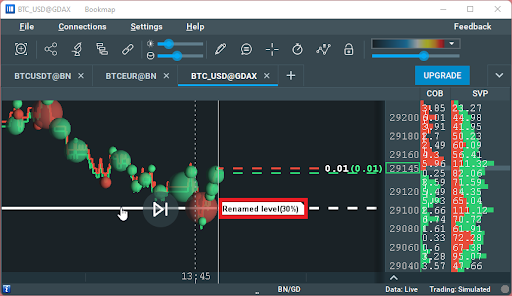
The custom level name will then update in both the settings panel and on the main chart.
Position
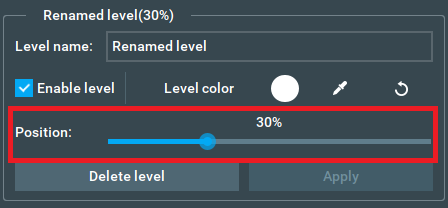
The Position slider allows you to change the position of your custom level, between the minimum and maximum traded price, and can be set to a specification of 1 decimal place..
- 0% = Lowest Price Level
- 100% = Highest Price Level
The value of the level is calculated according to the weighted arithmetic mean formula:
x(t) = MaxTrade(t) * p + MinTrade(t) * (1 - p)
Where:
- x(t) = Price of the level at time t
- MaxTrade = Maximum traded price at interval t0 to t
- MinTrade = Minimum traded price at interval t0 to t
- p = percentage value
Note: Interval t0 to t can be the time from when Bookmap started receiving data, or the time after the last reset.
To change the level position:
- Drag the Position slider to the desired value
- Press the Apply button
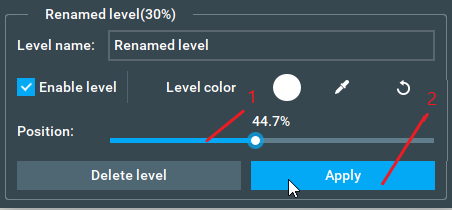
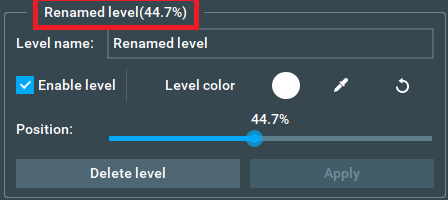
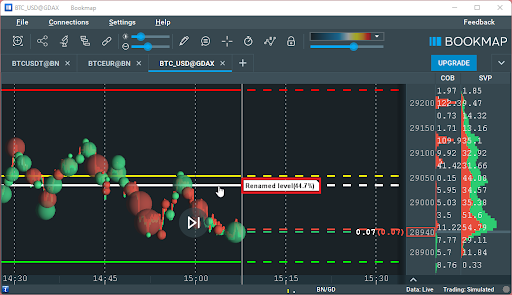
The custom level position name will then update to reflect its new price level in both the settings panel and on the main chart.
Delete Level
The Delete Level button removes the level from the main chart and deletes the setting panel for this level. If you want to disable the level but keep it for later, you can simply uncheck the “Enable Level” checkbox.
Price Levels Indicator FAQ
Will my settings save across all instruments?
No. Settings need to be individually configured for each instrument. This is to allow traders to completely customize each instrument, depending on what the instrument is being used for.
How many custom levels can I create?
There's currently a limit of 10 custom levels, in addition to the three default levels.
How to Install the Price Levels Indicator
To install the Price Levels Indicator, simply get Bookmap 7.4 and install it from the Add-ons Manager.
This add-on takes advantage of the new Add-ons Manager feature, which simplifies both the installation and updating process. If you'd like to learn more about the Add-ons Manager and how it can benefit your experience, please visit the following page.