Outside Liquidity
What is the Outside Liquidity Add-on?
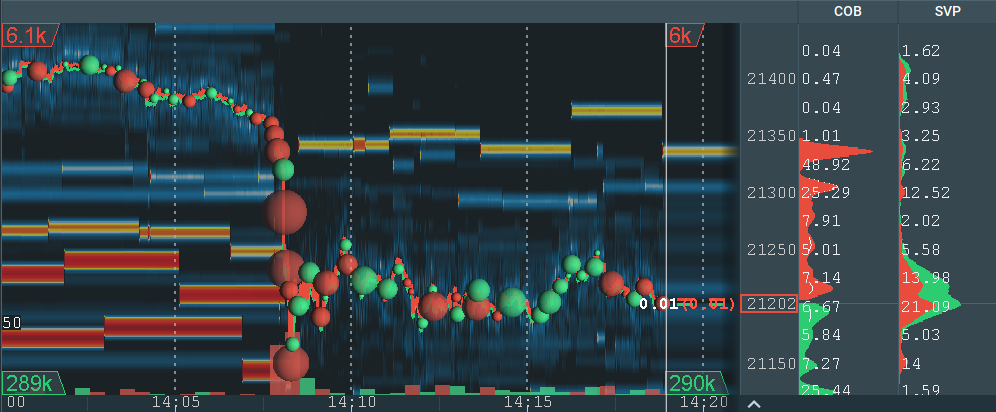
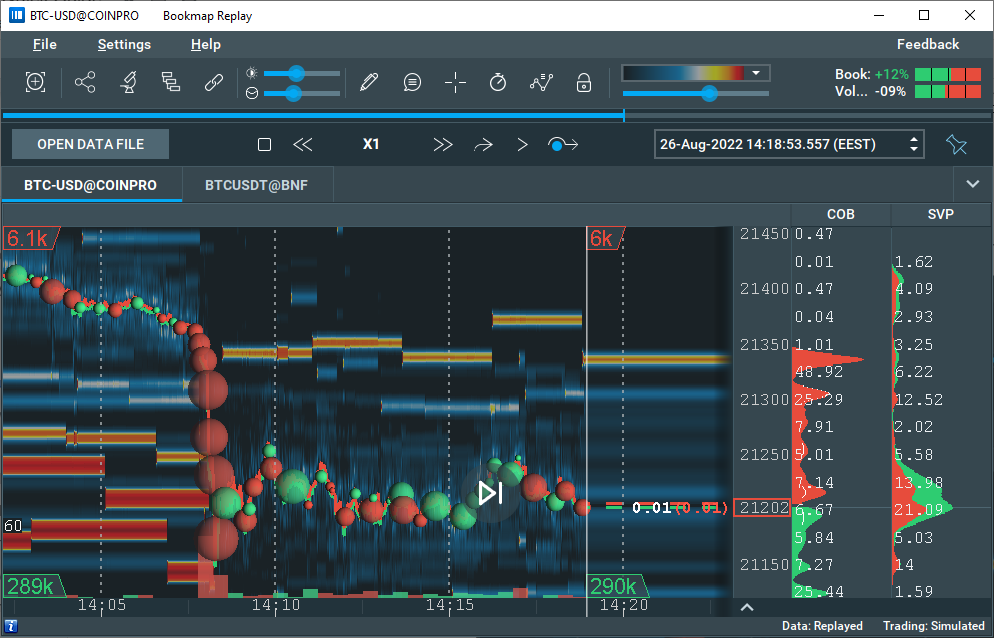
As the name suggests, this add-on shows liquidity that is outside the typically visible part of a heatmap. On the Outside Liquidity add-on you can see the difference between asks and bids displayed on the inside corners of any active heatmap.
The indicators on the inside corners to the left show the values that correspond to the time at the left end of the chart, thus indicating the liquidity levels at the first recorded time shown on the visible chart. The indicators in the right corners correspond to the timeline or the time on the right edge of the chart - indicating liquidity levels at that displayed time.
Installation instructions are below.
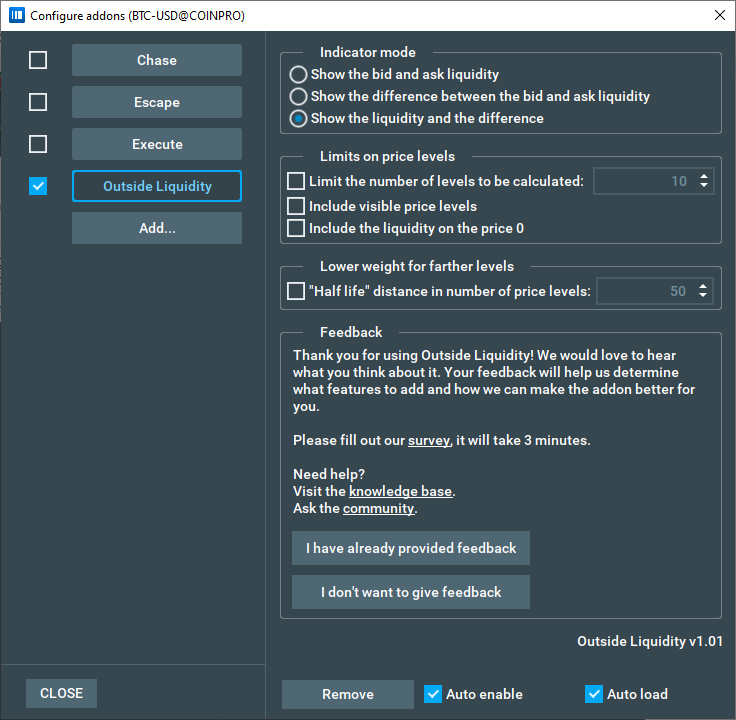
Configuration
Indicator mode
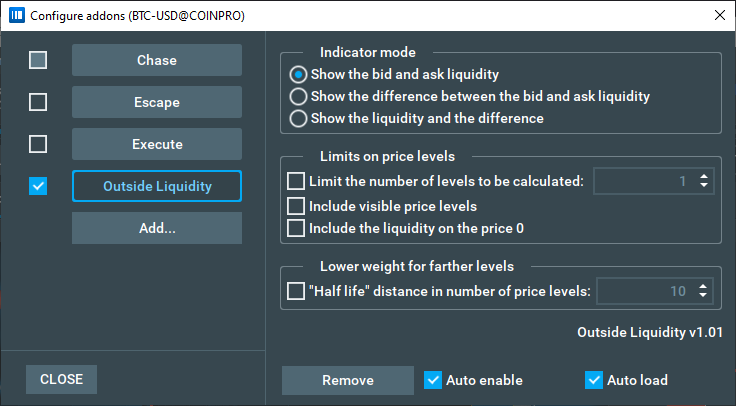
On this panel you can configure how indicators will be shown on your instrument. Only one mode can be selected at a time.
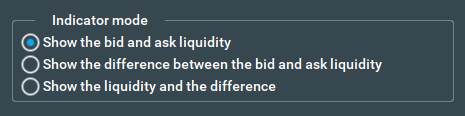
Show the bid and ask liquidity
With this checkbox selected, you will see standard indicators in the 4 corners of the active heatmap. The add-on will sum the size of every price level above the limit for the top indicators and price levels below the limit for the bottom ones, and display these sum results accordingly as the total bid and ask liquidity levels at different times.
By default, the limits are the first price levels above and below the visible screen, ensuring traders can easily visualize liquidity levels outside their heatmap’s scope.
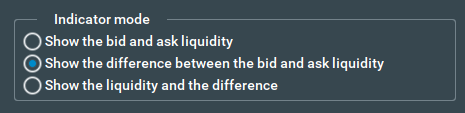
Show the difference between the bid and ask liquidity
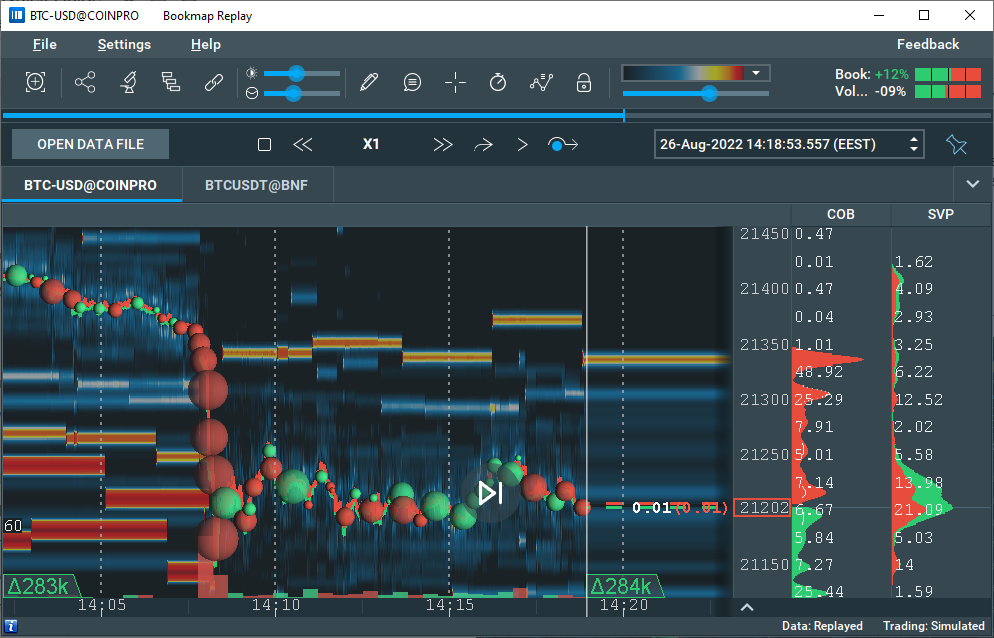
With “Show the difference between the bid and ask liquidity” selected, you will see only 2 indicators in the bottom corners of the active heatmap. These will show the delta of bids and asks.
If the bids liquidity is bigger, the icon will be green, otherwise, it will be red. The volume number indicates the difference in liquidity between the bids and asks, i.e. an icon displaying a green 283k indicates there is 283k more liquidity in bids than in asks.
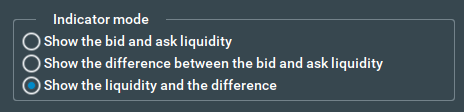
Show the liquidity and the difference
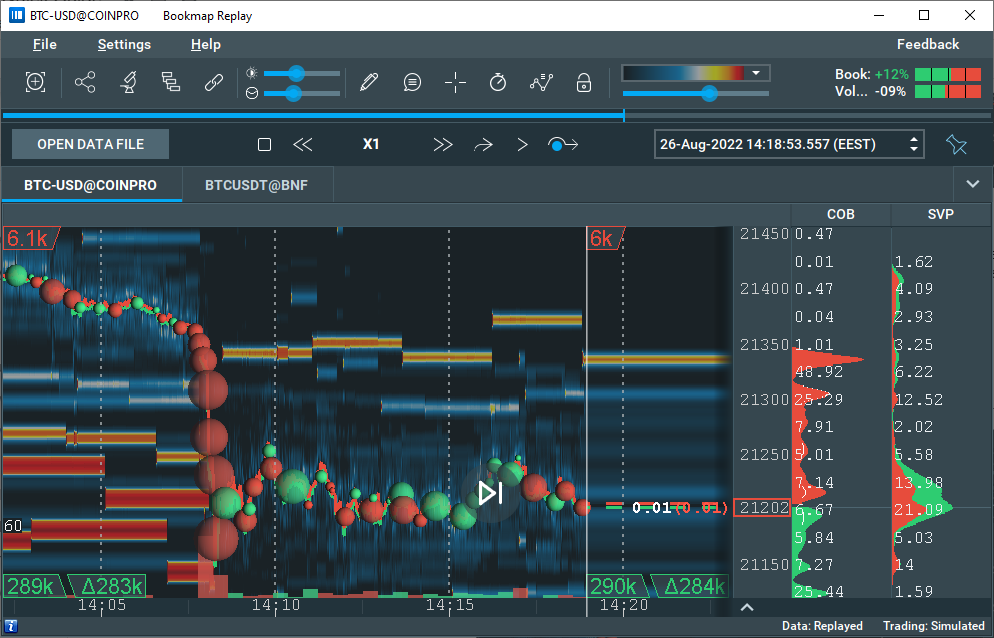
In this case, you will see the indicators from the previous two mods combined. The icons with the green triangle beside the number indicate the difference in liquidity as with the previous mode, while the icons with just the numbers display the individual bid and ask liquidity.
Limits on price levels
Here you can configure what price levels will be calculated and displayed on your heatmap.
Limit the number of levels to be calculated
When this is checked, only a limited number of price levels for bids and asks will be included in the calculations. You can select this number in the field to the left. In the example below, the add-on will include 10 levels above the screen and 10 levels below.

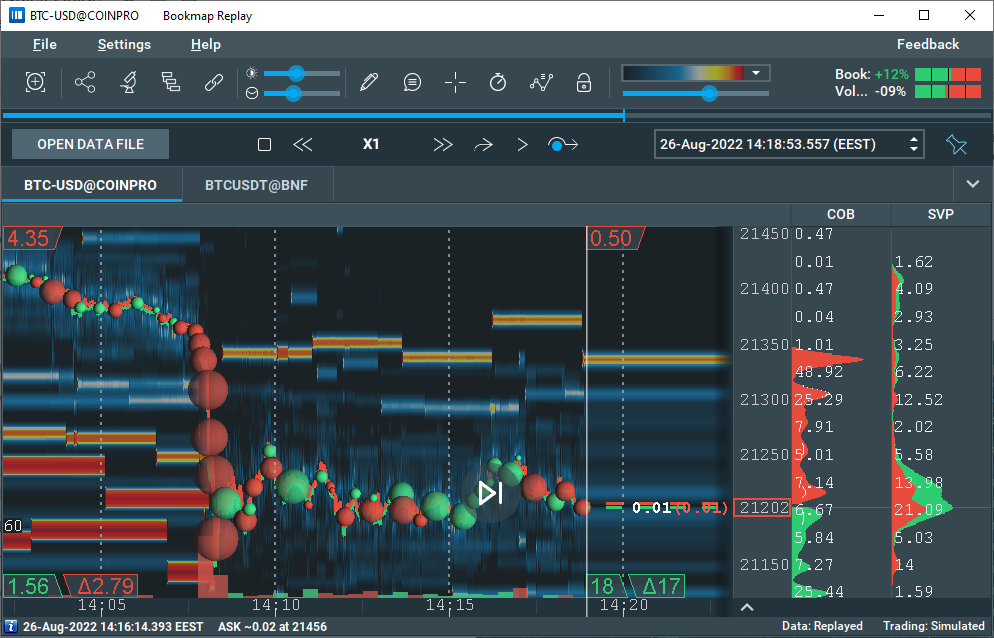
Include visible price levels
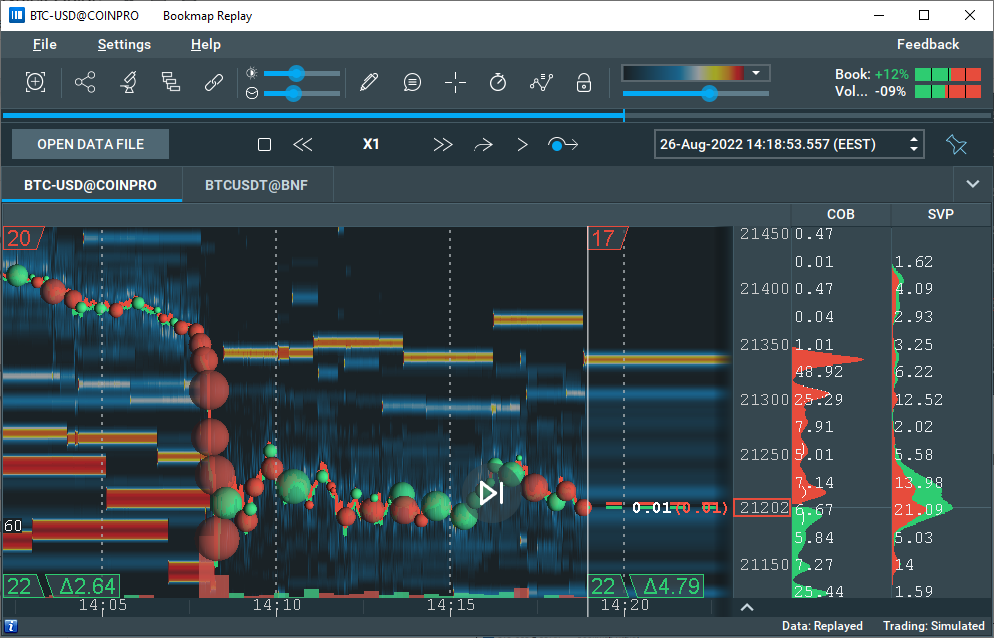
When checked, the add-on will Include bid and ask liquidity from the best bid and ask (BBO) levels so you can see the whole picture. For example, the settings below will cause the add-on to display liquidation totals of the first ten price levels from the BBO, whether those are visible or above and below the visible heatmap.
This means with only the first checkbox ticked, the Outside Liquidity Indicator will display liquidation totals starting from outside levels up to the configured limit. Ticking “Include visible price levels” will start calculations from BBO levels, while ticking the third will include liquidity on the price level of zero only if the other two limits reach that level.

Include the liquidity at the price of 0
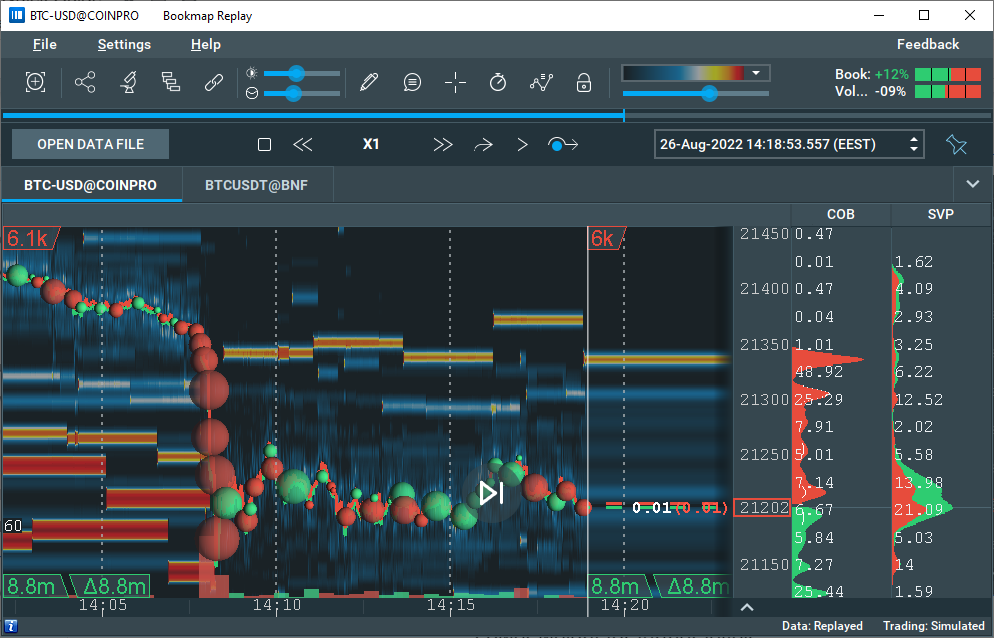
Sometimes there are some orders at the price of 0. The add-on doesn't calculate this level by default, but if you want to you can include it in the total result displayed on your chart.

Lower weight for further levels
"Half-life" distance in number of price levels
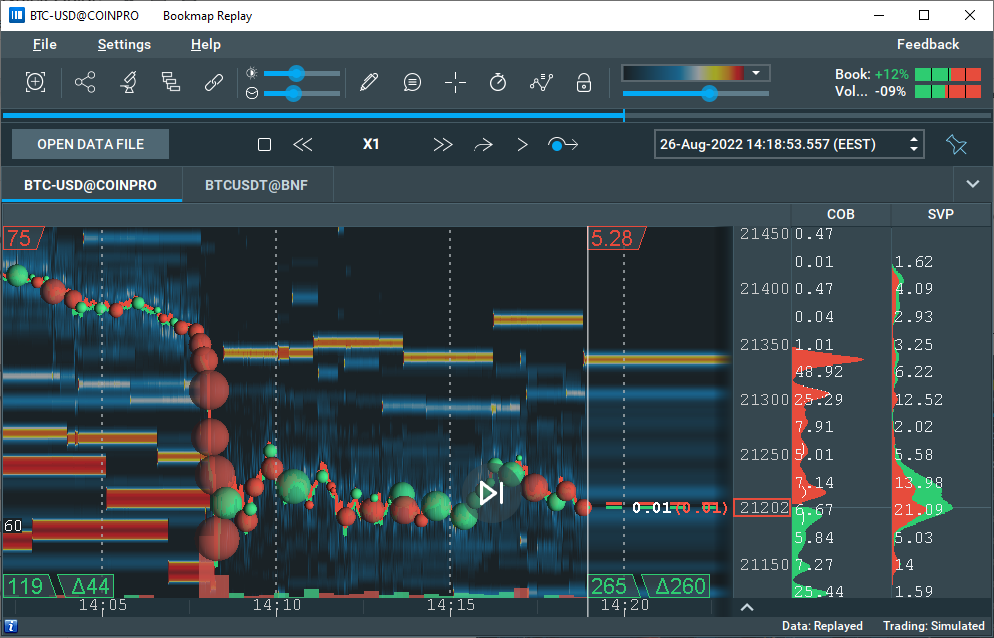
When checked, the weight of each bid or ask will gradually drop by half for every selected number of levels (one level is one tick size). You can select this number in the box to the right.

Feedback
We are constantly working on our add-ons to make them better, and we need your feedback to do so. After an hour of using the add-on, you'll see a reminder message. In this message, you'll find links to a survey and help resources. Please consider filling it out, as it will help us improve the add-on for you and all other users.
Outside Liquidity FAQ
Do the settings apply to one instrument or all of them?
You can configure settings for each instrument separately to customize each instrument exactly as needed.
Are there some limits in numeric fields in the configuration panel?
Yes, you can select only natural numbers in the range from 1 to 100`000.
Do I have to go back to this document every time I forget the setting descriptions?
No, you can see short tooltips for every element of a configuration panel. Just hover your cursor above the element for a second.
I have a question about Outside Liquidity. Who can I ask?
Feel free to ask any questions to our Discord community or contact support@bookmap.com
Installation
To install the Outside Liquidity Add-On, simply get Bookmap 7.4 and install it from the Add-ons Manager.
This add-on takes advantage of the new Add-ons Manager feature, which simplifies both the installation and updating process. If you'd like to learn more about the Add-ons Manager and how it can benefit your experience, please visit the following page.