Market Pulse
Free Algorithm To All Users
All Bookmap subscribers (Digital, Digital Plus, Global, Global Plus, and all others) can test-drive the Market Pulse Price Change algorithm for free!
If you have a free or paid Bookmap subscription, all you need to do is install the add-on.
What is the Market Pulse add-on?
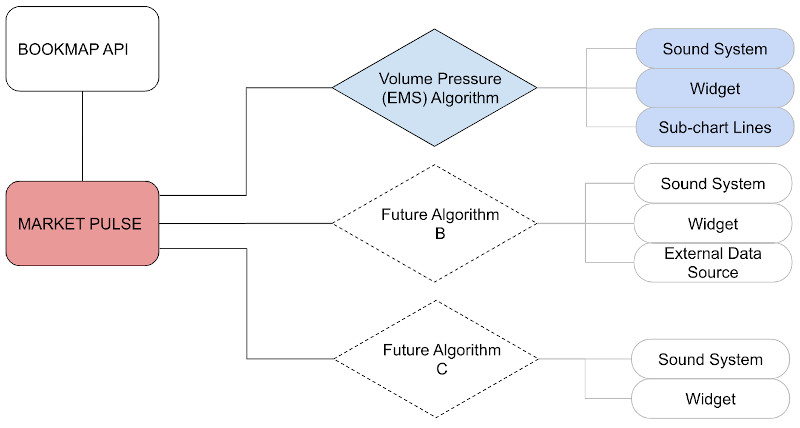
Market Pulse consists of multiple additional per-instrument widgets. Each widget measures and displays events that are generated by different sources, for example: order flow, order book, options, liquidations, or other events. Market Pulse allows you to monitor multiple instruments and gain a better understanding of market behavior, all in one place.
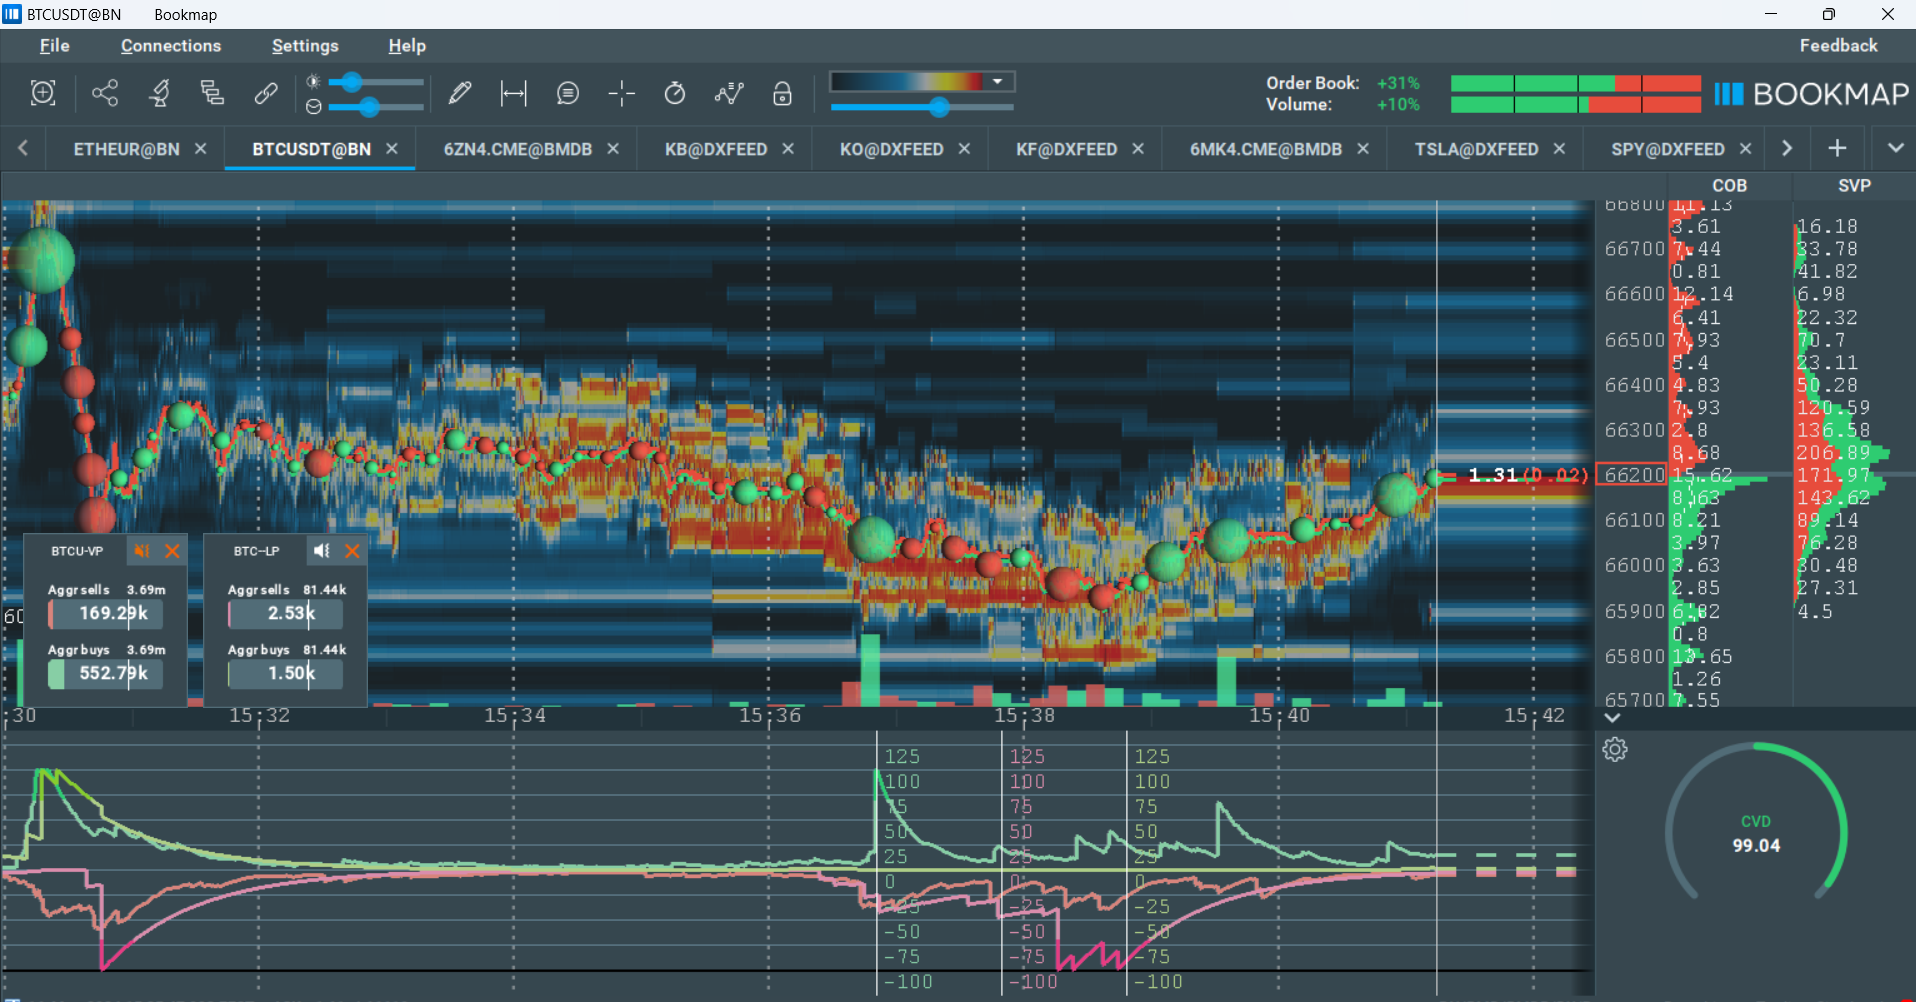
Each widget contains a unique algorithm. This algorithm processes the data based on a specific logic, and displays the output of the calculation both on the widget, and within the sub-chart. All algorithms include a notification system to notify users about a certain event, or to notify of the crossing of a threshold.
The data source for a Market Pulse widget may come from the subscribed Bookmap instruments, or from an external data source.
Because of this, Market Pulse is a powerful base for multiple insightful algorithms. Volume Pressure is one of them, for example.
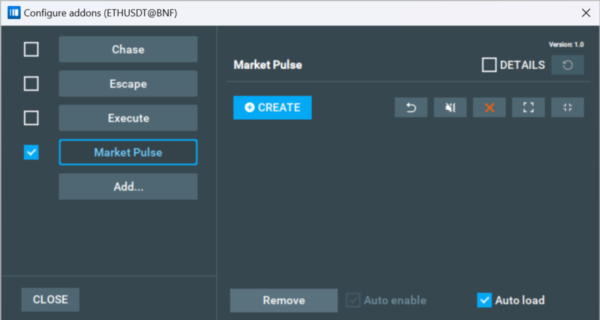
To download Market Pulse, simply follow this instruction. To know more about algorithm prices and how to purchase them go to this section this section.
Getting around this Quick Guide
| Section | Description |
|---|---|
| GO TO ➜ General control elements for all algorithms | There are common controls across all algorithms. Very useful to know, and a good place to start. |
| GO TO ➔ Widgets Panel | This section details the Widgets Panel. |
| GO TO ➔ Volume Pressure algorithm | This section details the control elements for the Volume Pressure algorithm. |
| GO TO ➔ Volume Pressure Imbalance algorithm | This section details the control elements for the Volume Pressure Imbalance algorithm. |
| GO TO ➔ Price Change algorithm | This section details the control elements for the Price Change algorithm. |
| GO TO ➔ Spread Change algorithm | This section details the control elements for the Spread Change algorithm. |
| GO TO ➔ Liquidation Pressure algorithm | This section details the control elements for the Liquidation Pressure algorithm. |
| GO TO ➔ Orderbook Pressure algorithm | This section details the control elements for the Orderbook Pressure algorithm. |
| GO TO ➔ Orderbook Pressure Imbalance algorithm | This section details the control elements for the Orderbook Pressure Imbalance algorithm. |
| GO TO ➔ Absorption Pressure algorithm | This section details the control elements for the Absorption Pressure algorithm. |
| GO TO ➔ Absorption Pressure Imbalance algorithm | This section details the control elements for the Absorption Pressure Imbalance algorithm. |
| GO TO ➔ Sweeps Pressure algorithm | This section details the control elements for the Sweeps Pressure algorithm. |
| GO TO ➔ Sweeps Pressure Imbalance algorithm | This section details the control elements for the Sweeps Pressure Imbalance algorithm. |
| GO TO ➔ Stops Pressure algorithm | This section details the control elements for the Stops Pressure algorithm. |
| GO TO ➔ Icebergs Pressure algorithm | This section details the control elements for the Icebergs Pressure algorithm. |
| GO TO ➔ Orderbook Imbalance algorithm | This section details the control elements for the Orberbook Imbalance algorithm. |
| GO TO ➔ Pace of Tape algorithm | This section details the control elements for the Pace of Tape algorithm. |
| GO TO ➔ Pace of Tape Imbalance algorithm | This section details the control elements for the Pace of Tape Imbalance algorithm. |
| GO TO ➔ Multi Algo | This section details the control elements for the Multi Algo algorithm. |
| GO TO ➔ Quick start and FAQ | To focus on Volume Pressure and answer any questions you might have overall, head to this section and get to grasps with Market Pulse. |
| GO TO ➔ Installation | This section is for those who are totally new to Bookmap, and breaks down exactly how to install add-ons. |
General control elements for all algorithms
This section contains a description of the algorithm-independent controls that all widgets will have.
General control elements
Refresh custom resources
This feature is not implemented yet. Once you've added custom resources, you can press the refresh button to make sure they appear in your Market Pulse. Read more in the How to load custom sounds and How to load custom algorithms sections.
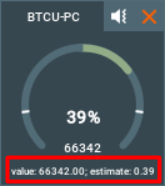
Details

When selected, you will see additional information at the bottom of your widgets. This information generally only needed for debugging purposes, so you should rarely need this control.
Expand/collapse all
These buttons allow you to expand/collapse all widget configurations across your Market Pulse add-on. This is much faster than expanding/collapsing panels one by one, and is helpful for clearing up a cluttered screen without permanently deleting widgets.
Close all widgets
This button closes all working widgets, and is much faster than closing them one by one.
Mute all widgets
This button mutes all working widgets. It is much faster than muting widgets one by one, and is especially valuable if excess sound notifications are annoying you, or you want your device to be quiet for a moment.
Reset all widgets to default positions
This button resets the position of all the working widgets to default. Using this you can find widgets you have lost on your screen, or more easily pull them together into a new group.
Create widget configuration
This button will create a new widget configuration. You need to select a data source (either one of the subscribed instruments or an external data source) and one of the available algorithms. New widgets are not started by default.
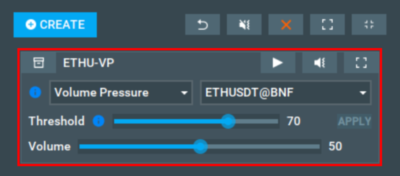
Individual widget control elements
Remove widget configuration
This button will delete the widget (even while it is active), along with its configuration panel.
Start/Stop widget
This button starts and stops the widget. Press this button after selecting the data source, algorithm and configuring its main parameters to activate the widget. Keep in mind that when starting the widget, the data will be reloaded, which can be time-consuming. After the widget is started (active), the button will become a stop button. The stop button will stop all calculations, hide the widget, and remove the sub-chart lines.
Mute/Unmute widget
This button will enable or disable the sound alerts for a specific widget, while the widget is still active and visible.
Expand/Collapse widget configuration panel
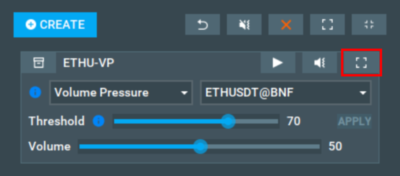
This button controls the view of the panel. There are quick settings in the collapsed view, but if you want to fully configure the widget and the algorithm, you will need to expand it.
Algorithm selection
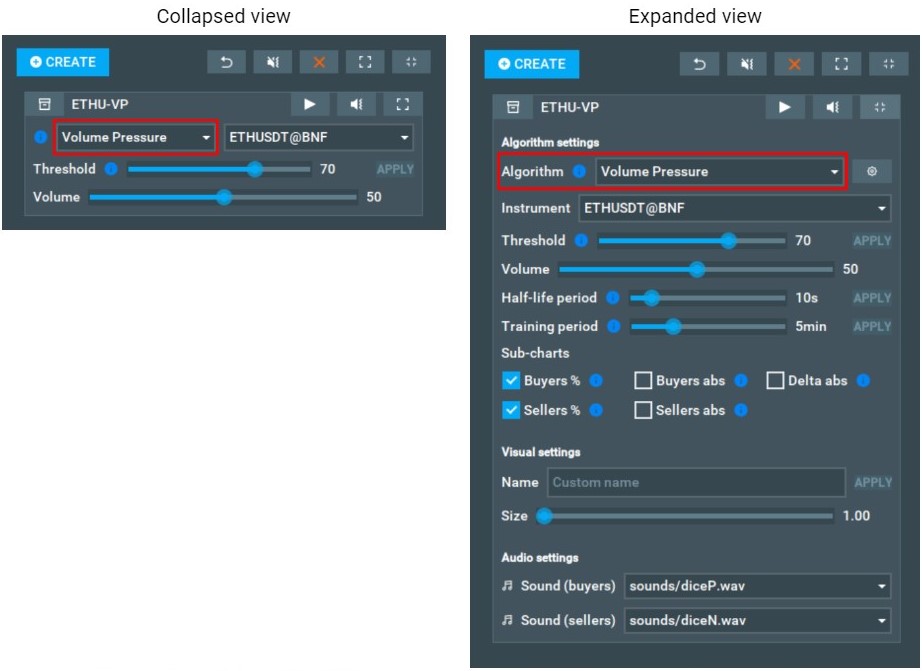
Algorithms can be selected on both the collapsed and expanded views. Each algorithm has its own configuration parameters, so panels may look different depending on the algorithm in the widget.
Check the Algorithms section for a list of all available algorithms.
In the expanded view, there is a cog button to the right of the Algorithm combobox. This is the configuration reset button. It will reset all the widget’s settings to default values, as well as restarting it.
Single instrument (data source) selection
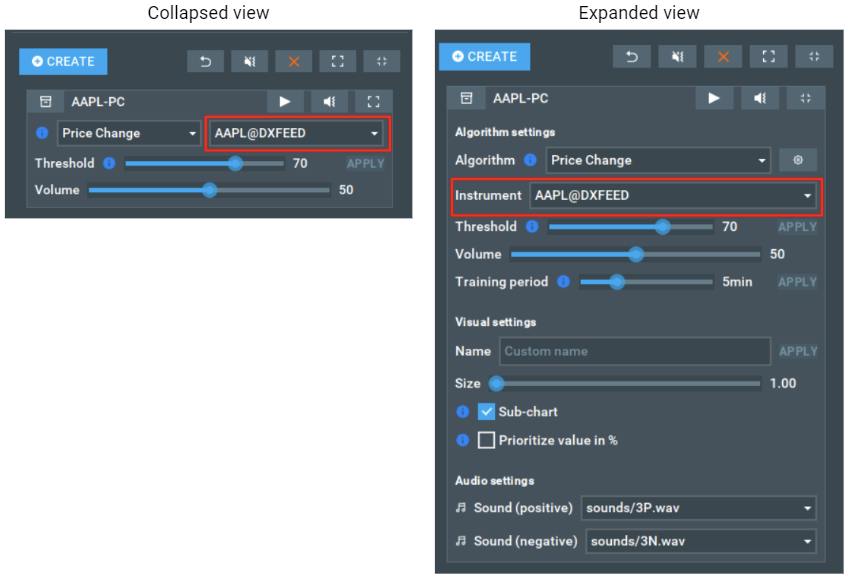
The data source for the widget may be selected from the list of subscribed Bookmap instruments, or from a custom external data source.
Multiple instrument (data source) selection
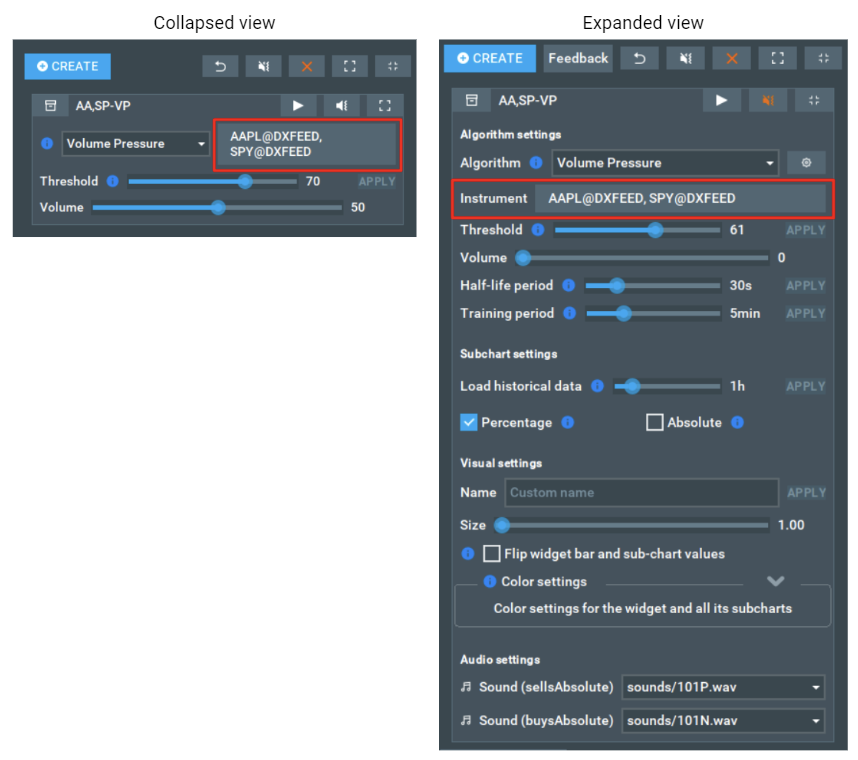
A set of data sources for the widget may be selected from the list of subscribed Bookmap instruments. At least one data source must be selected.
Name
Only the expanded view has this configuration item, meaning you will need to expand the widget to edit the name.
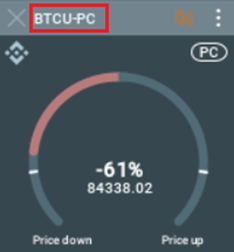
It is possible to have tens of algorithms for tens of instruments, and by default the generated name is the combination of the instruments and the algorithm used. For example: BTC-USD@COINPRO Volume Pressure may be one name. As you can see, it is pretty detailed and it is not possible to distinguish 2 widgets with the same algorithm and instrument with the default name.
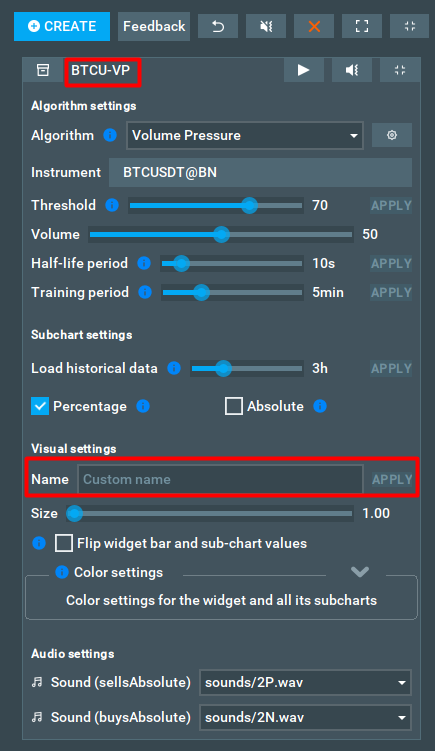
That is why there is an option for you to set your own custom widget names. This custom name will be shown on the configuration panel, on the widget, on the sub-chart line, and in the Alert settings.
To set your custom name for a widget, just click on the custom name box under Visual settings and type whatever you would like.
To reset a name to default, simply remove everything from the name text field.
Size
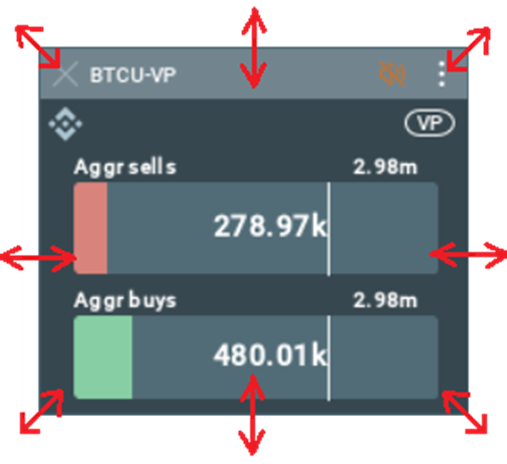
You can change the width and height of the widget by hovering the mouse over any corner or side of the widget, and then, after changing the cursor, holding the mouse and pulling.
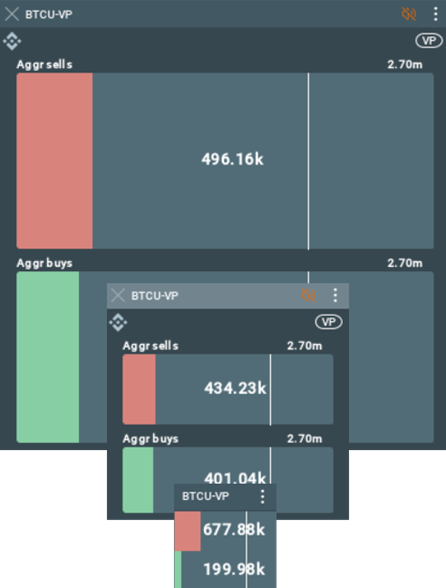
You can resize the Widgets Panel in the same way.
Threshold
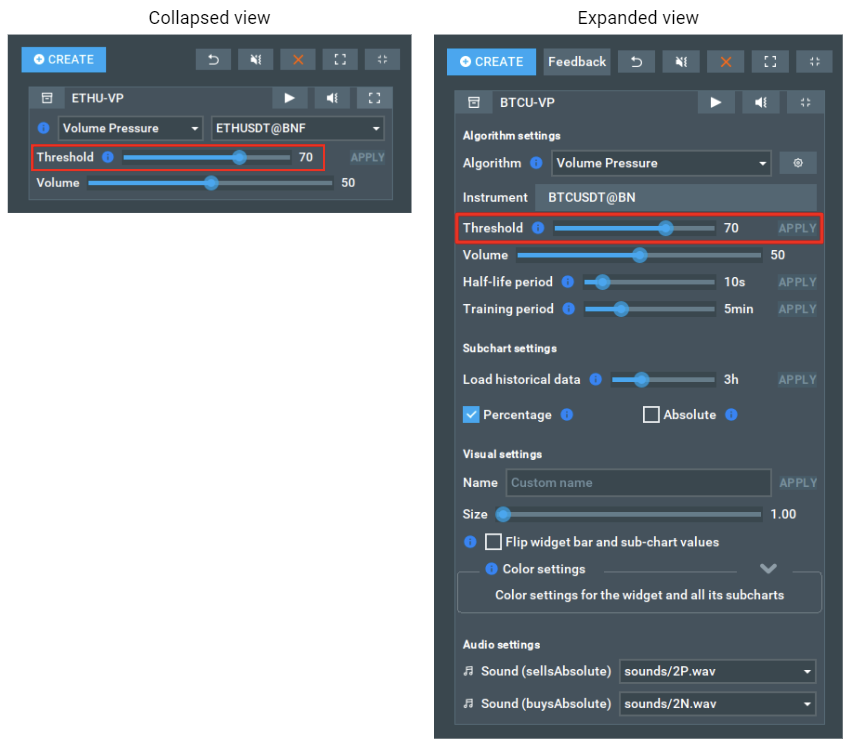
This slider defines the minimum threshold for a sound to be played as a percentage value. The higher this parameter, the fewer sound notifications that will be played.
Read more: How do I configure the threshold? How could a sub-chart line help me to do that?
Widgets of different algorithms have their own threshold visualizations. Read more in Widget structure
Flip widget bar and sub-chart values
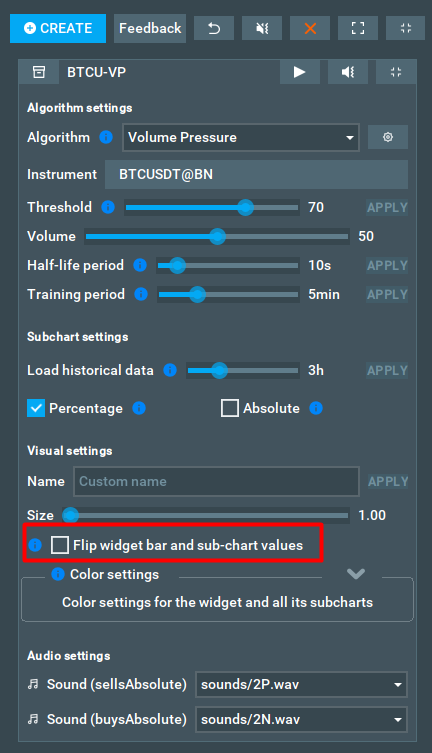
If the checkbox is enabled, the sides of the events will be inverted. Events that were originally considered bids will become asks and vice versa. The name, color, and location of the bars will not change however.
For a single widget, enabling the checkbox will change the direction of the trend (the values will be inverted, positive values will become negative, and vice versa). The corresponding subcharts will also be redrawn accordingly.
The checkbox is disabled:

The checkbox is enabled:

For a double bar widget, the values in the bars and subcharts are swapped.
The checkbox is disabled:

The checkbox is enabled:

Color Settings
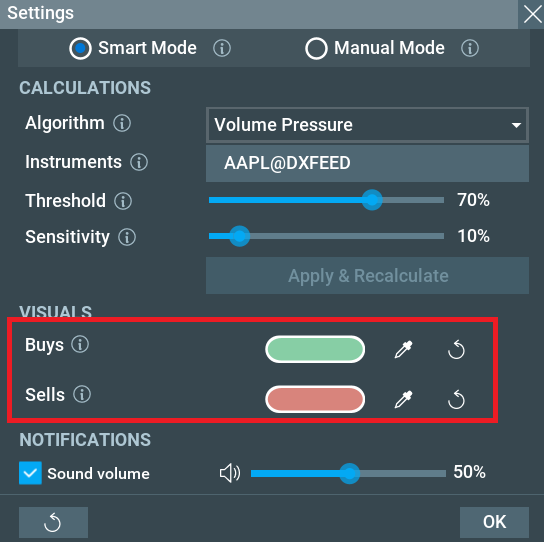
These settings allow you to select and apply specific colors to sub-charts and widget bars or circles, helping to effectively differentiate data and provide better visibility giving a personalized experience for your interpretation of the data.
Market Pulse will calculate the color for values that cross the threshold based on the base color.
The color settings panel is collapsed by default, and you need to click the [v] button to expand it.

Audio files
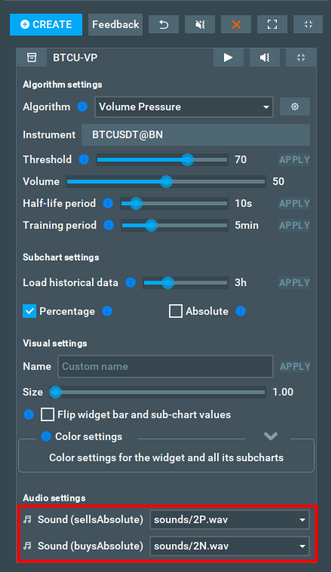
Audio files are used for sound notifications. Different sound files can be set for positive/negative values, such as being based on buyers/sellers.
Currently, it is not possible to add your own custom sounds. We will add the ability to load custom audio files in the future.
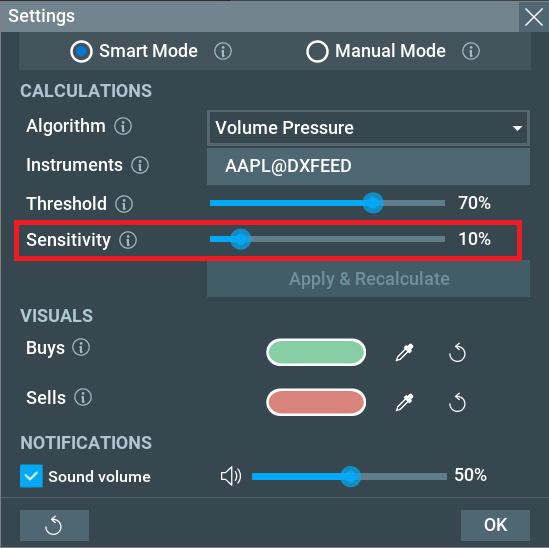
Sensitivity
This setting provides a simplified way to adjust the program's sensitivity. It automatically controls two advanced parameters: the Half-life period and the Training period. Changing this parameter will change the half-life and learning period, and vice versa. This setting is only available in the widget settings window, which you can open using the Widget popup menu.
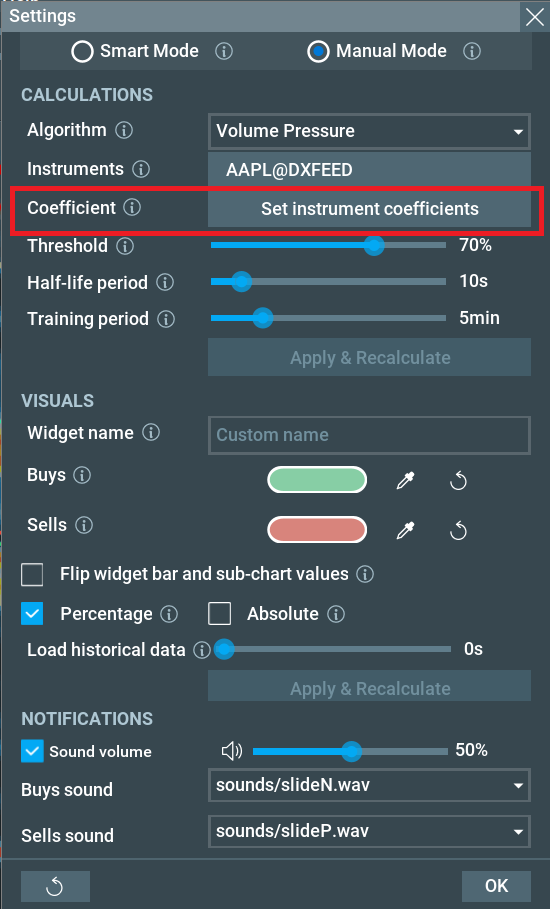
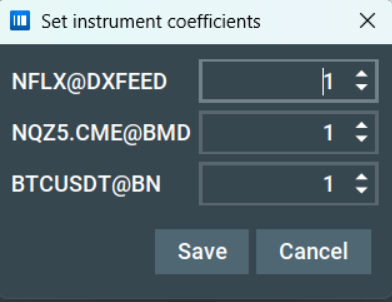
Coefficient
This setting allows you to determine the influence of each instrument on the widget value. For example, an instrument with a coefficient of 1.0 has a standard influence, while an instrument with a coefficient of 0.5 will have half the influence on the widget value. This setting is only available in the widget settings window, which you can open using the Widget popup menu.
Audio files
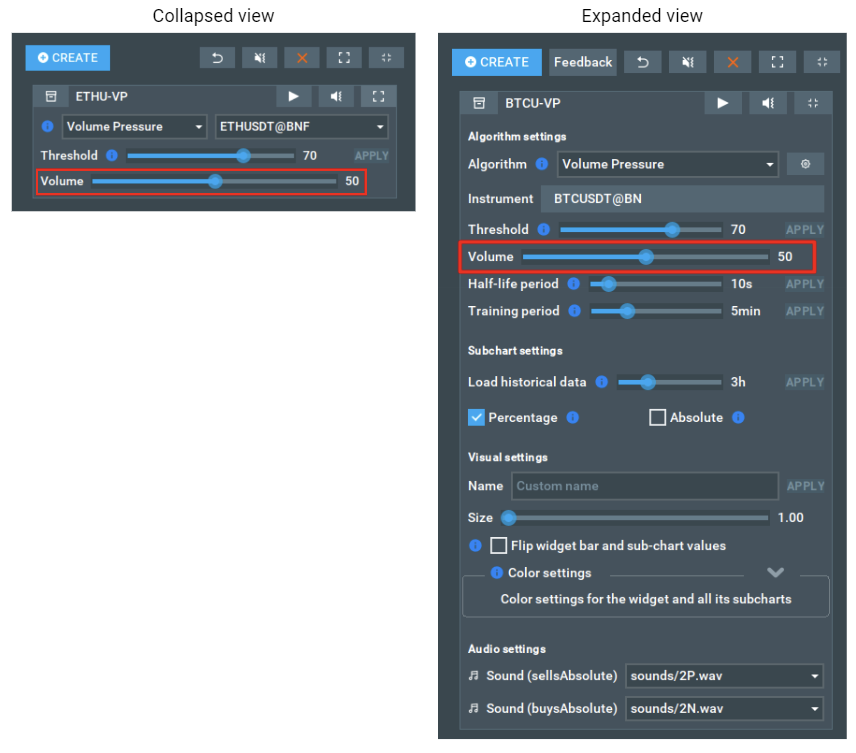
Volume
This slider controls the volume of the sound alerts for that specific widget. This allows you to prioritise more important widgets with a higher notification volume.
Widgets Panel
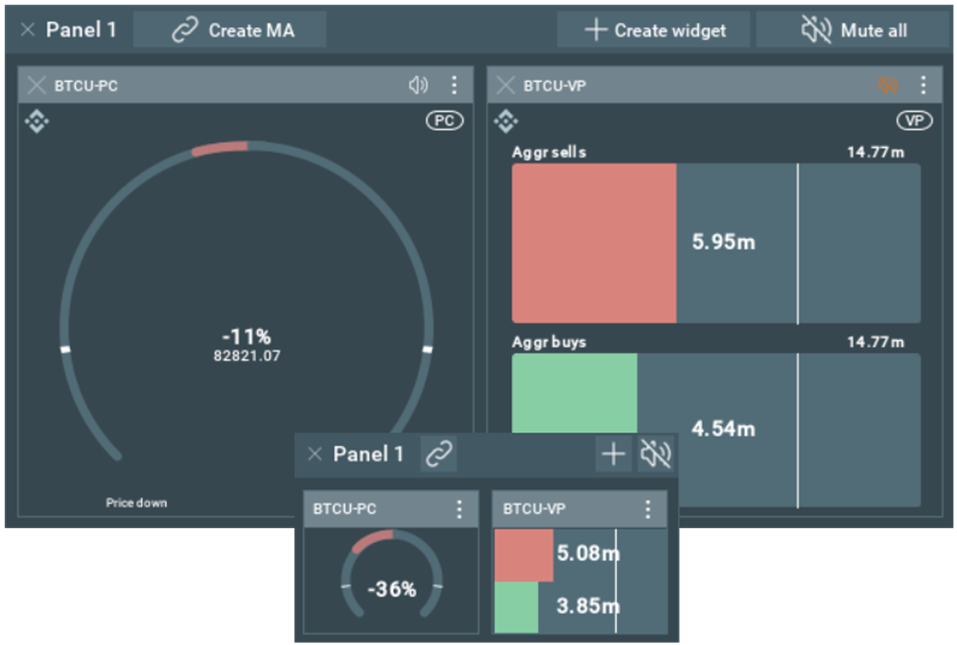
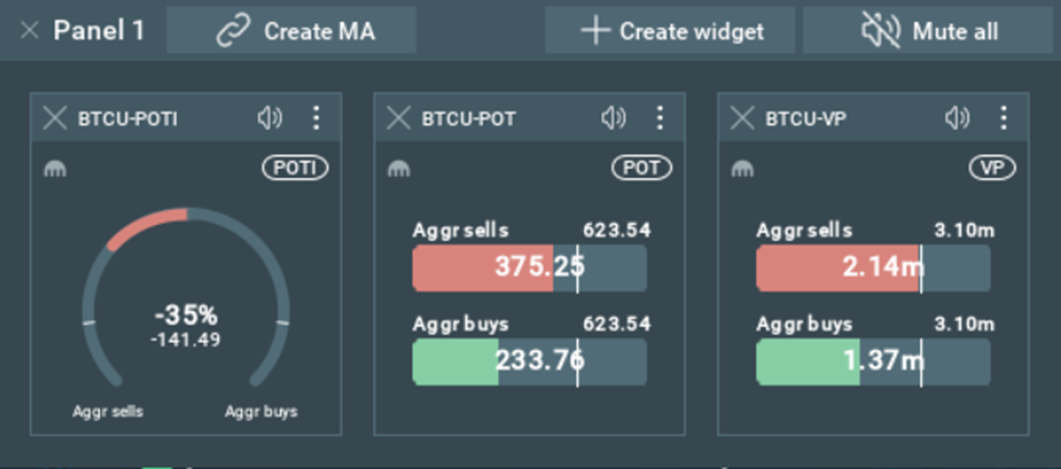
The Widgets Panel allows you to combine multiple widgets into a single, unified element. This feature is designed to help you group widgets conveniently within a panel for a streamlined experience.
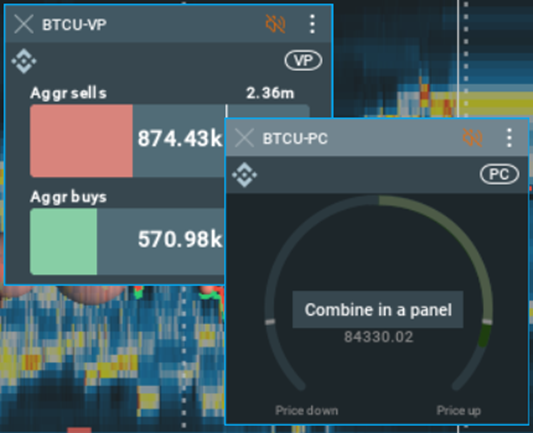
How to combine widgets in the panel
To create a panel, take one widget and drag and drop it onto another.
How to add and remove widgets from the panel
To add an active widget, simply drag and drop it onto the panel.
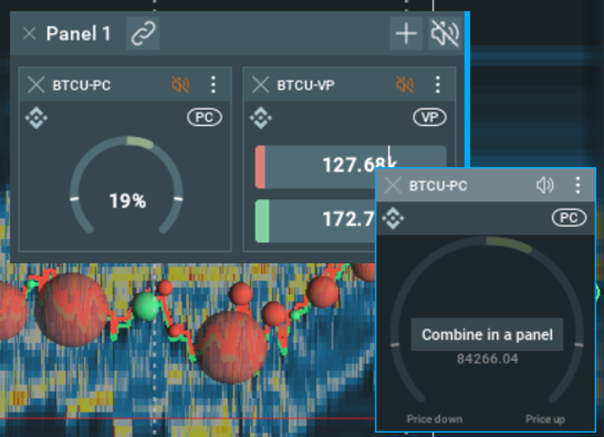
To create a new widget, use the ‘Create Widget’ button in the panel header.
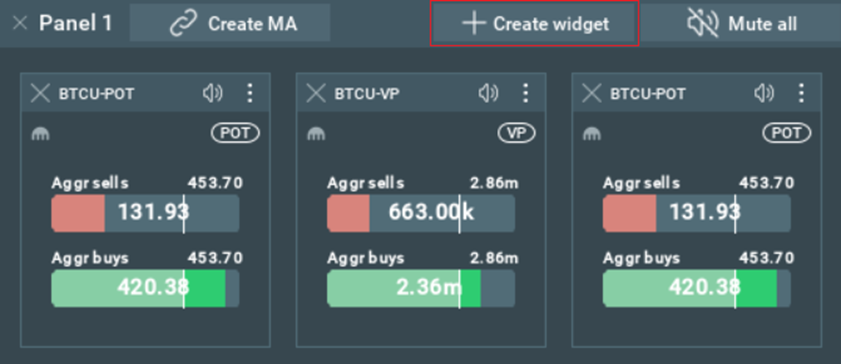
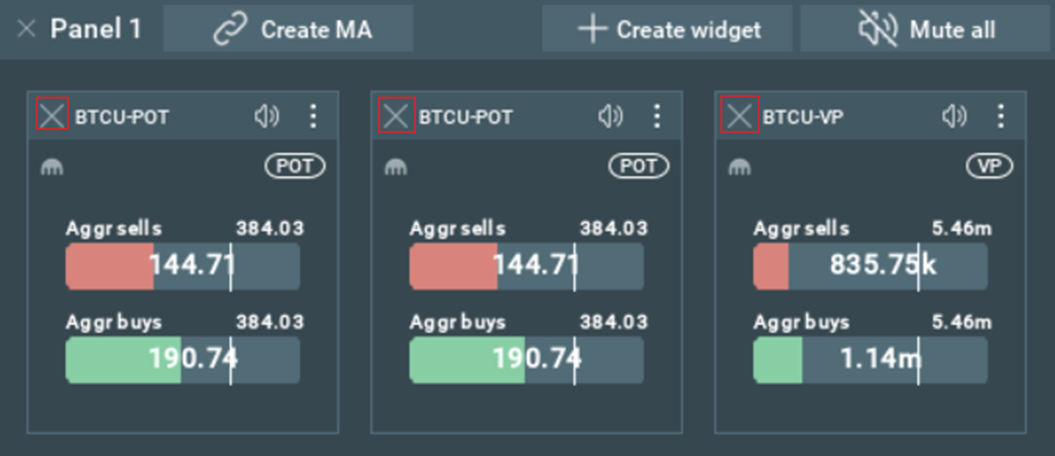
To remove a widget from the panel, press and pull it out of the panel. It is also possible to close a widget by clicking the ‘Close widget’ button on the widget itself.
Panel Features.
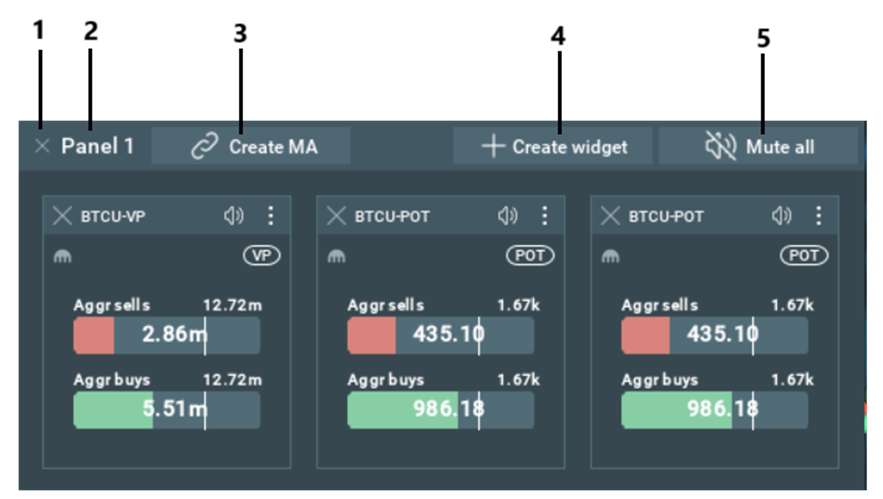
Close the panel, this will also close all widgets from the panel.
- Panel name.
- Create a MultiAlgo widget based on all widgets in the panel.
- Create a new widget.
- Mute all widgets on the panel.
Multi Algo Widgets Panel.
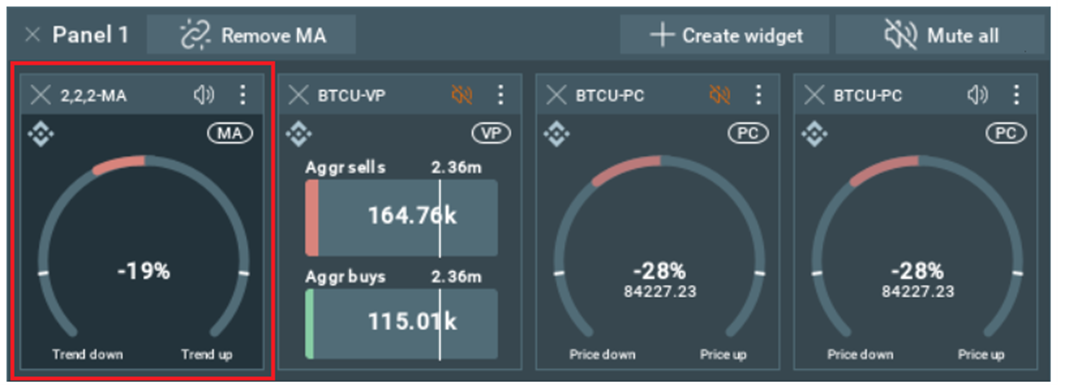
By clicking the ‘Create MA’ button a new MultiAlgo algorithm widget will be created which will show combined data from all other widgets in the panel. This widget will be added to the first place in the panel and will be separated from other widgets. Also, the MA widget is locked to this panel, it cannot be pulled out of the panel and will be deleted when the panel is closed.
Algorithms
This section contains the algorithms’ descriptions and algorithm-specific control elements.
Common algorithm control elements
Half-life period
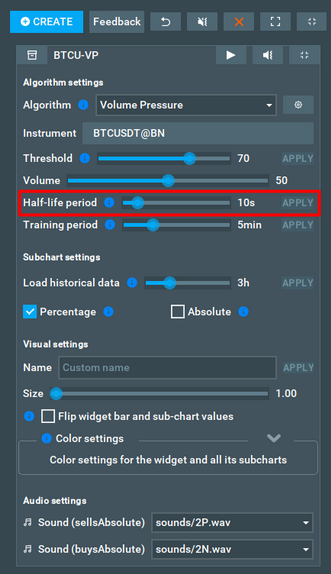
The half-life period is the amount of time it takes for a product to decrease by half the initial value.
The higher this parameter is set, the longer the decay time and the bigger impact of previous events.
Changing the half-life period will restart the algorithm’s calculations based on historical data and the new half-life input. This might take a long time. That is why you will need to press the apply button to apply the changes after you setting the half-life period. The apply button is located to the right of the half-life period slider.
Read more: What half-life period should I set?
Training period
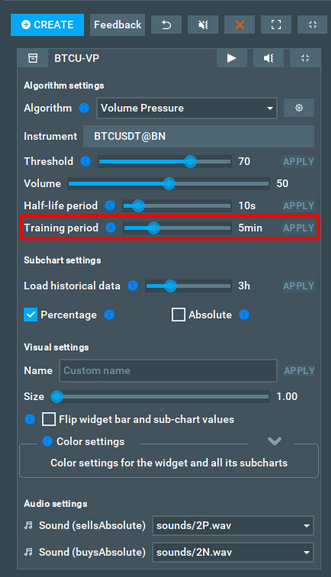
The percentage value of the main widget represents how close the current value is to the max value during any given interval. The training period parameter defines the size of this interval.
Increase this parameter if there are too many spikes for you on the sub-chart, as a longer interval should smoothen the chart out.
Read more: What training period should I set?
Prioritize value in %
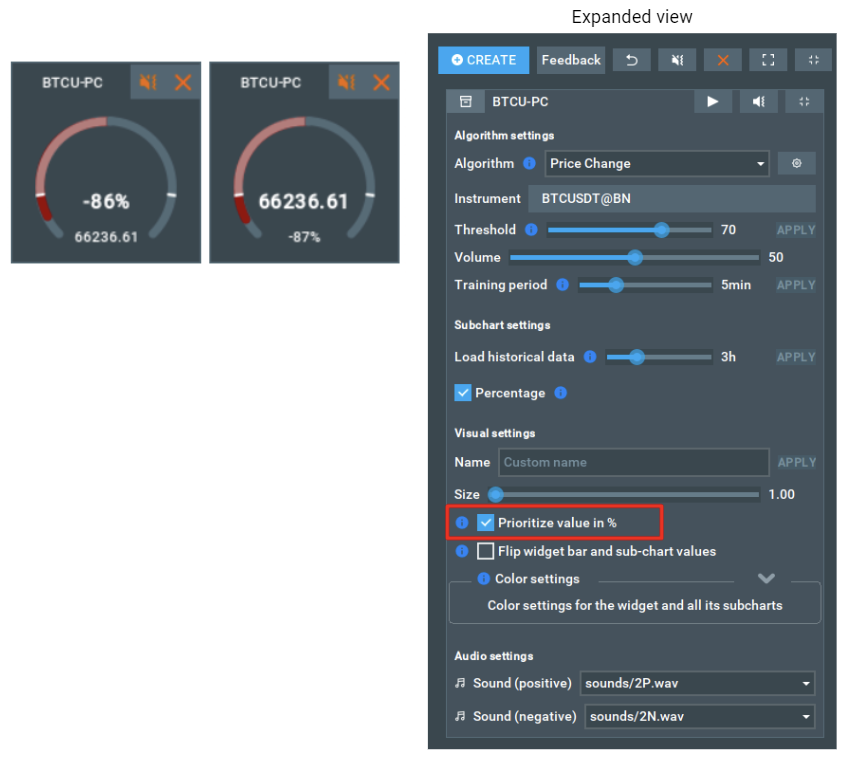
By default, widgets showing percentage value is prioritized (with bigger font in the center). This checkbox can be used to change the prioritized value to the absolute figure.
Load historical data
Users can choose their own parameter for loading historical data. This parameter defines the minimum amount of historical data that the widget will load when it is started.
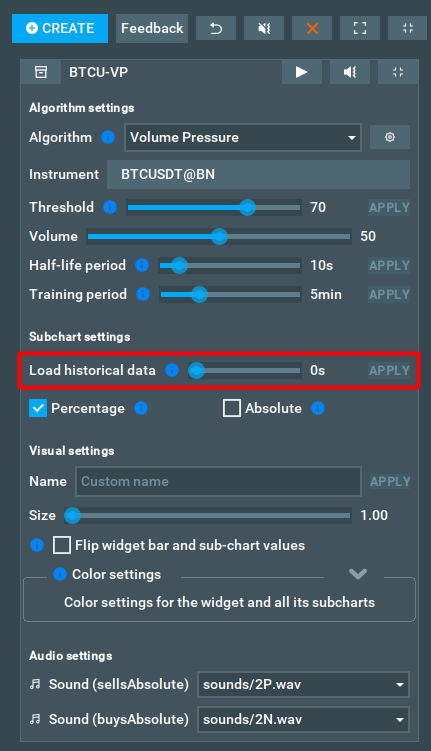
If you don't need any chart history, you can set this value to 0. In this case, only the history needed to calculate live events, for example the training period, will be loaded.
Loaded with 1 hour of history:

Loaded with 3 hour of history:

Half-life price interval
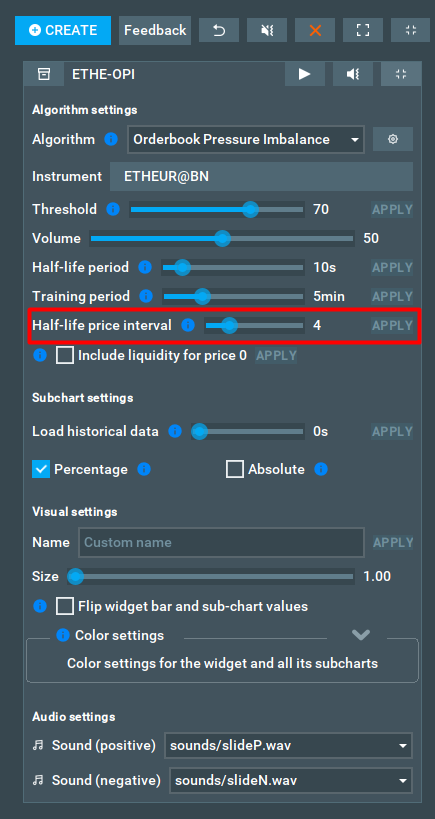
The half-life price interval is used to control the impact of the orders, which are distant from the BBO. This parameter determines the rate at which the liquidity change is reduced by half as the price moves from BBO.
Include liquidity for price 0
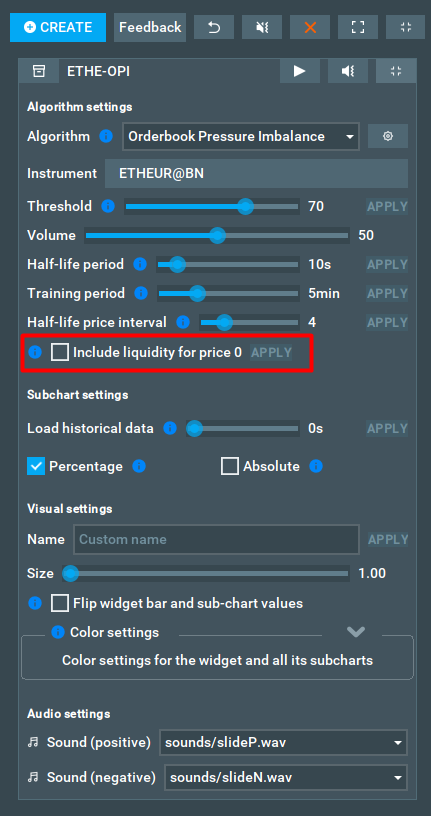
This parameter is used to determine whether orders with a price of zero should be included or excluded from calculations. When the checkbox is checked, orders with a price of zero will be factored into any relevant calculations, otherwise those orders will be disregarded.
Volume Pressure
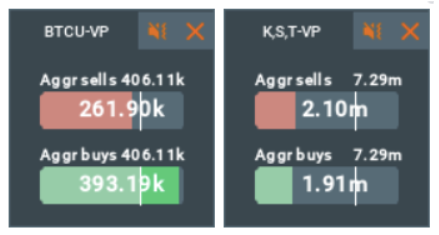
The Volume Pressure algorithm is compatible with any instrument. Based on the trading volume events over a certain period, it shows the current sellers and buyers pressure. Historical value is visualized within the sub-chart.
The algorithm is controlled by two parameters: the Half-life period and the Training period. The half-life period is used to control the impact of older-traded volumes. The training period is needed to control the percentage value. The larger this interval is, the more significant the changes must be to fill the bar.
All the values will be shown on the Double bar widget.
Sub-chart indicators
There are various sub-chart indicators for this algorithm that show absolute values as well as their ratio to the estimated maximum value.


Sub-chart pressure %
These sub-chart lines show the buyers and sellers pressure as a percentage. The percentage shows the ratio of the current pressure per side to the maximum estimated pressure value over time.
We recommend enabling this line as it will help to adjust the threshold and training period.
Read more: How could a sub-chart line help me to configure the threshold?
Sub-chart pressure absolute
These sub-chart lines show the absolute buyers and sellers pressure value over time. The current values of these sub-chart lines will also be shown on the widget. Read more about Widget structure.
Volume Pressure Imbalance
What is the Volume Pressure Imbalance Algorithm?
Volume Pressure Imbalance (VPI) is a technical analysis indicator that measures the difference between the total buyers and sellers Volume Pressures in the market. To know more about the buyers and sellers Volume Pressures click here.
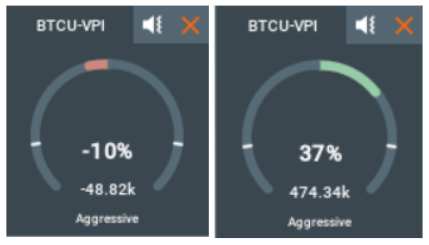
If there is more buying pressure than selling pressure, the VPI widget will show it with the green bar and positive value and the VPI sub-chart line will move upwards.
If there is more selling pressure than buying pressure, the VPI widget will show it with the red bar and negative value and the VPI sub-chart line will move downwards.
When the VPI line crosses the zero and the middle of the subchart, this clearly indicates a shift/flip in the overall market sentiment.
Sub-chart delta pressure % (delta %)

This sub-chart line shows the difference (delta) between buyers and sellers pressures expressed as a percentage. The percentage shows the ratio of the current delta to the maximum pressure value over a configurable amount of time.
Sub-chart delta pressure absolute (delta abs)

This sub-chart line shows the difference (delta) between the sellers and buyers absolute pressure value over time. Essentially, it is the delta between the buyers absolute pressure and sellers absolute pressure lines.
Price Change
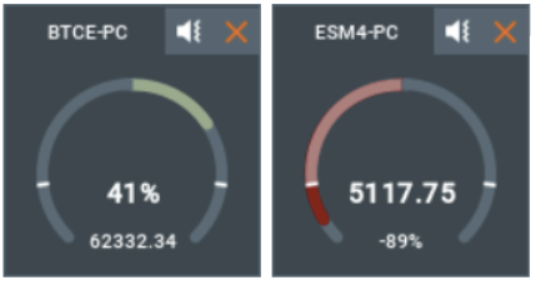
The Price Change algorithm can be used with any instrument and calculates the deviation of the last trade price from the average on an interval. The percentage value shows how close the current deviation is to the max deviation, that was detected on the interval.
The algorithm is controlled by the Training period, and is needed to calculate the average price, as well as the max deviation from it on the given time interval.
All the values will be shown on the Circle widget.
Sub-chart indicator

This sub-chart line shows the Price Change as a percentage. The percentage shows the ratio of current price deviation to maximum deviation value, across the set training period.
We recommend enabling this line - it will help you to properly adjust the threshold and training period. Read more: What training period should I set?
Spread Change
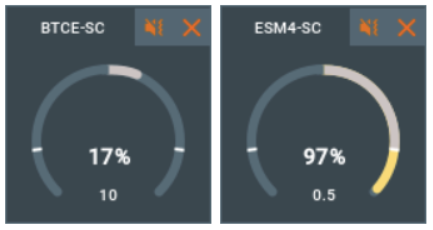
The Spread Change algorithm calculates the current spread change, and the standard deviation of the spread change of a given asset. This provides traders with valuable real-time insights into market conditions, as well as the associated risk levels for a given financial instrument.
Combining the Spread Change Algorithm with the Market Pulse widgets allows you to quickly visualize the market through a combination of sound alerts, spread change charts and Circle widget.
How To Configure the Spread Change
To customize their experience, traders can use the training period as an input parameter. This is the length of time over which the standard deviation of the spread change is being calculated, and traders can adjust it depending on the period of time they wish to measure.
Typically, a larger training period will display less volatility, thus traders should adjust their training period according to the size of market trends they wish to be alerted of.
How To Read the Spread Change
A higher standard deviation denotes greater market volatility and risk, while a lower standard deviation suggests the opposite.
By monitoring the standard deviation of the spread change, traders can make informed decisions and adjust their trading strategies accordingly to manage risk exposure. This is where sound notifications help traders quickly identify key market changes from the spread change algorithm.
Sub-chart indicators
Spread %
The Spread change % subchart displays the standard deviation of the spread change as a percentage via a line graph, displayed over the configured period of time.

The y-axis of the subchart shows the standard deviation of the spread change as a percentage, while the x-axis displays time. With color-changes whenever the line passes a threshold, this sub-chart line graph helps provide a visual representation of the consistency of the rate of change for a given financial instrument's spread.
Spread
 This subchart displays the current spread change as a line graph over your configured period of time. The y-axis of the subchart shows the spread change, while the x-axis displays time.
The line graph helps traders clearly see how the spread change changes over time, providing a visual representation of the rate of change for a given financial instrument's spread.
Liquidation Pressure
What is the Liquidation Pressure Algorithm?
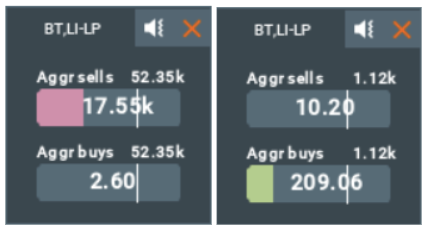
Designed to allow traders to more easily visualize market liquidation events for Crypto instruments. The Liquidation Pressure algorithm is used to measure the impact of liquidation events in a given market. This works with liquidations in a similar way to how the Volume Pressure algorithm works with trades. The algorithm collects and accumulates the sizes of liquidations, and reduces their impact by half during the half-life period.
This helps a more comprehensive grasp of market conditions for traders. For example, by monitoring liquidations on the most frequented markets, traders can make informed decisions before these occurrences impact their chosen trading instrument.
How to Configure the Liquidation Pressure
Designed to help your specific style of trading, the algorithm is highly customizable and accepts two adjustable parameters. These are the training period and the half-life period, both of which affect the Liquidation Pressure algorithm’s calculations.
Sub-charts
Pressure %
These sub-chart lines show the buyers and sellers pressures as a percentage. The percentage displays the ratio of the current pressure to the maximum pressure value over a configurable period of time.

Pressure abs
These sub-chart lines show the absolute buyers and sellers pressure value. The current value of this sub-chart line will also be shown on the widget.

Delta abs
This sub-chart line shows the current absolute difference between the pressures of buyers and sellers.

Orderbook Pressure
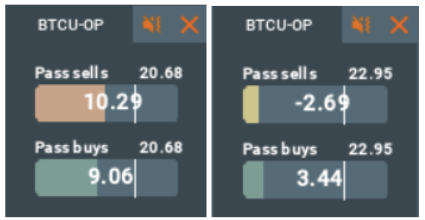
The Orderbook Pressure algorithm shows all the order book liquidity changes. The more liquidity on the buyers side and the closer this liquidity is to the BBO (Best-Bid Offer), the higher buyers value. The same is valid for the sellers side - the more liquidity on the sellers side and the closer it is to the BBO the higher the sellers value.
By displaying two simple values - the buyers and the sellers, traders can use this algorithm to easily identify the direction and momentum of the market.
The Orderbook Pressure Algorithm displays two values, for buyers and sellers. The indicator values decay over time - to know more about this decay read about the "Half-life period" parameter. The amount of change in values also depends on how close the liquidity is to the BBO, which is controlled by the "Half-life price interval" parameter.
Historical value is visualised within the sub-chart.
All the values are shown on the Double Bar widget.
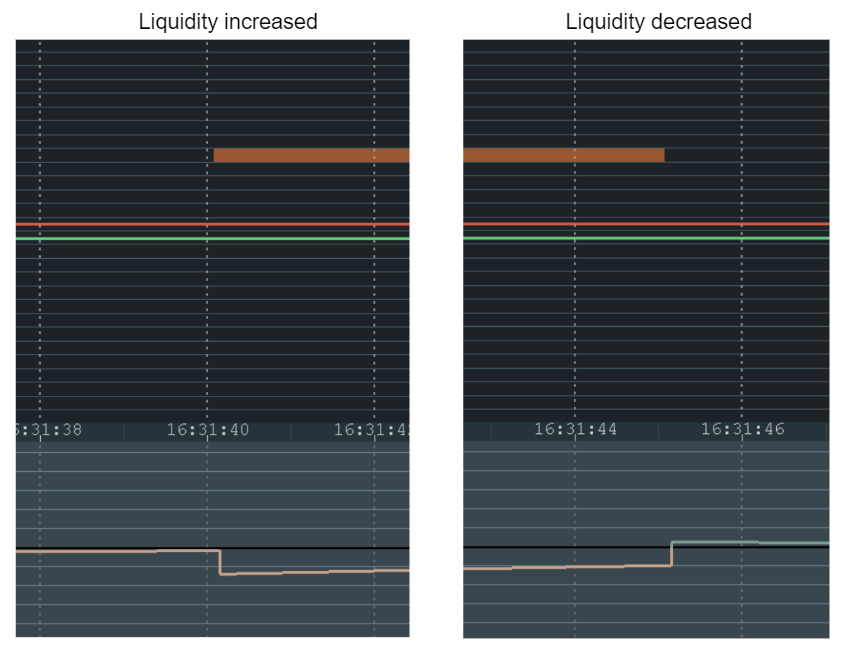
In the above example on the left, the liquidity on price level 2 was added, which means sellers liquidity was increased. This is indicated on the subchart line. On the right, the liquidity on price level 2 was decreased, which means sellers liquidity was decreased.
How to configure Orderbook Pressure
The Orderbook Pressure algorithm is highly customizable and accepts four adjustable parameters. These are the training period, the half-life period, the half-life price interval and include liquidity for price 0, all of which affects The Orderbook Pressure algorithm’s calculations.
Sub-charts
Buyers %

This sub-chart line shows the standard deviation of the liquidity change of buyers as a percentage to the average.
Buyers abs

This sub-chart line shows the absolute value of the liquidity change of buyers. Traders can use it to see the live liquidity change for buyers.
Sellers %

This sub-chart line shows the standard deviation of the liquidity change of sellers as a percentage to the average.
Sellers abs

This sub-chart line shows the absolute value of the liquidity change of sellers. Traders can use it to see the live liquidity change for sellers.
Orderbook Pressure Imbalance
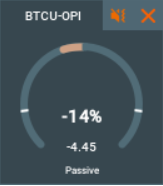
The Orderbook Pressure Imbalance algorithm shows the difference between the buyers and sellers values.
If the total liquidity (according to the Orderbook Pressure formula taking into account the Half-life price interval) of the bids is higher, then the widget will show a green value and the line on the subchart will be at the top.
If the total liquidity of the asks is higher, then the widget will show a negative value and the subchart will go down, with a red value displayed.
Historical value is visualised within the sub-chart.
All the values will also be shown on the Circle widget.
How to configure Orderbook Pressure Imbalance
The Orderbook Pressure Imbalance algorithm is highly customizable and accepts four adjustable parameters. These are the training period, the half-life period, the half-life price interval and include liquidity for price 0, all of which affects The Orderbook Pressure Imbalance algorithm’s calculations.
Sub-chart delta pressure % (delta %)

This sub-chart line shows the difference (delta) between buyers liquidity and sellers liquidity expressed as a percentage. The percentage shows the ratio of the current delta to the maximum value over a configurable amount of time.
Sub-chart delta pressure absolute (delta abs)

This sub-chart line shows the difference (delta) between the buyers liquidity and sellers liquidity absolute value over time. Essentially, it is the delta between the buyers absolute pressure and sellers absolute pressure lines.
Absorption Pressure
Note! To use this algorithm you need to have the latest version of Absorption indicator installed! Check the installation section to know more.
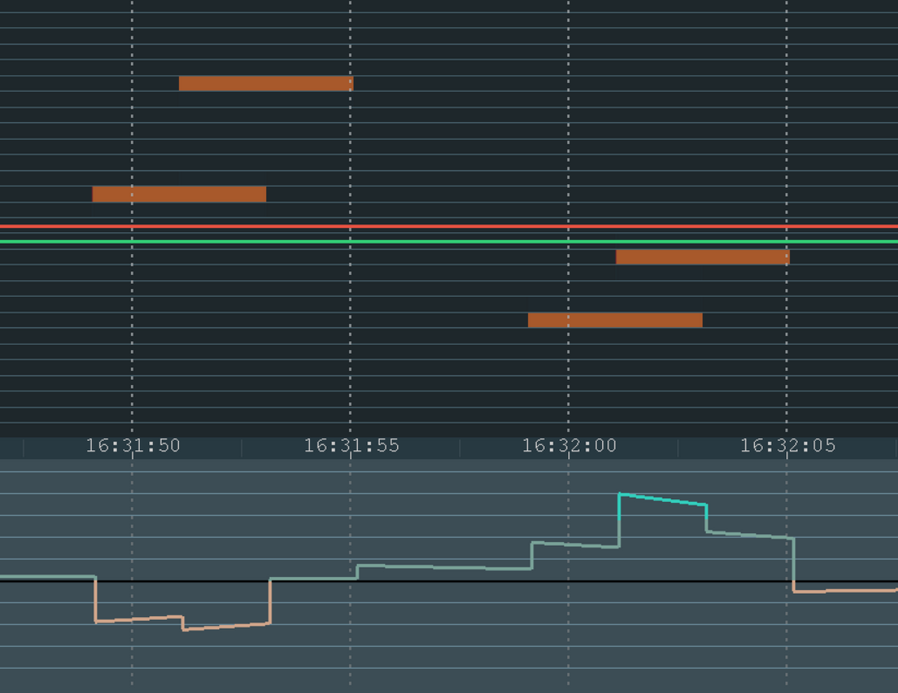
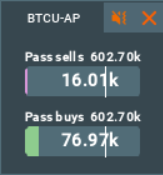
Absorption Pressure is an algorithm that receives data from the Absorption Indicator and visualizes it within the Market Pulse widget and subchart line. Absorption Pressure shows the pressure of passive sellers and passive buyers. To stay relevant over time, the algorithm reduces the impact of each seller/buyer event by half during the half-life period.
The Absorption Pressure algorithm is compatible with any instrument that has trades.
Historical value is visualised within the sub-chart.
All the values will be shown on the Double bar widget.
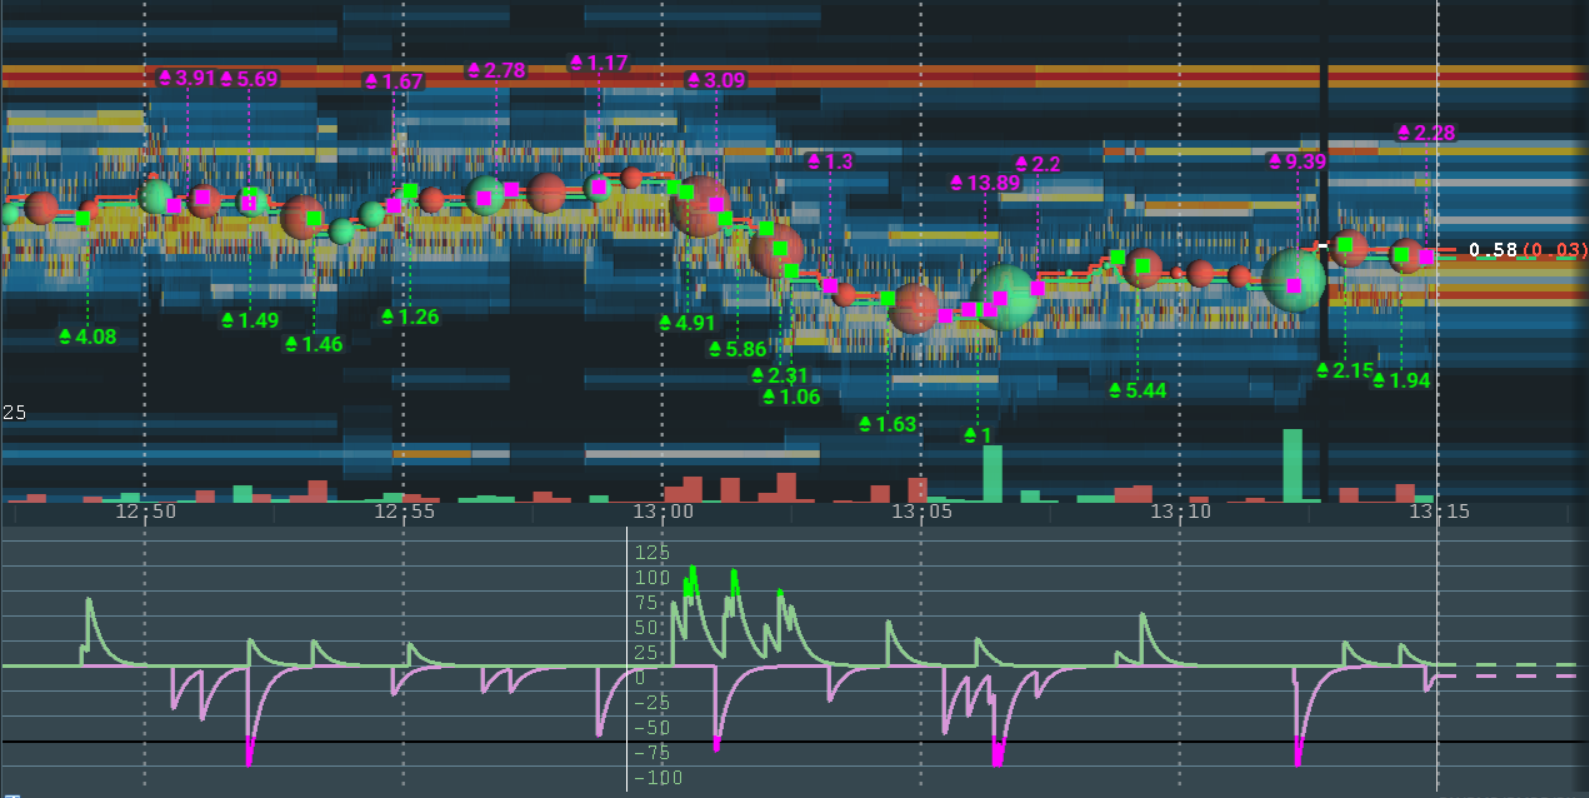
How To Configure the Absorption Pressure Algorithm
The algorithm is controlled by two parameters: the Half-life period and the Training period. It is also impacted by your Absorption Indicator settings. To configure your Absorption Pressure Algorithm, adjust the settings of any one of these three aspects.
Sub-chart pressure %
These sub-chart lines show the passive sellers and passive buyers pressure as a percentage. The percentage shows the ratio of the current pressure per side to the maximum estimated pressure value over time.
We recommend enabling this line as it will help to adjust the threshold and training period.
Read more: How could a sub-chart line help me to configure the threshold?
Sub-chart pressure absolute
These sub-chart lines show the absolute passive sellers and passive buyers pressure value over time. The current values of these sub-chart lines will also be shown on the widget. Read more about Widget structure.
Absorption Pressure Imbalance
Note! To use this algorithm you need to have the latest version of Absorption indicator installed! Check the installation section to know more.
What is the Absorption Pressure Imbalance Algorithm?
Absorption Pressure Imbalance is an algorithm that receives data from the Absorption Indicator and visualizes it within the Market Pulse widget and subchart line. Absorption Pressure Imbalance shows the difference between the pressure of passive sellers and passive buyers. The algorithm reduces the impact of each buyer/seller event by half during the half-life period.
All the values are also be shown on the Circle widget.
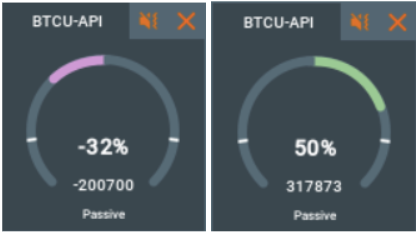
If there is more passive buying pressure than selling pressure, the widget will display this with a green bar and positive value, whilethe sub-chart line will move upwards.
If there is more passive selling pressure than buying pressure, the widget will display this with a red bar and negative value, while the sub-chart line will move downwards.
Sub-chart delta pressure % (delta %)

This sub-chart line shows the difference (delta) between buyers and sellers pressures, expressed as a percentage. This percentage shows the ratio of the current delta to the maximum pressure value over a configurable amount of time.
Sub-chart delta pressure absolute (delta abs)

This sub-chart line shows the difference (delta) between the sellers and buyers absolute pressure value over time. Essentially, it is the delta between the buyers absolute pressure and sellers absolute pressure lines.
Sweeps Pressure
Note! To use this algorithm you need to have the latest version of Sweeps indicator installed! Check the installation section to know more.
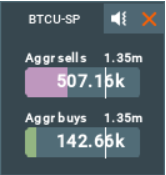
Sweeps Pressure is an algorithm that receives data from the Sweeps Indicator and visualizes it within the Market Pulse widget and subchart line. Sweeps Pressure shows the pressure of aggressive sellers and aggressive buyers. The algorithm reduces the impact of each seller/buyer event by half during the half-life period.
The Sweeps Pressure algorithm is compatible with any instrument that has trades.
Historical value is visualised within the sub-chart.
All the values will be shown on the Double bar widget.
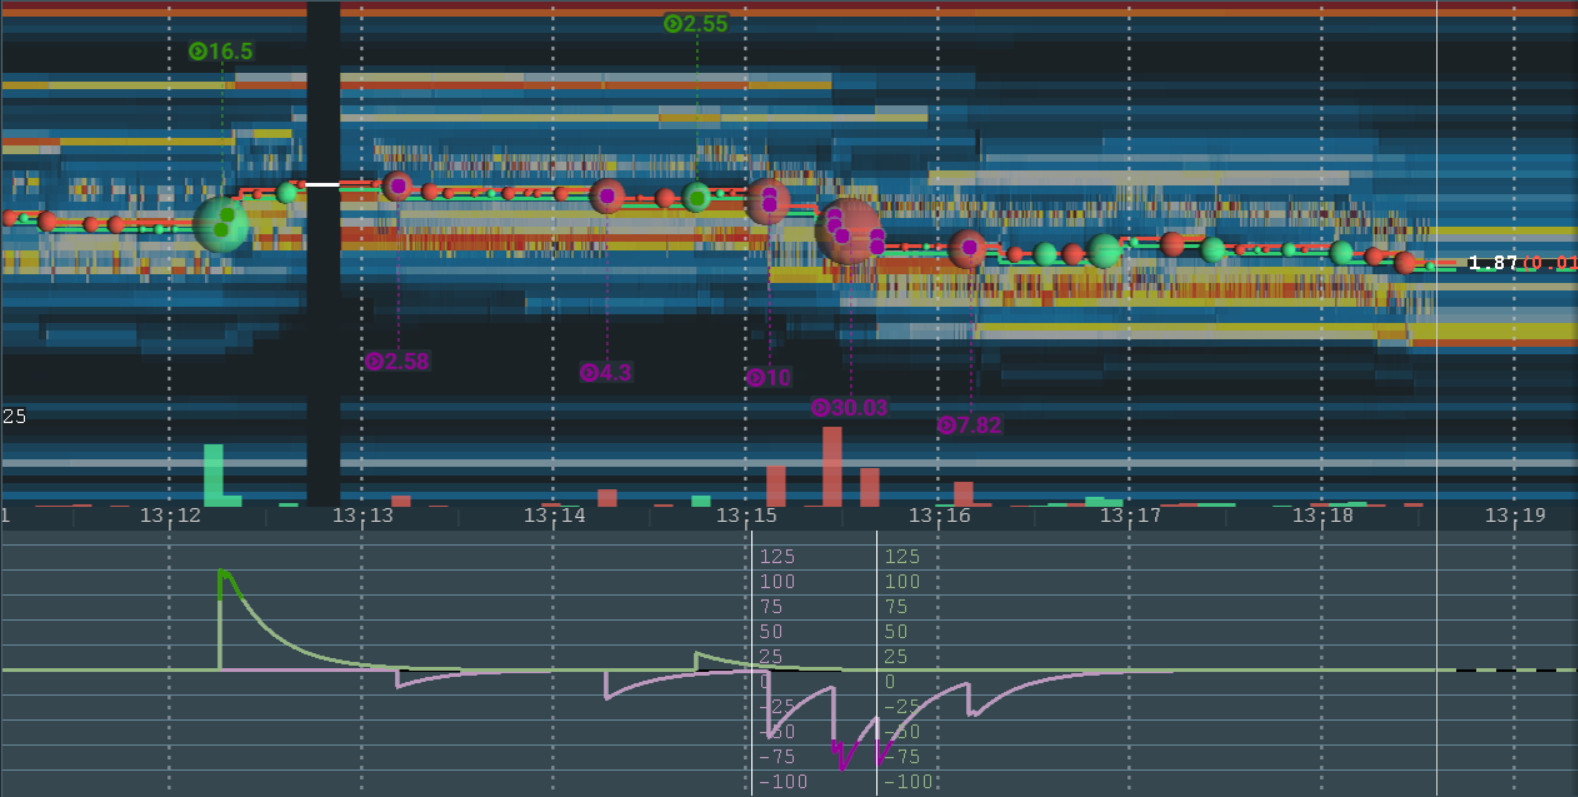
How To Configure the Sweeps Pressure
The algorithm is controlled by two parameters: the Half-life period and the Training period. It is also impacted by your Sweeps Indicator settings.
Sub-chart pressure %
These sub-chart lines show the aggressive sellers and aggressive buyers pressure as a percentage. The percentage shows the ratio of the current pressure per side to the maximum estimated pressure value over time.
We recommend enabling this line as it will help to adjust the threshold and training period.
Read more: How could a sub-chart line help me to configure the threshold?
Sub-chart pressure absolute
These sub-chart lines show the absolute aggressive sellers and aggressive buyers pressure value over time. The current values of these sub-chart lines will also be shown on the widget. Read more about Widget structure.
Sweeps Pressure Imbalance
Note! To use this algorithm you need to have the latest version of Sweeps indicator installed! Check the installation section to know more.
What is the Sweeps Pressure Imbalance Algorithm?
Sweeps Pressure Imbalance is an algorithm that receives data from the Sweeps Indicator and visualizes it within the Market Pulse widget and subchart line. Sweeps Pressure Imbalance shows the difference between the pressure of aggressive sellers and aggressive buyers. The algorithm reduces the impact of each buyer/seller event by half during the half-life period.
All the values are also be shown on the Circle widget.
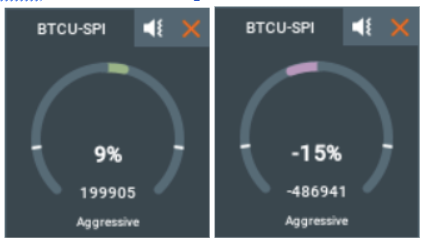
If there is more aggressive buying pressure than selling pressure, the widget will display this with a green bar and positive value, while the sub-chart line will move upwards.
If there is more aggressive selling pressure than buying pressure, the widget will display this with a red bar and negative value, while the sub-chart line will move downwards.
Sub-chart delta pressure % (delta %)

This sub-chart line shows the difference (delta) between buyers and sellers pressures expressed as a percentage. This percentage shows the ratio of the current delta to the maximum pressure value over a configurable amount of time.
Sub-chart delta pressure absolute (delta abs)

This sub-chart line shows the difference (delta) between the sellers and buyers absolute pressure value over time. Essentially, it is the delta between the buyers absolute pressure and sellers absolute pressure lines.
Stops Pressure
Attention! Please Note that to use this algorithm you need to have the latest version of Stops & Icebergs On-Chart (for Rithmic) or B3 Icebergs On-Chart Indicator (for Cedro) installed.
The Stops Pressure algorithm only works with CME MBO Rithmic real-time data (in non-aggregated mode).
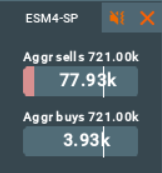
Stops Pressure is an algorithm that receives data from the Stops & Icebergs On-Chart Indicator and then visualizes it within the Market Pulse widget and subchart line. Stops Pressure shows the current sellers and buyers pressure on trades with executed stop orders. The algorithm reduces the impact of each seller/buyer event by half during the half-life period.
The Stops Pressure algorithm is compatible with any instrument that has trades.
Historical value is visualised within the sub-chart.
All the values will be shown on the Double bar widget.
Buyers %

These sub-chart lines show the buyer's pressure as a percentage. The percentage shows the ratio of the current pressure per side against the maximum estimated pressure value over time.
Buyers abs

These sub-chart lines show the absolute buyer's pressure value over time. The current values of these sub-chart lines will also be shown on the widget.
Sellers %

These sub-chart lines show the seller's pressure as a percentage. The percentage shows the ratio of the current pressure per side against the maximum estimated pressure value over time.
Sellers abs

These sub-chart lines show the absolute seller's pressure value over time. The current values of these sub-chart lines will also be shown on the widget.
Icebergs Pressure
Attention! Please note That to use this algorithm you need to have the latest version of Stops & Icebergs On-Chart (for Rithmic) or B3 Icebergs On-Chart Indicator (for Cedro) installed.
The Icebergs Pressure algorithm only works with CME MBO Rithmic and Cedro real-time data (in non-aggregated mode).
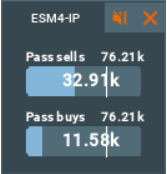
Icebergs Pressure is an algorithm that receives data from the Stops & Icebergs Sub-Chart Indicator and then visualizes it within the Market Pulse widget and subchart line. Icebergs Pressure shows the current sellers and buyers pressure on traded icebergs. The algorithm reduces the impact of each seller/buyer event by half during the half-life period.
The Icebergs Pressure algorithm is compatible with any instrument that has trades.
Historical value is visualised within the sub-chart.
All the values will be shown on the Double bar widget.
Buyers %

These sub-chart lines show the buyer's pressure as a percentage. The percentage shows the ratio of the current pressure per side against the maximum estimated pressure value over time.
Buyers abs

These sub-chart lines show the absolute buyer's pressure value over time. The current values of these sub-chart lines will also be shown on the widget.
Sellers %

These sub-chart lines show the seller's pressure as a percentage. The percentage shows the ratio of the current pressure per side against the maximum estimated pressure value over time.

Sellers abs
These sub-chart lines show the absolute seller's pressure value over time. The current values of these sub-chart lines will also be shown on the widget.
Orderbook Imbalance
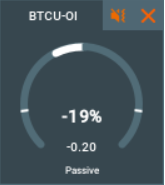
The Orderbook Imbalance algorithm shows the difference between the buyers and sellers values on the orderbook.
If the total liquidity of the bids is higher, then the widget will show a green value and the line on the subchart will be at the top.
If the total liquidity of the asks is higher, then the widget will show a negative value and the subchart will go down, with a red value displayed.
Historical value is visualised within the sub-chart.
All the values will also be shown on the Circle widget.
How to configure Orderbook Imbalance
The Orderbook Imbalance algorithm is highly customizable and accepts four adjustable parameters. These are the training period, the half-life period, the half-life price interval and numbers of price levels, all of which affects The Orderbook Imbalance algorithm’s calculations.
Numbers of price levels
The number of price levels determines how many price levels from the BBO will be taken into account by the algorithm.
Sub-chart

This sub-chart line shows the difference (delta) between buyers liquidity and sellers liquidity expressed as a percentage. The percentage shows the ratio of the current delta to the maximum value over a configurable amount of time.
Pace of Tape
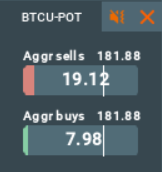
The Pace of Tape algorithm is compatible with any instrument. Based on the trading volume events over a configurable period, it shows the current sellers and buyers pressure. Historical value is visualized within the sub-chart.
How to configure Pace of Tape
The algorithm is controlled by three parameters: the Half-life period, the Training period and an Enable individual trade events. The half-life period is used to control the impact of older-traded volumes. The training period is needed to control the percentage value. The larger this interval is, the more significant the changes must be to fill the bar.
Enable individual trade events
By default you will see alerts for tapes, but you can turn this checkbox off and then each trade whose size is greater than 0 will be counted individually.
All the values will be shown on the Double bar widget.
Sub-chart indicators
There are various sub-chart indicators for this algorithm that show absolute values as well as their ratio to the estimated maximum value.


Sub-chart pressure %
These sub-chart lines show the buyers and sellers pressure as a percentage. The percentage shows the ratio of the current pressure per side against the maximum estimated pressure value over time.
Sub-chart pressure absolute
These sub-chart lines show the absolute buyers and sellers pressure value over time. The current values of these sub-chart lines will also be shown on the widget. Read more about Widget structure.
Pace of Tape Imbalance
Pace of Tape Imbalance (POTI) is a technical analysis indicator. Based on the number of trading events over a configurable period, it shows the difference between the current buying and selling pressure.
The Pace of Tape algorithm is compatible with any instrument. Historical value is visualized within the sub-chart.
How to configure Pace of Tape Imbalance
The algorithm is controlled by three parameters: the Half-life period, the Training period and an Enable individual trade events. The half-life period is used to control the impact of older-traded volumes. The training period is needed to control the percentage value. The larger this interval is, the more significant the changes must be to fill the bar.
Enable individual trade events
By default you will see alerts for tapes, but you can turn this checkbox off and then each trade whose size is greater than 0 will be counted individually.
All the values are also be shown on the Circle widget.
Sub-chart indicators
There are various sub-chart indicators for this algorithm that show absolute values as well as their ratio to the estimated maximum value.
Sub-chart pressure %
This sub-chart line shows the difference (delta) between buyers and sellers pressures, expressed as a percentage. This percentage shows the ratio of the current delta to the maximum pressure value over a configurable amount of time.

Sub-chart pressure absolute
This sub-chart line shows the difference (delta) between the sellers and buyers absolute pressure value over time. Essentially, it is the delta between the buyers absolute pressure and sellers absolute pressure lines.

Multi Algo
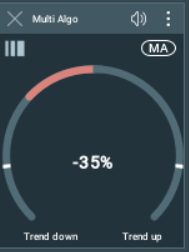
The Multi Algo algorithm combines percentage values from other running widgets. This algorithm has only a percent value and helps to determine the general trend of a market or asset. One common value from each widget is used to calculate the result: from the Circle widget the single percent value is used, from the Double bar widget the delta value is used.
How to configure Multi Algo
The Multi Algo algorithm is only available in the Widgets Panel, where it combines data from all other widgets in the panel.
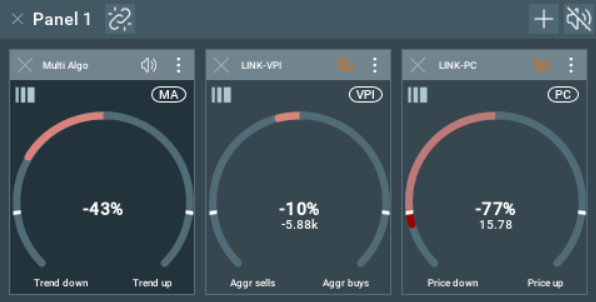
All the values will be shown on the Circle widget.
Sub-chart indicator

The y-axis of the subchart shows the average trend of the values of the chosen widgets as a percentage, while the x-axis displays time. With color-changes whenever the line passes a configurable threshold, this sub-chart line graph helps provide a visual representation of the general trend changes taking into account data from several algorithms.
Widget structure
Common elements
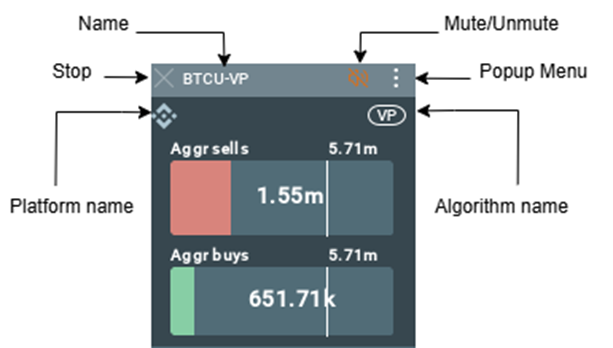
All the widgets have a:
- Stop button: to hide the widget. It does not remove the configuration panel, so it can be easily started again from the add-on configuration panel.
- Widget name. Read more about the Name if you want to change it.
- Mute button: to mute/unmute the widget.
- Popup Menu: opens the widget popup menu.
- Algorithm name: The short name of the widget algorithm, hovering the mouse on the icon will expand it to the full name of the widget.
- Platform name: The icon of the provider of the instrument on which the algorithm works, hovering the mouse in the tooltip will indicate the name of the platform.
Double bar widget
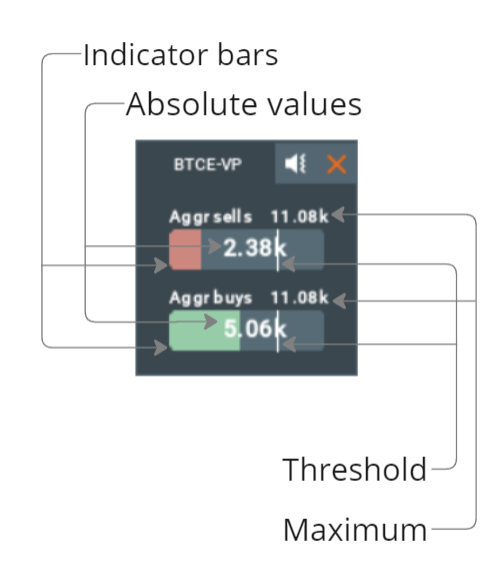
The Double bar widgets contain:
- The Indicator bars with Absolute values overlayed on top of them are split into buyers and sellers.
- The Maximum value on the given Training period.
- The Threshold line, so long as the widget is not muted, will play a sound whenever the threshold is crossed.
Circle widget
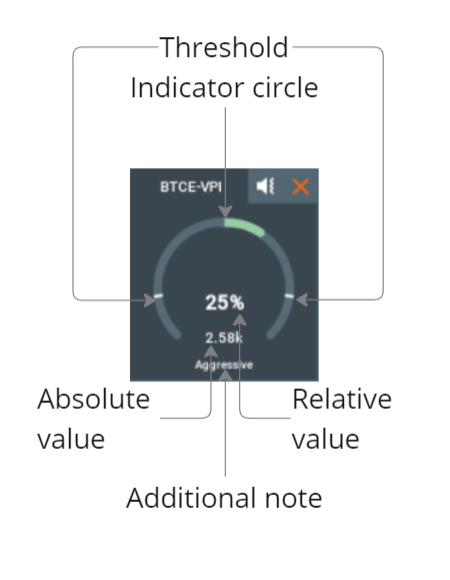
The Circle widgets contain:
- The Absolute value of the asset, in the middle and in bold
- The Relative value showing the deviation of the absolute value during the given interval.
- The Indicator circle as a visual representation of the relative value, color coded for the value increase and decrease.
- The Threshold line, where so long as the widget is not muted, will play a sound whenever the threshold is crossed.
Widget popup menu
Press the three-dot button to open the widget's popup menu.
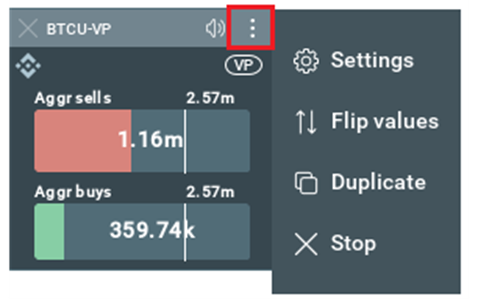
The popup menu has the following functions:
- Settings - opens the widget settings window
- Flip values - flip the value
- Duplicate - creates a duplicate widget, a new widget with the settings of this widget.
- Stop - stops the widget.
Widget settings window
This is the widget settings window attached to the widget. You can open it using the Widget popup menu.
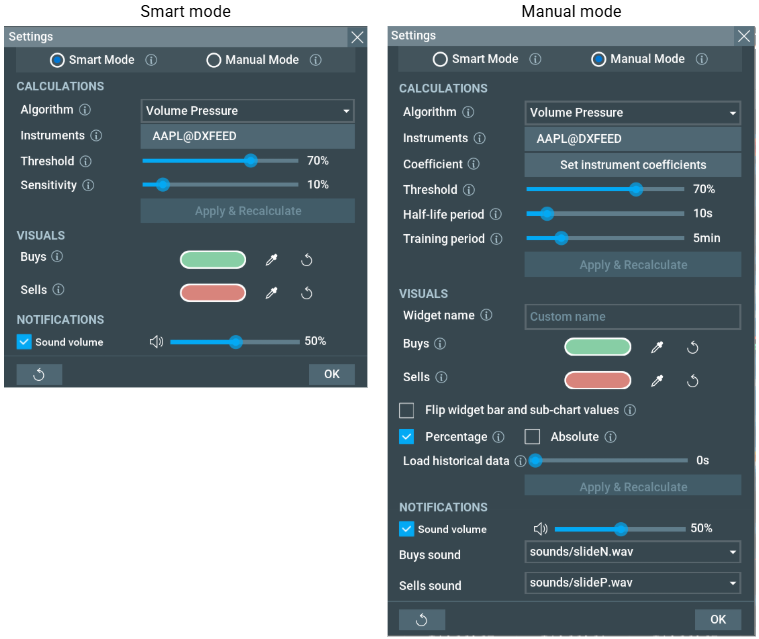
Hidden widget loading
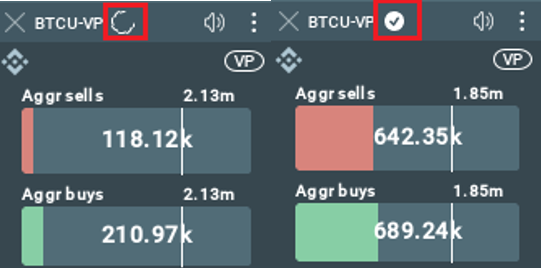
If you change a widget setting that requires it to reload, then after pressing the “APPLY” button the widget will start a hidden loading while showing the data at the old settings.
The hidden loading icon is shown on the widget header. Also, when the loading is complete, the hidden loading icon will be replaced by an icon confirming that the loading is complete.
Widget double click
Double-click a widget to toggle the sub-chart data on and off, or switch the data on display.
Widget right click
Using the right click, you can open a context menu where you can select “settings” and configure the widget.
Sound system
The sound system reacts to change in the current value. It has a configurable threshold, which when crossed causes a sound to be played. The current value depends on algorithm parameters, which we recommend configuring first.
Initially, we used Geiger counters and metal detectors as our reference for developing the Market Pulse sound system. The closer it is to uranium/metal, the higher the frequency and the speed of the sound. The same concept is used for our algorithms - the frequency of the played sounds depends on the value above threshold; the higher the threshold-crossing value, the more frequently the sound is played.
Example:
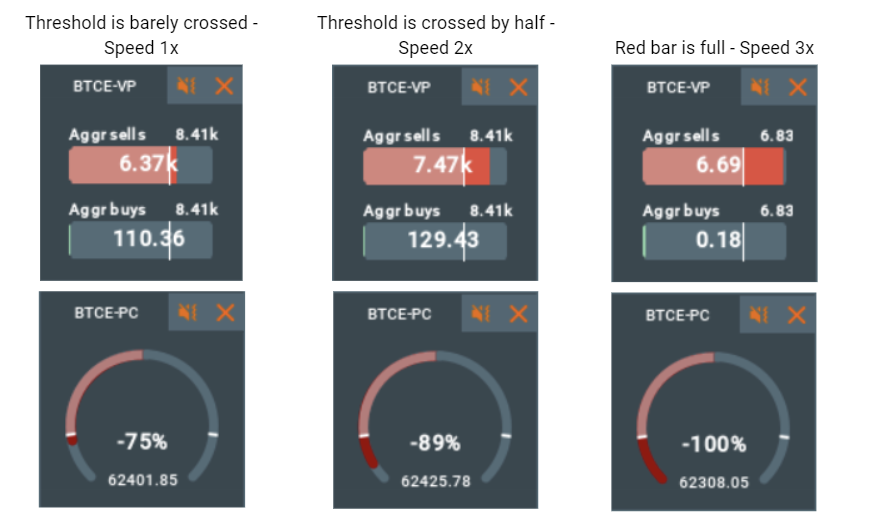
Sound notifications for different bars mean that the corresponding value of that bar in comparison to its previous values has been growing fast enough and has crossed a certain threshold. The more frequently sounds are played, the closer the value to the expected maximum value.
So the values can be compared by sound. Let’s look at the Volume Pressure:
Example #1: you hear the sound and over time the frequency of the notifications is increasing.
- This means the relative value is increasing, in other words something big that requires your attention is happening.
Example #2: you hear the sound and over time the frequency of the notifications is decreasing.
- That means the relative value is decreasing, in other words something big was happening when the value crossed the threshold and now the market is stabilizing.
Read more: How to configure the threshold? How could a sub-chart line help me to do that?
Alert Notification
Market Pulse is connected to the Bookmap Alert system, meaning you can get alerts from your Market Pulse widget. When the widget is running and can produce sound (is unmuted), it is automatically registered onto the Bookmap Alert system.
Please note that the widget will not be registered if it is not running or is muted.
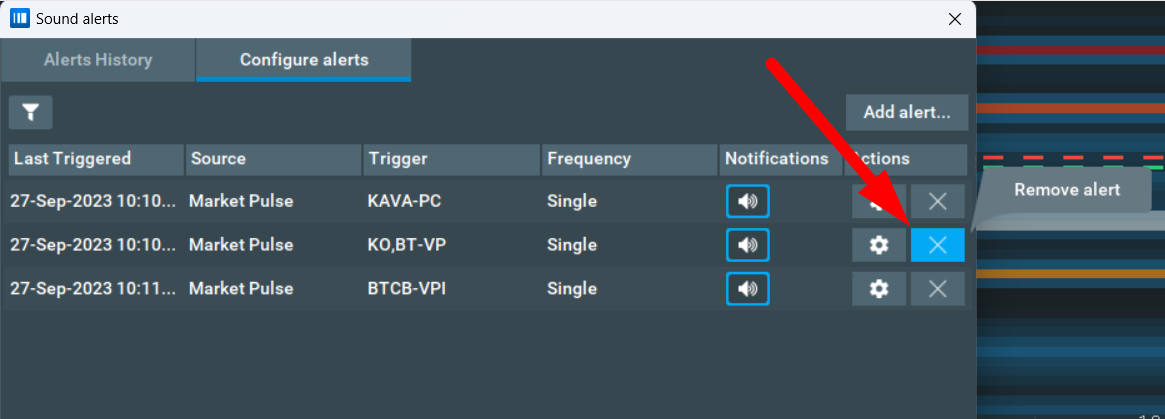
You can view and manage all sound alerts in the "File" -> "Alerts" -> "Sound alerts" window.
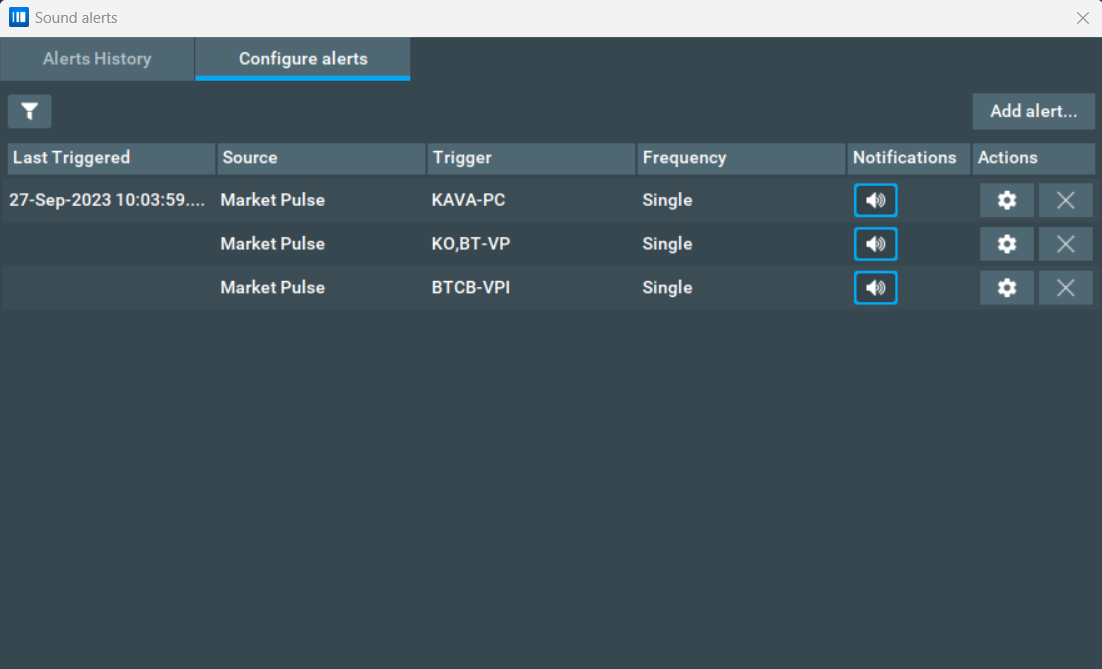
In the "Configure Alerts" and "Alerts History" window you can press the "Configure alert" button to go to the particular alert configuration window. From here you can only manage the settings related to the sound itself: the volume and mute state.
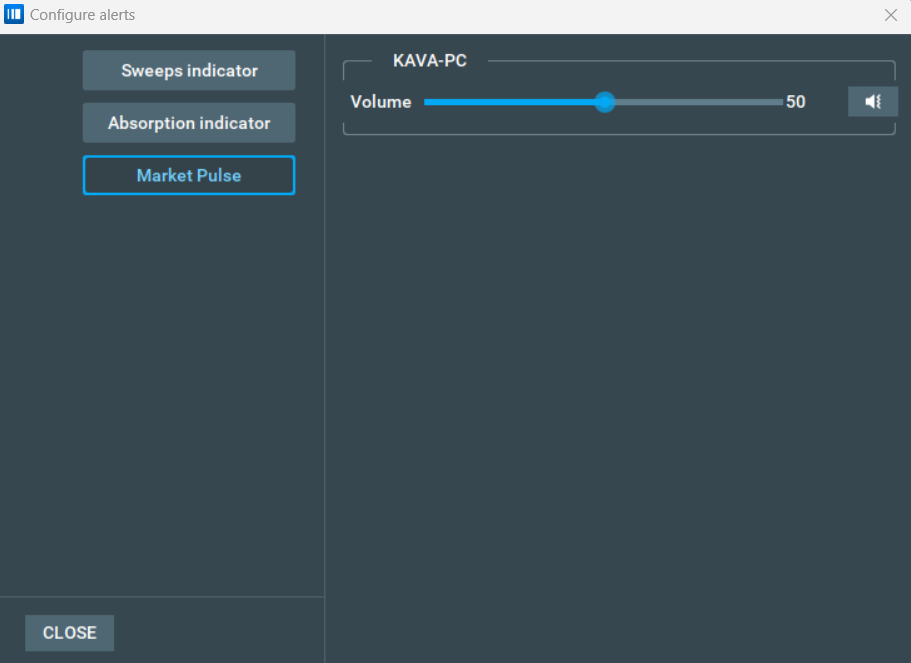
For detailed settings of the widget, use the "Configure add-ons" window or a detached settings window of the widget.
When you click on the "Remove alert" button, the registered alert will be deleted from the Alerts settings, and the widget whose alert configuration was deleted will become mute. When the widget is unmuted, it will be registered in the notification system again.
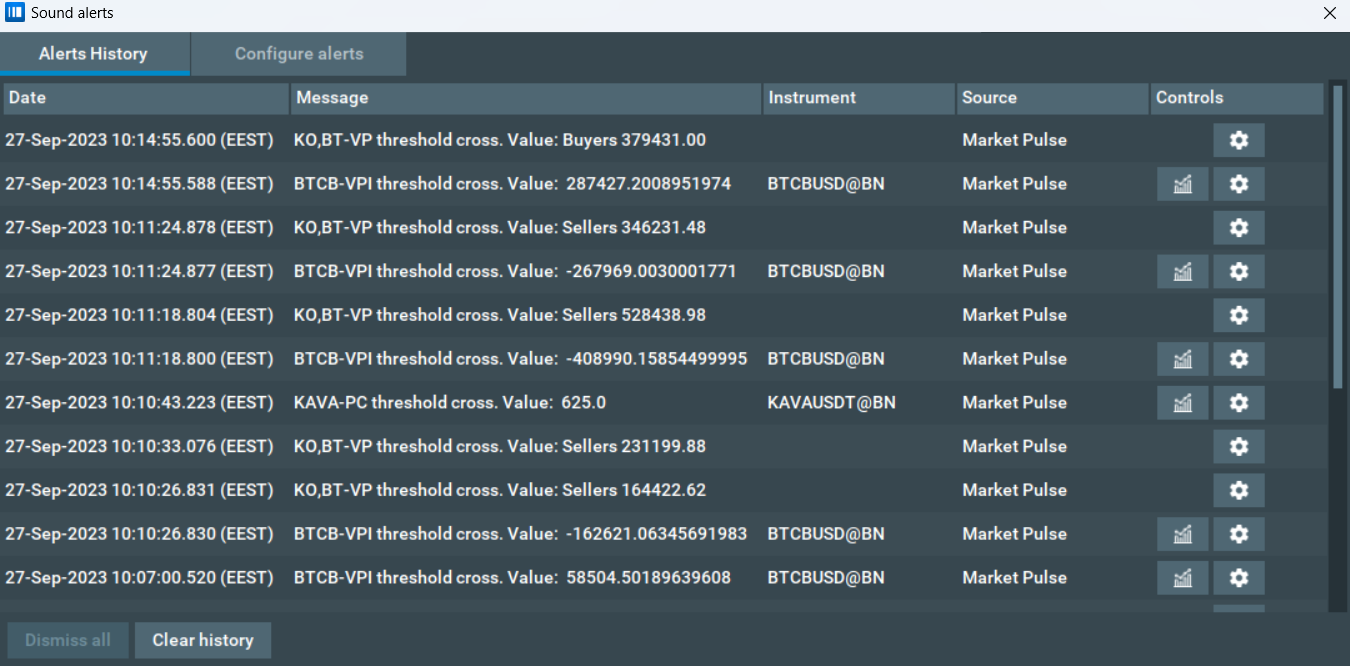
You can also view the history of sound alerts in the "File" -> "Alerts" -> "Sound alerts" -> "Alerts History" window. From here, you can see which widget made the sound, which indicator crossed the threshold value, with what value, etc.
Please note that you can see the instrument in the alert history only for widgets that work with a single Bookmap instrument, as this feature does not work for widgets that work on custom instruments or for widgets that are running with multiple instruments. To avoid spam, sound alerts with a single value are registered either when the threshold value is crossed or no more than once every 5 seconds.
Quick Start and FAQ
Here is an overview of the most frequently asked questions about the Market pulse algorithms. If you have any major questions you want to ask us, check through these first - we may have already answered it!
This is a very long quick guide. What's the fastest way to get started, understand what Volume Pressure does, and get an idea of its value?
- Follow the Installation section of the guide to install the add-on.
- Press the CREATE button
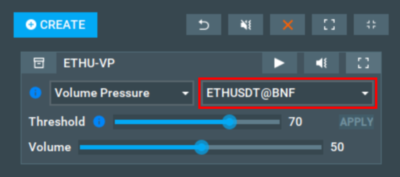
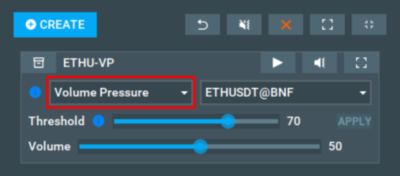
- Select any instrument with trading activity (i.e. with volume dots), along with the Volume Pressure algorithm.
- Press the start button

- A widget similar to below will appear, with seller pressure, buyer pressure, and threshold lines
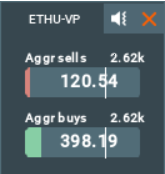
Equally, if you prefer a hands-on approach you can just install the Market Pulse add-on and mess around with the settings yourself. If you get stuck, you can refer to the specific section you need help with from the shortlist above.
Why does loading algorithms take so long?
- In the Bookmap Replay mode the widget waits for live data, so to start loading new data you need to unpause the replay. The load speed depends on the amount of data in the source instrument being used. If there are a lot of events (e.g. a few days or a week of data), it may take a long time for the algorithm to process it. It’s important to note that recalculations will be triggered if some configuration items such as the Half-life period are changed.
Is there a way to quickly switch between configurations?
I have 2 major configurations for different time intervals: from 1pm till 3pm I need to set one parameter, and from 3pm till 5pm I need to set a different parameter.
- Yes, absolutely! We recommend the following: first, create 2 widgets and name them “1-3pm” and “3-5pm” - read more about how to Name your widgets for help on this. Next, start both widgets and open the configuration panels by right-clicking on the widgets. This will allow you to compare the configurations and select the proper one for each. You will need to manually switch between widgets at 3pm, pausing one and starting the other.
What training period should I set?
- It depends on the instrument and your personal preference. To adjust the Training period, we suggest you look at the sub-chart line (specifically the number of spikes).
Example of wrongly configured training period:
The subchart line is too spiky (it is close to 100% most of the time):
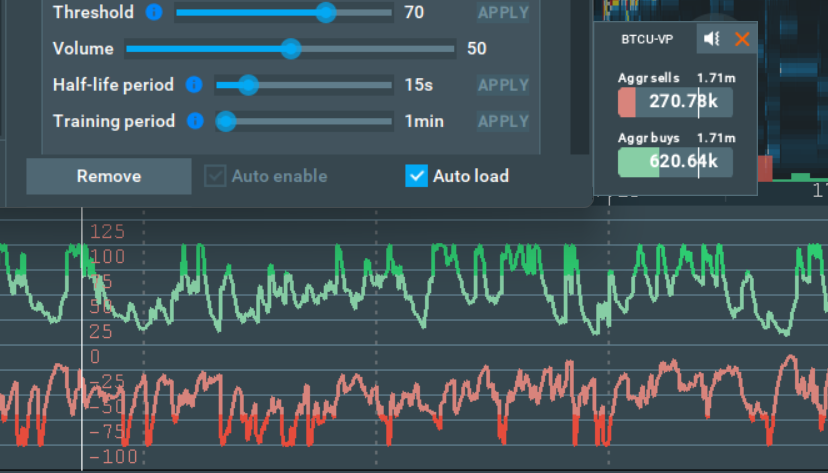
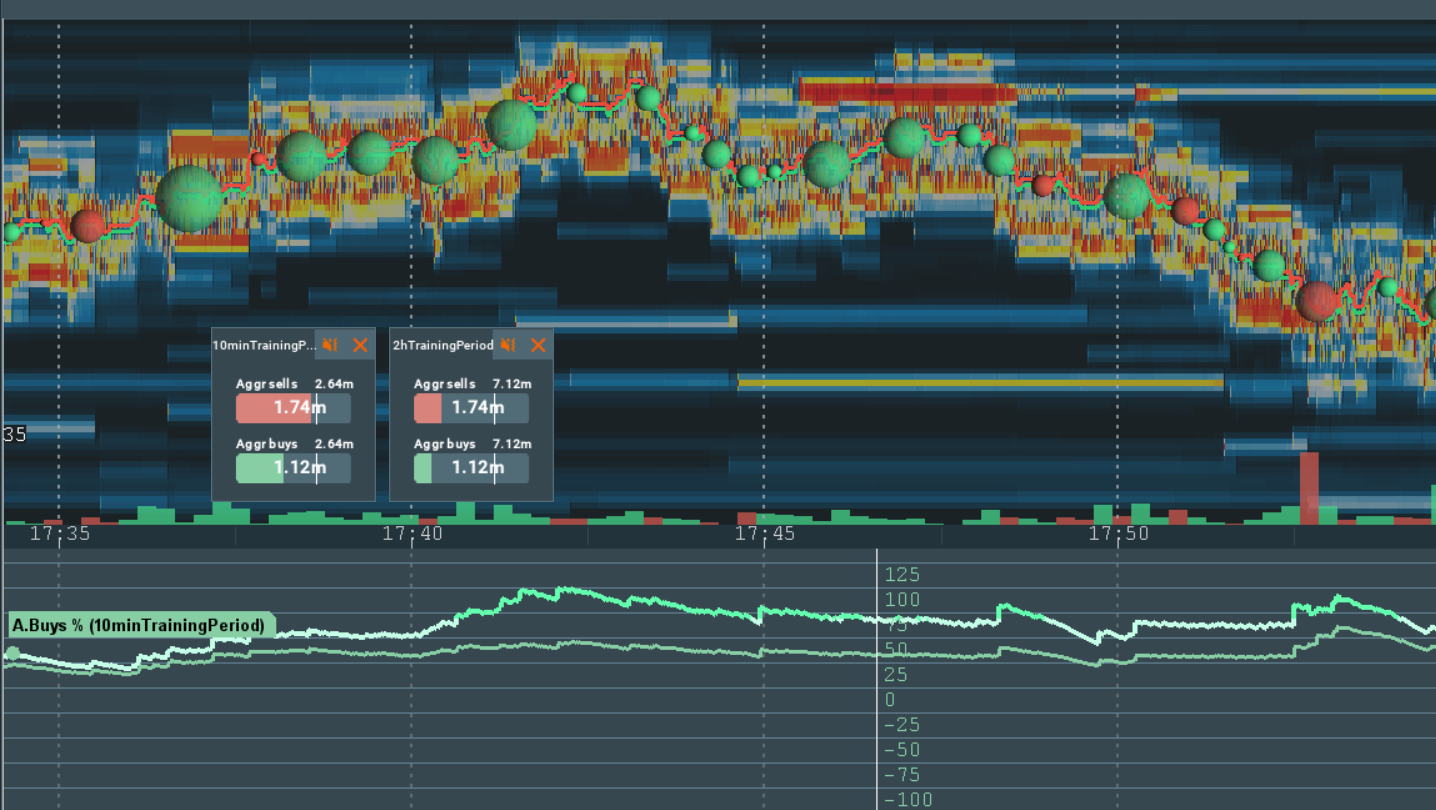
The higher the value of the Training period parameter, the fewer spikes on the sub-chart line you will see. This means that the longer the Training Period, the bigger a market event will have to be for you to be notified, while shorter Training Periods will pick up on smaller market events.
Example: Let’s take the Volume Pressure algorithm example below - the half-life period is set to 1 min. You can see that the subchart with the 10 min training period is more stuck to the top, because it represents the dynamics of smaller time periods. Meanwhile, the 2hr training period sub-chart deviates more, and you will be notified only about bigger changes on the market.
What half-life period should I set?
- The higher this parameter, the bigger the impact of previous events.
To choose what period suits your trading best, you can configure two widgets with the same parameters except for the half-life parameter, and compare the subchart lines.
Example: Here we will use Volume Pressure. As you can see, the 10 second line is much more volatile compared to the 1 minute line.
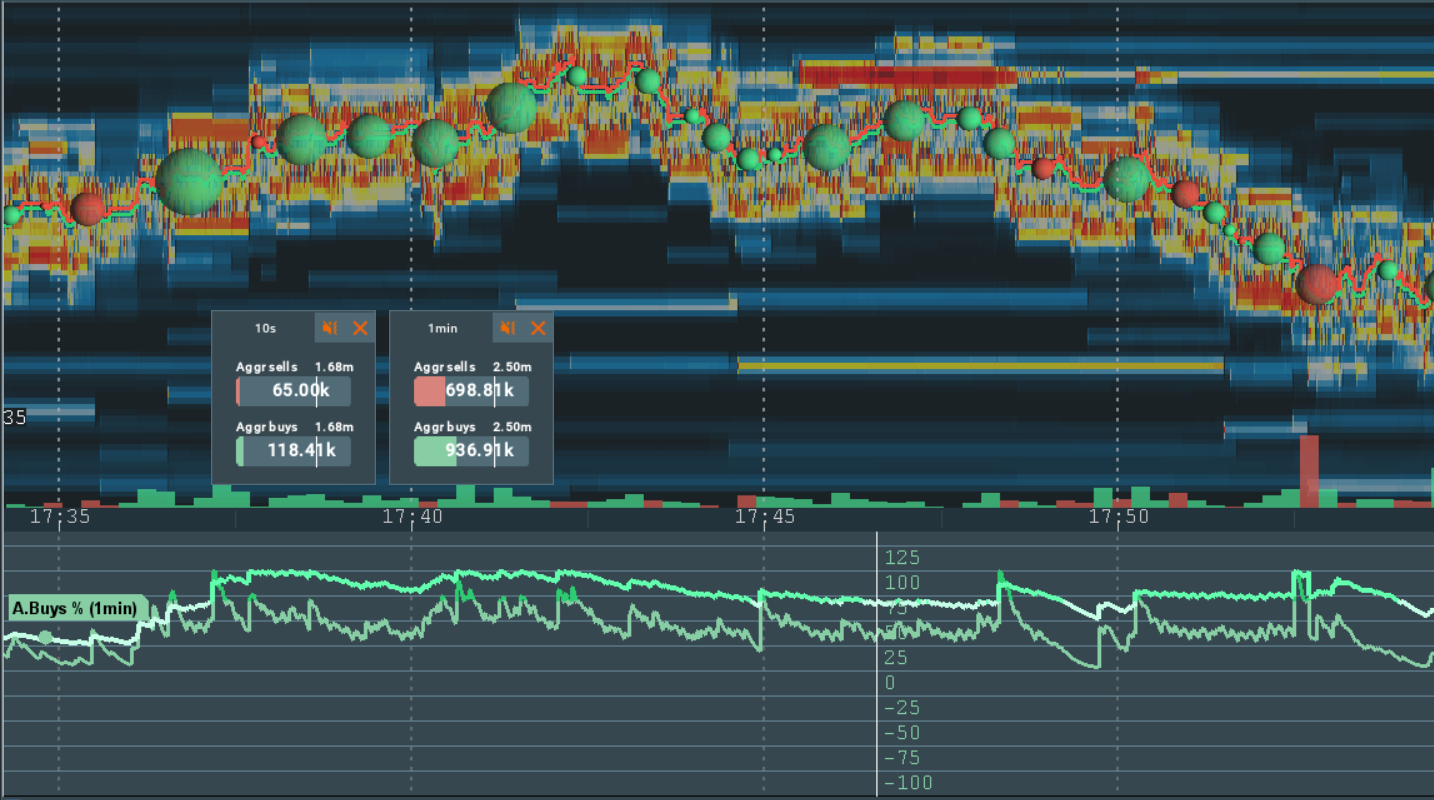
We recommend using common intervals, such as 1s, 10s, 1min, 10min, and 1hr to get the most out of this parameter.
Note!The more historical data you have, the higher the value of the half-life period could be. It is useless setting a 1hr half-life period if you have only 2 hours-worth of data. If you’ve just recently subscribed to an instrument, you will be waiting for some time until the average value becomes stable.
Before this happens you will be seeing the average value growing, so sound notifications might have unexpected behaviour, being either too frequent or intensive, and we advise you disable them until enough data have been received to stabilize the average value.
How can I configure the threshold? How can a sub-chart line help me to do this?
The Threshold parameter defines the minimum threshold, which when crossed leads to a sound being played. It is a percentage value. The higher this parameter, the fewer sound notifications will be played.
Sub-chart buyers/sellers pressure (%) lines are commonly used to adjust the threshold and training period. They show the activity of buyers/sellers in the market separately, how much it is in comparison to the average trade activity.
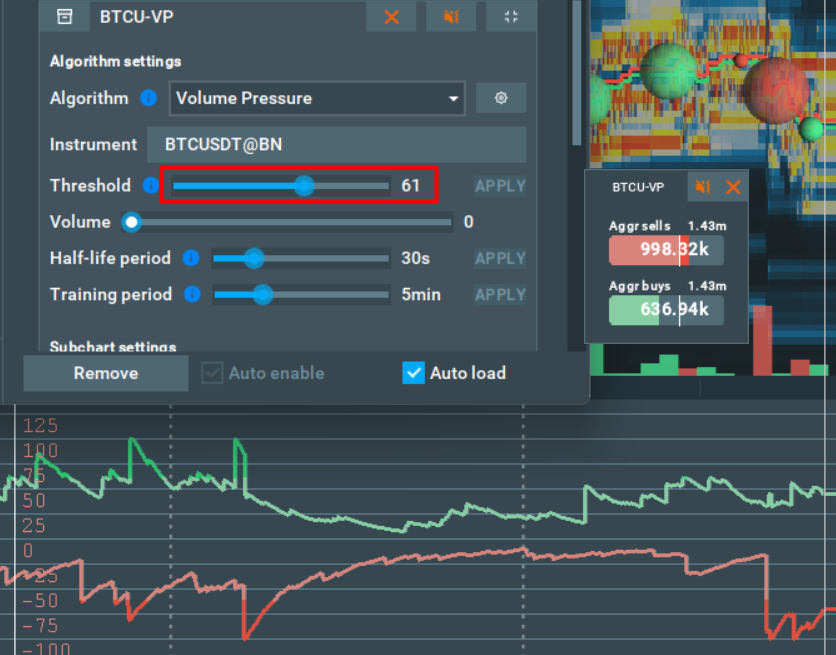
On the widget, the threshold is visualized by tiny white lines, and when the value crosses this line you will get a sound notification. On the sub-chart line, the threshold is visualized by the line turning other color, depending on who out of the sellers and buyers have more pressure.
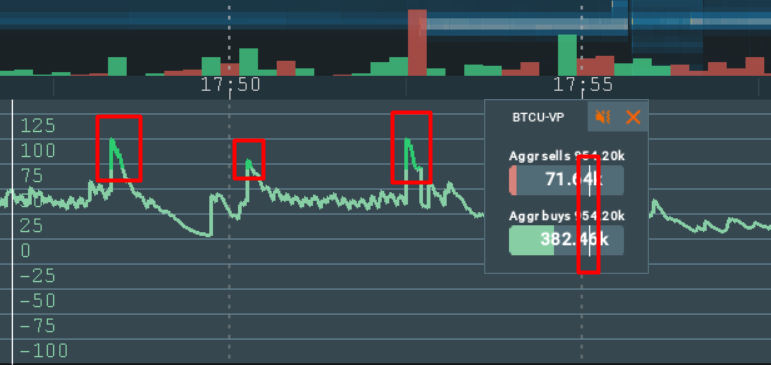
Example: I want to be notified about 3 spikes during the timeframe (1h, 30m, 10min, etc) if the market has the same activity as previous. Here’s what I need to do.
- Open the Bookmap sub-chart
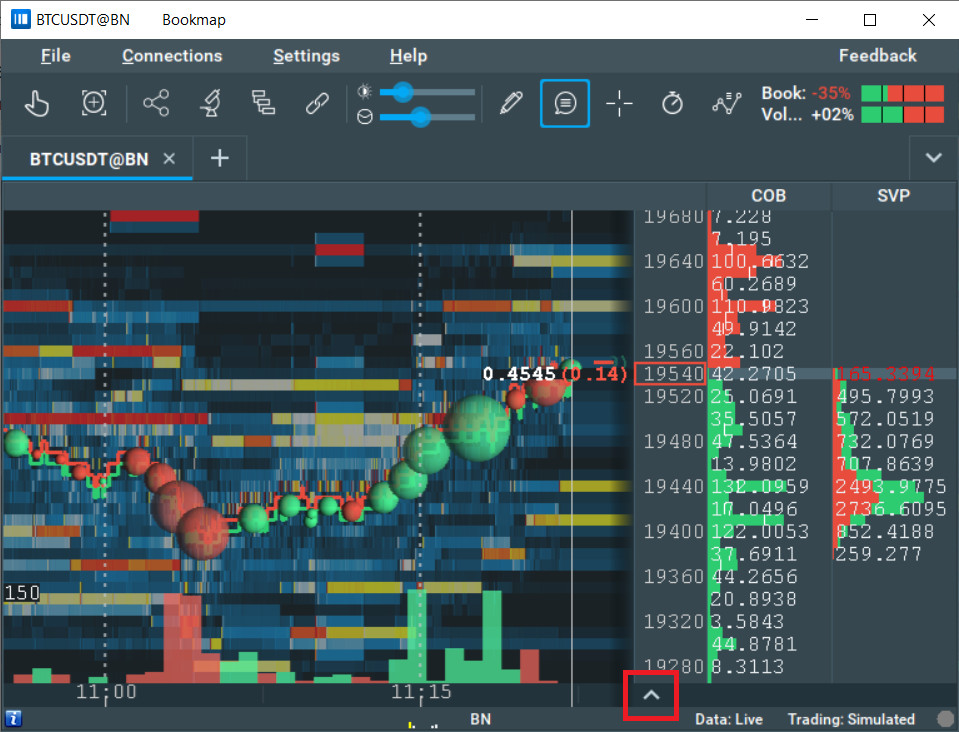
- Zoom out to the desired timeframe
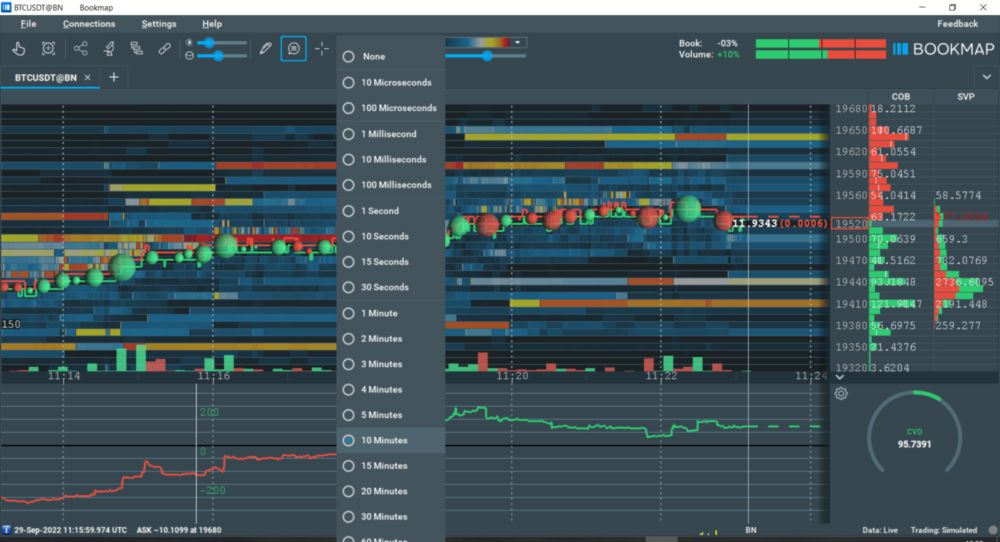
- Start the sub-chart percentage lines (it should start by default):
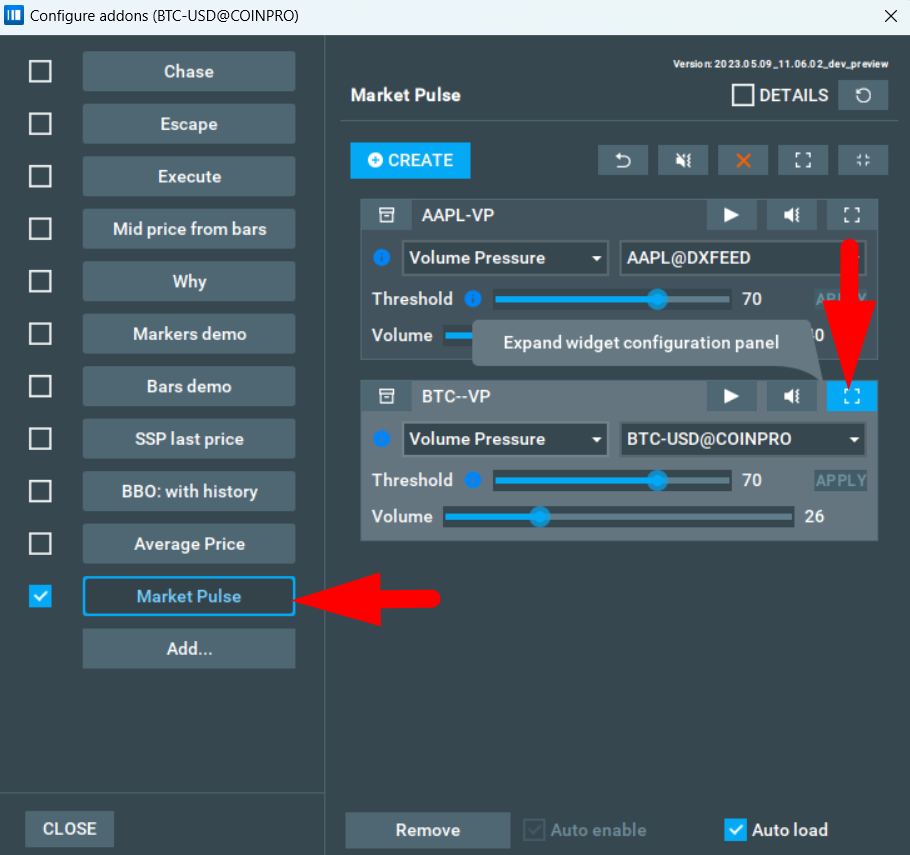
- Go to the add-on configuration dialog
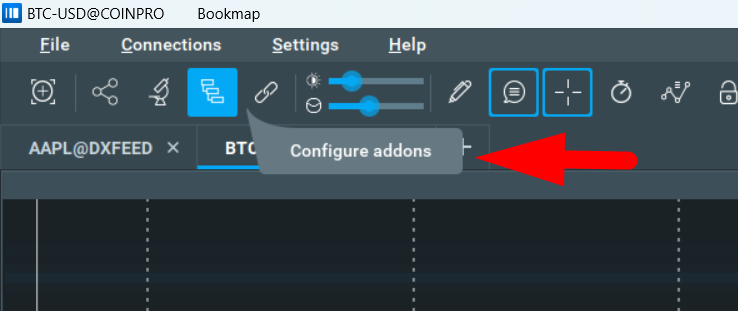
- Expand the corresponding widget panel
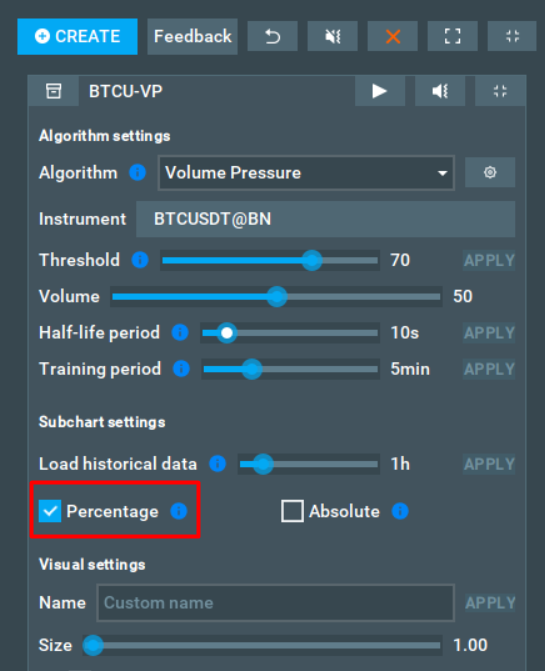
- Check the Sub-chart Percentage %
- Adjust the Threshold slider to have your preffered number of spikes marked with the red or green colored line.
How can I change the sub-chart color?
To change color, simply use the color settings of the widget. Also, the color of the indicator can be changed in the Bookmap sub-chart settings menu. Just click the line near the indicator name and a new window will pop up where you can select your preferred color.
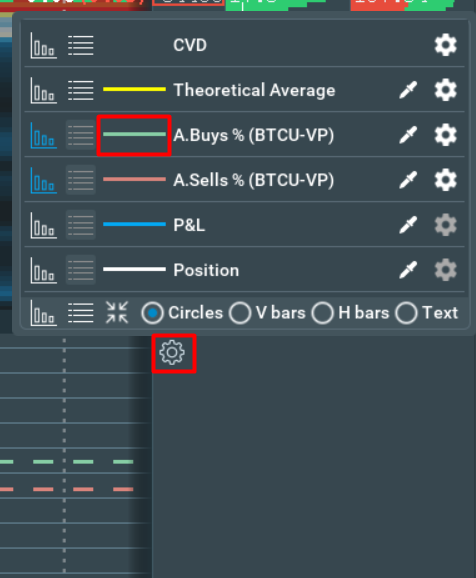
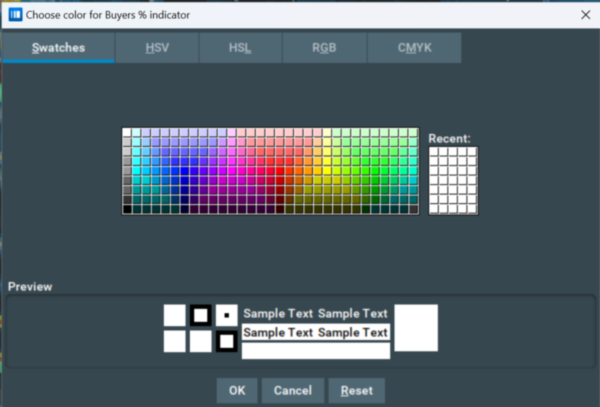
Or for more options, click the color-picker icon on the right of the name and select any color from your screen.
How can I load custom sounds?
Custom sounds are not currently supported, but they are something we are actively working to bring to Market Pulse.
How can I load custom algorithms?
Custom algorithms are not currently supported, but they are something we are actively working to bring to Market Pulse.
How can I improve performance?
Firstly, it’s important to note that these methods of performance improvement may decrease the accuracy of some algorithms. Please contact support@bookmap.com to get more information on how to improve performance in your specific case.
You can decrease the load on your system by accumulating the events to process them in bunches. The accumulation period is controlled by the parameter in the “experimental configuration” file (default location is C:\Bookmap\addons\ market-pulse\experimental.json).
If the parameter is not set, the default accumulation period is 20ms (milliseconds). You can increase this to 50ms, 100ms, or 200ms to improve the performance of the Market Pulse add-on. Large values may lead to event queue overflow on a longer time-scale, so it’s recommended to use values in the range of 20ms to 500ms.
Example: {"eventLoopDelay":100}
After the file is modified, the add-on needs to be restarted. To do this, you need to go to the add-on configuration dialog, disable the add-on (uncheck the box), and then re-enable it.
How many algorithms are there in the Market Pulse add-on?
There are currently 11 algorithms. However new algorithms will be added in the very near future, and we are working hard to expand our catalogue of algorithms substantially.
How much does the Market Pulse indicator cost?
The cost of the add-on varies depending on the specific data sources you wish to use it with. Rather than purchasing a particular algorithm, you're essentially buying the right to use it with certain financial instruments.
We offer three subscription packages:
-
Crypto: This gives you the freedom to use any algorithm with all available Crypto instruments. Visit the marketplace to know more.
-
Cedro: This provides you with the ability to use any algorithm with all available Cedro instruments. Visit the Bookmap Brazil to know more.
-
Futures & Stocks: This permits you to use any algorithm with all other instruments not included in the previous two subscriptions. Please note, this subscription does not cover usage with Crypto and Cedro instruments. Visit the marketplace to know more.
As a special offer, we're providing the Price Change algorithm for FREE as part of a trial with the Market Pulse add-on. The Price Change algorithm is available at no cost to all users across all instruments.
I can't launch the widget, what's the problem?
There are many possible reasons your widget may not be launching. Here are the most common problems:
Your subscription does not have access to use this algorithm.
The use of this algorithm is unavailable for your subscription. This means you will need to change or upgrade your subscription to access it.
The widget does not have an instrument to launch from.
The widget does not have a selected instrument, or the selected instrument is unavailable. Your subscription may not have access to the instrument your widget is attempting to launch from.
The widget cannot connect to the provider.
Some Market Pulse algorithms require another add-on with an up-to-date version. The algorithm failed to connect to such an add-on. Check that you have the current version of the provider add-on loaded.
For Absorption Pressure and Absorption Pressure Imbalance you must have Absorption Indicator v4.00 or newer.
For Sweeps Pressure and Sweeps Pressure Imbalance algorithms, you must have Sweeps Indicator v3.00 or newer.
For Stops Pressure and Icebergs Pressure algorithms, you must have Stops&Icebergs On-Chart v1.40 or newer, or B3 Icebergs On-Chart v1.04 for Cedro.
The widget does not have a provider instrument.
Market Pulse has connected to the required add-on provider (Absorption Indicator, Sweeps Indicator, Stops&Icebergs On-Chart or B3 Icebergs On-Chart). However, this add-on does not work on this instrument. Check that the add-on is enabled on this instrument.
Your subscription does not allow data broadcasting.
Your subscription does not allow the add-on provider (Absorption Indicator or Sweeps Indicator) to broadcast data. You will need to change or upgrade your subscription to allow this.
Liquidation Pressure cannot load a response from the server.
The Liquidation Pressure algorithm works with instruments that it retrieves via a separate connection. For some reason, this connection could not be established. Make sure that your internet connection is working correctly and try restarting Bookmap. If the problem continues, please contact support.
Liquidation Pressure cannot find available instruments.
For some reason, the instruments Liquidation Pressure works with are not available on the server. If this problem has occurred, most likely we are already working to solve it, however please feel free to report this issue to us here just in case.
You are trying to run an algorithm in replay mode.
Liquidation Pressure, Icebergs Pressure, and Stops Pressure do not support replay mode.
Installation
Known bugs and issues:
- CPU consumption: it is pretty high currently, and we will decrease it in the future. We do not recommend turning on the add-on for weak computers during trading sessions for now.
- MultiAlgo widget may not be removed after removing all widgets from the panel. (v7.31)
Check out the Cost section and purchase the subscriptions you need, depending on your trading preferences.
To install the add-on, simply get latest Bookmap and install it from the Add-ons Manager. If you'd like to learn more about the Add-ons Manager and how it can benefit your experience, please visit the following page.
Release notes
v8.03
- Added a new Widget settings window.
- Added a new "Coefficient" setting.
- Added a new "Sensitivity" setting.
7.43
- Fixed a memory leak when requesting historical data via BrAPI.
v7.37
- StackOverflowError has been fixed.
v7.31
- MultiAlgo is now only available in the Widget Panel. MultiAlgo is now always created when a Panel Widget is created.
v7.25
- Fixed a bug where the widget could not be moved when it was showing the “Loading” state.
- Fixed a bug where the MultiAlgo widget in the panel would not restart with MP restart.
v7.22
- Added the ability to merge widgets into a panel.
- Improved the ability to resize widgets.
- Added a menu popup to the widget.
v7.05
- Added Widgets Panel.
- Added new algorithm. Read more here: Multi Algo.
- MarketPulse has become available for BM 7.6.0.
v6.98
- New algorithm has been added. Read more here: Pace of Tape Imbalance.
v6.97
- Added "Flip" functionality.
- Added versioning to widget parameters.
- Added widget focus state visualization and header features.
- Updated addons core to version 1.64.
- Updated BrAPI to version 0.48.
- Renamed tooltips and control elements.
- Fixed color change issues for widget bars and subchart lines.
- Fixed issues on workspace reload.
- Fixed issues on instrument unsubscribe.
- Fixed issues on Bookmap shutdown.
- Fixed Liquidation Pressure infinite load state.
- Fixed BrAPI: instrument selection and zero value issue.
- Fixed freeze issue on frequent instrument switching.
- Fixed Orderbook Pressure half-life period.
v6.72
- New algorithms have been added. Read more here: Orderbook Imbalance, Pace of Tape, Stops Pressure, Icebergs Pressure.
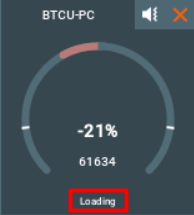
- Added hidden data reloading for all widgets. When you change the parameters that cause the data to be recalculated, the "Loading" label appears at the bottom of the widget. At this time, the widget and the enabled sub-charts continue to show data with the old settings. After the data is completely recalculated, the "Loading" label disappears, the widget shows the recalculated data, and the enabled subcharts are redrawn accordingly.
- Added a parameter to set the minimum amount of historical data for all widgets.
- Update to ensure the same sound strategy is applied to every algorithm.
- Links to the surveys for all algorithms can now be accessed by clicking on the "Feedback" button and selecting the chosen algorithm from the drop-down menu.
- Added the Multi Instrument to the Price Change and Spread Change algorithms.
- Added the ability to flip the widget bar and sub-chart values.
- Added color settings that allow users to customize the colors of subcharts and widgets.
- Changed the default colors for the algorithms.
- Added a feature that allows users to preserve their settings when switching between algorithms for the parameters that are repeated in the said algorithms.
- When creating new widget settings, the instrument on which the addon settings are open (the current Bookmap instrument) is selected by default.
- Removed the focus from the widget window to avoid intercepting keyboard shortcuts.
- Unified the settings order, added a subchart settings section, and unified the view of the subchart settings for all algorithms.
- Changed the names of bars and sub-charts to unified formats (specifying Aggressive/Passive).
- Implemented BrAPI provider functionality.
v5.74
- The Liquidation Pressure algorithm has been restored.
- Fixed a bug where the widget could be disabled or reloaded when the Absorption add-on is turned off.
v5.54
- New algorithms have been added. Read more: Orderbook Pressure, Orderbook Pressure Imbalance, Absorption Pressure, Absorption Pressure Imbalance, Sweeps Pressure, Sweeps Pressure Imbalance.
- Added a pop-up window that appears if the widget that was running was stopped.
- Fixed the bug where an empty instrument appeared in the multi instrument combobox.
- Fixed the ability of widgets to move to the top screen.
- Added an icon explaining why you can't run certain widgets when relevant.
- Optimized Market Pulse memory usage.
- Added a Loading State after changing settings that cause a recalculation in the Liquidation Pressure algorithm.
- Feedback popup has been removed from official release versions.
- When creating new widget settings, the default algorithm is now replaced with a bonus algorithm.
v5.41
- Added the ability to run some widgets with multiple instruments. Read more.
- Bookmap alert system has been added. Read more.
- Values for the Volume Pressure and Volume Pressure Imbalance algorithms are now displayed in the total amount for the current currency for the instrument (size * price).
- Shortened display of values to give a better understanding of large numbers in some widgets. For shortening, the letters k for thousands, m for millions, b for billions, t for trillions are used.
- Added a display of all running Bookmap instruments (instruments that are not available due to subscription restrictions will be grayed out).
- Fixed the issue of a shutdown of all threads after removing the add-on.
- Added a fix for add-on stability (to avoid such errors as NoClassDefFoundError and ExceptionInInitializerError while starting Market Pulse)
- Fixed the bug where the widget didn’t move across display borders.
- Fixed the bug that loaded the system when starting the widget.
- Changed the way of displaying pop-ups when Liquidation Pressure cannot load the instruments.
- Fixed the bug where sounds were reset to default when the add-on was turned off/on.
- Fixed the bug where when loading settings with a saved widget name in Liquidation Pressure widget, this name was sometimes not displayed on the widget.
- Fixed the bug where when deleting a custom widget name in Liquidation Pressure widget, the short widget name was not displayed.
- Fixed the bug where when resetting widget settings to default values in Liquidation Pressure widget, the widget stopped working.
- Fixed the bug where the threshold value sometimes was not changed on the widget with Liquidation Pressure algo after changing it in the widget settings.
- Improved the data display in the "Details" section of the widget after checking "Details" checkbox.
v1.51
- Fixed a bug when the first event was ignored by the Price Change, Spread Change, Volume Pressure, and Volume Pressure Imbalance algorithms.
- Fixed a bug with wrong muted/unmuted icon to widget muted/unmuted state.
- Added display of server error messages for the Liquidation Pressure algorithm.
v1.43
Published on July 18, 2023.
- A new pricing model has been introduced
- Consistency added between the mute button and volume slider
- Improved performance in high-speed Replay mode
- Fixed an error that occurred when double-clicking on a widget
- Fixed the slow-closing of widgets when closing applications with large numbers of widgets
- Fixed a bug that caused critical errors in the LP algorithm
- Fixed incorrect behavior when moving detached widget settings
- Added a new widget state of “No Data” that can occur if, for example, the market is closed, or if there are no relevant events for value calculating
- Size multiplier is now used for VP, VPI and LP
- The names of the algorithm lines on the subchart were brought into a single pattern