Options Strike
What is the Options Strike add-on?
Market maker gamma exposure, strike by strike, on your ES chart.
Options Strike is a Bookmap add-on, part of the Bookmap Options package. It draws SPX options positioning on an ES or MES chart. Each SPX strike gets one bar at its ES price. The bar shows how much market makers are exposed at that strike, and which way their hedging will push. The data is built by OptionsDepth from real market maker positions and updates every minute.

This guide explains what the profile shows, how to read it, and what every setting does. It assumes you already know your way around Bookmap. It does not assume any options background.
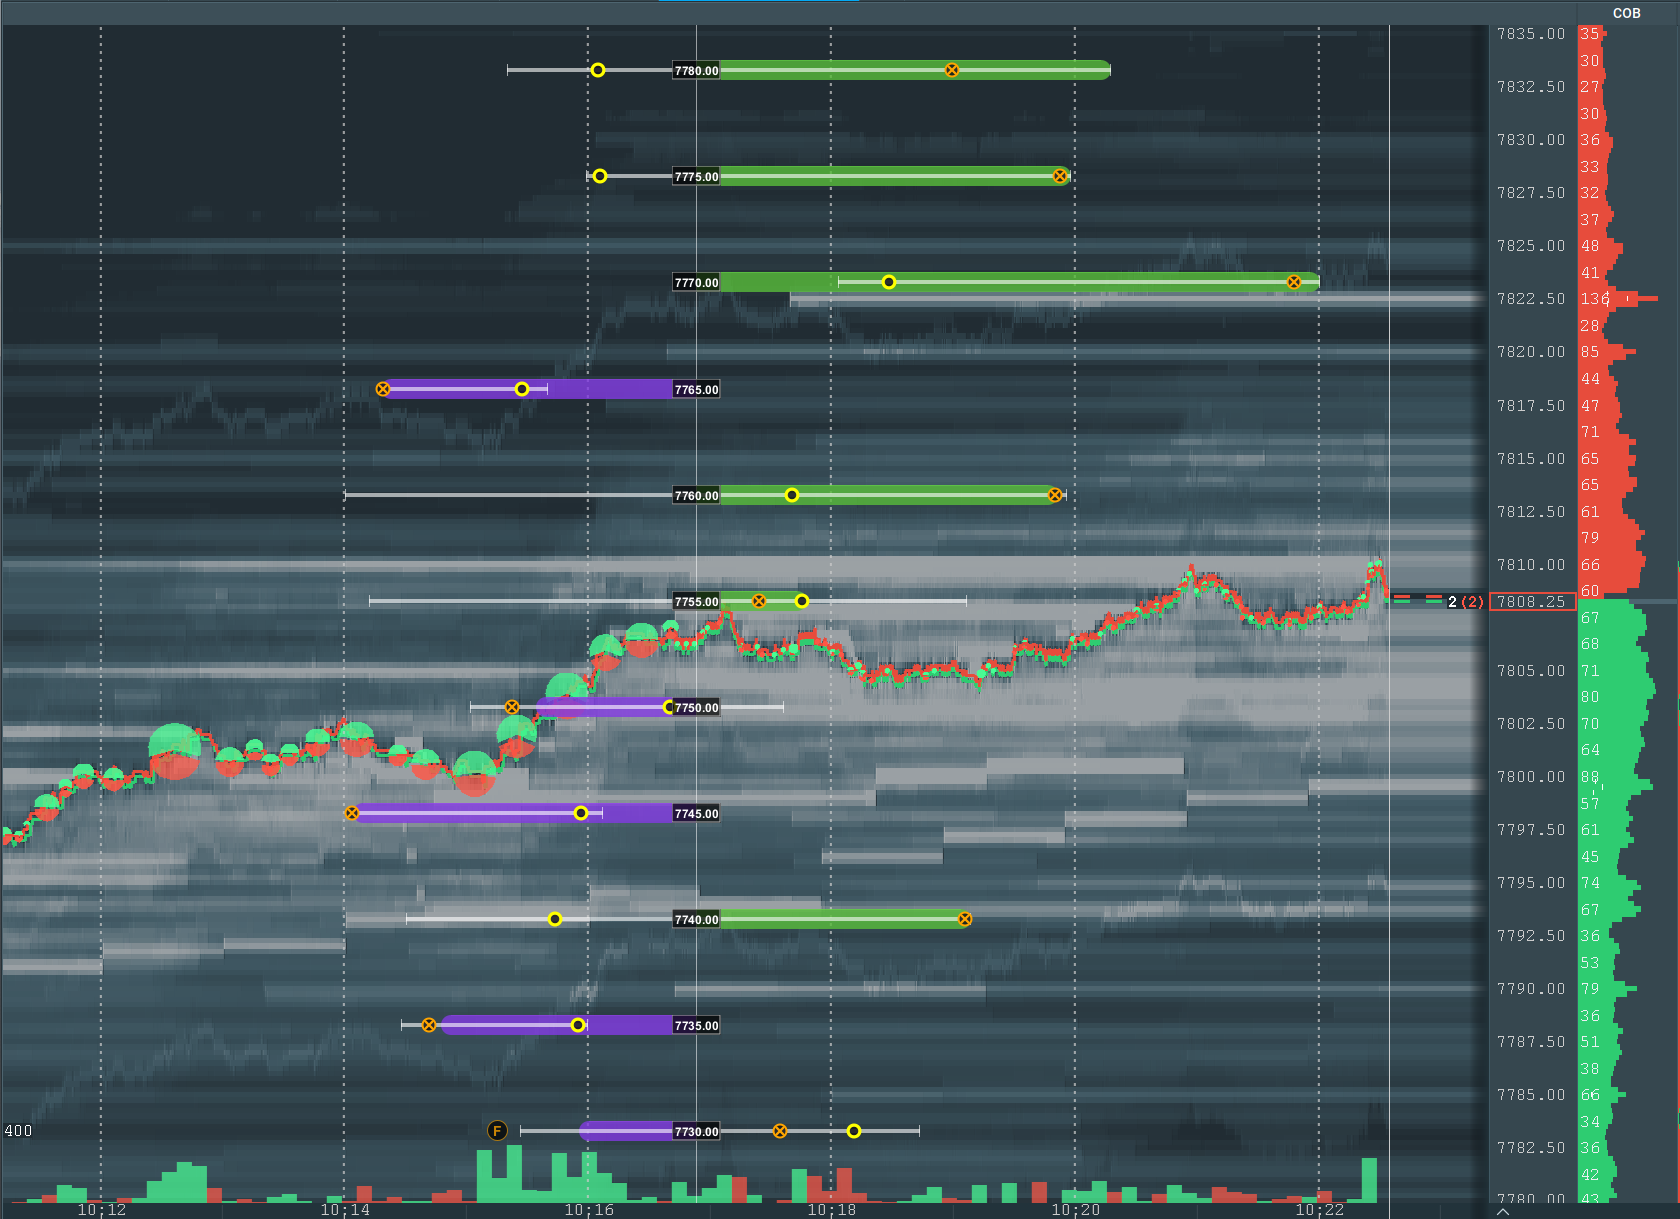
The profile shows market maker (MM) gamma exposure at each strike of S&P 500 index (SPX) options, drawn on your E-mini S&P 500 futures (ES) chart. Each strike is one horizontal bar at that strike's ES price.
- Green bar, extending right: market makers are long gamma at that strike. Their hedging tends to slow price down there.
- Purple bar, extending left: market makers are short gamma. Their hedging tends to speed price up there.
- Bar length: the size of the exposure, relative to the other strikes on screen.
Use it to see where MM hedging is likely to act as a brake and where it is likely to act as an accelerator.
Where the data comes from
The profile starts from real market maker trades, not from open interest and not from a guess about who holds each side.
- Cboe, the exchange that lists SPX options, tags every trade by participant type.
- OptionsDepth uses that data to build the real market maker net position for each option, and from it the gamma exposure at each strike.
- Bookmap fetches the result once a minute and draws it on your chart.
A new data minute arrives about once a minute from 04:00 to 17:00 New York time on US option-market trading days. Six minutes around the cash open are never published, and nothing new arrives after 17:00. See Trading hours and data timing.
Trading hours and data timing
All times are New York time (ET), it starts at 04:00 and ends at 17:00.
| Time | What arrives |
|---|---|
| 04:00 – 09:24 | one snapshot per minute (pre-market) |
| 09:25 – 09:30 | nothing: these six minutes are never published |
| 09:31 – 17:00 | one snapshot per minute; exposures keep changing after the 16:00 cash close |
| 17:00 – 04:00 next trading day | nothing new; the 17:00 snapshot stays on screen |
| Weekends and market holidays | nothing new; the last trading day's 17:00 snapshot stays on screen |
The session starts at 04:00
The Open marker, the Open line in the hover details and the day range count from the first snapshot of the day, normally 04:00. They do not reset at the 09:30 cash open. The 0DTE selection also switches to the day's expirations with the 04:00 snapshot.
The gap at the open
There are no SPX trades between 9:25 and 9:30, so the add-on does not receive any data during this window.
After 17:00
The last minute of the day is 17:00. From then until the next trading day's 04:00 snapshot the Status line reads
Up to date … with data as of 17:00 ET. Nothing is wrong: the service has nothing newer. The bars, the day range,
the wick and the Open marker keep the finished session on the chart until the new day starts at 04:00. Over a weekend
or a market holiday the last trading day's 17:00 stays on screen.
Delivery delay
Cboe delivers each minute with a delay of up to about 90 seconds, so Data as of normally trails your clock by one to two minutes.
Gamma in one minute
Two numbers explain the profile: delta and gamma.
- Delta is how much an option's price moves when SPX moves 1 point. A market maker hedges by holding the opposite delta, usually in ES futures.
- Gamma is how much delta changes when SPX moves 1 point. It tells you how fast the MM hedge has to change.
Gamma is highest at the money, where the strike is near the current SPX price, and low for strikes far from price. Near expiration gamma concentrates near price. It is strongest for zero days to expiration (0DTE) options in the last hours of the session. Lower implied volatility also makes the peak sharper.
The sign comes from the market maker position
A long option has positive gamma. A short option has negative gamma. So the market maker's net position at a strike sets the sign of the exposure:
| Market maker net position | Exposure |
|---|---|
| Net long calls or net long puts | Long gamma (positive, green) |
| Net short calls or net short puts | Short gamma (negative, purple) |
Whether the option is a call or a put does not set the sign. Only the MM position does. The sign changes only when the MM net position changes sign.
What the number means
Each strike's value is:
Millions of US dollars of market maker delta change for each 1-point move in SPX.
A strike showing +$157M means: if SPX moves 1 point, the market makers' net delta at that strike changes by $157 million of index exposure. That is the amount they have to trade to stay hedged.
The Hedge line: from dollars to ES contracts
The hover details convert that figure into ES contracts over a 1% move in SPX, the unit dealer gamma is usually quoted in. One ES contract is worth $50 per index point, so at an ES price of 7,682 one contract controls about $384,000 of notional. Dividing gives the contracts per point; a 1% move at strike 7,680 is 76.8 points:
$157,000,000 / (50 × 7,682.53)  ≈  409 ES contracts per point
409 × 76.8                       ≈  31,400 ES contracts per 1%
So if SPX traveled 1% through that strike, this strike alone would force roughly 31,400 ES contracts of dealer hedging. On an MES chart the same exposure reads about 314,000 MES, since a micro contract is $5 per point. A smaller strike, say +$1.7M, reads about 4.4 ES per point and 340 ES per 1%.
The 1% figure is a straight-line scale: it takes the strike's gamma as constant across the move. Real gamma is highest with price at the strike and fades away from it, so the actual flow over a full 1% is less. Read it as a ruler for comparing strikes, not as a forecast of what will trade.
What it is, and what it is not
- It is one strike's contribution. The total dealer flow at any moment is the sum across nearby strikes and all expiries. A cluster of same-sign strikes adds up.
- It assumes dealers hedge fully and in ES. Some hedging goes through SPY, SPX futures spreads, or is netted against other books. What you see on the ES tape is a fraction.
- It is a snapshot, one value per minute. In a fast tape the position changes between updates.
- On the chart, only the relative size and the sign matter. The exact number is in the hover details.
How market maker hedging moves price
Market makers hedge their delta. When price moves, gamma changes their delta, and they trade again to stay hedged. Which way they trade depends on the sign.
| Price move | MM long gamma (green) | MM short gamma (purple) |
|---|---|---|
| Price goes up | MMs sell | MMs buy |
| Price goes down | MMs buy | MMs sell |
| Effect | Hedging goes against the move. Moves are damped. | Hedging goes with the move. Moves are amplified. |
| Think of it as | a brake | an accelerator |
Near expiration, time decay (charm) also moves MM hedges. It tends to pull price toward long-gamma strikes and push it away from short-gamma strikes.
What price usually does at a strike
These are tendencies, not rules.
At a brake (long gamma):
- Price slows on the approach.
- It often stalls or turns back at the first test.
- At the strike it often chops in a narrow range.
- Near expiration, it often pins to the strike.
At an accelerator (short gamma):
- Price speeds up on the approach.
- It crosses the zone fast.
- The range expands.
- It often runs to the next long-gamma strike.
Strong aggressive flow can break through a long-gamma strike. Price can then travel fast to the next level.
What makes a strike stronger
Three things set the strength of a strike:
- Size of the MM position. A bigger position gives a bigger bar.
- Distance from price. The same position gives a bigger bar when it is near price, because gamma peaks at the money. A large position far from price shows a small bar now and grows if price comes near it.
- Time to expiration. Near expiration, bars near price grow and far strikes fade. For 0DTE options the strikes near price tend to grow toward the close.
A cluster of same-sign strikes acts as a zone. Their effects add up.
Getting started
Install
- Use the Addons Manager in Bookmap to install the add-on. It is called Options Strike.
- In Bookmap open Configure add-ons and enable Options Strike on an ES or MES chart.
First load
Open the add-on settings. The panel is titled Options Strike. Within about a minute the bars appear, and they refresh automatically every minute after that. Polling is always on.
The Status card at the top tells you what is happening:
- Update Now fetches immediately instead of waiting for the next minute.
- The line next to it reads
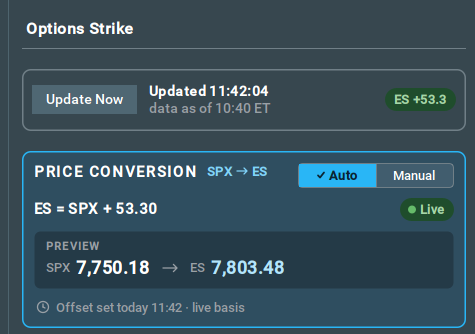
Updated 11:42:04withdata as of 10:40 ETunderneath when new data arrived,Up to date …when the service had nothing newer, orFailed …with the reason in orange underneath when something went wrong. The first time is your computer's clock. The as-of time is the data minute in New York time. In the screenshot below the computer is one hour ahead of New York, so 11:42:04 on the clock is 10:42 ET, and the 10:40 data minute trails it by about two minutes, which is normal (see Delivery delay). - The small pill on the right,
ES +53.3in the screenshot, shows the SPX-to-ES price conversion in use: ES is 53.3 points above SPX (see Price conversion (SPX → ES)).
Wrong instrument
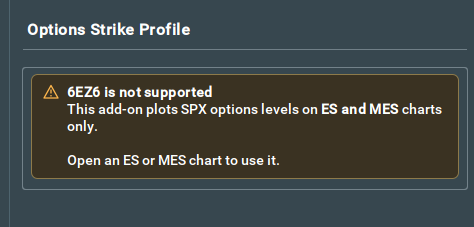
The add-on only runs on ES and MES. On any other chart the settings panel shows just the title and an amber
banner: "<symbol> is not supported. This add-on plots SPX options levels on ES and MES charts only. Open an ES or
MES chart to use it."
Reading the chart
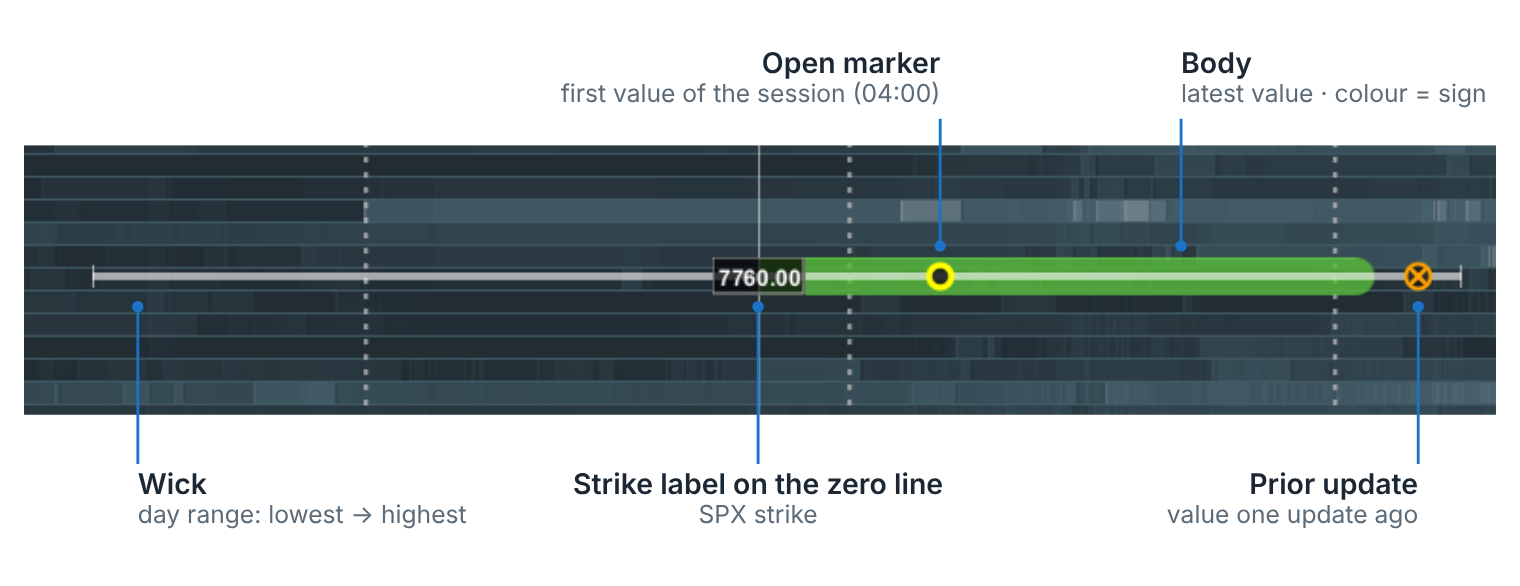
A vertical zero line runs through the heatmap. Each strike is a horizontal bar at its ES price, starting at the zero line. Positive values extend right, negative values extend left. Bar lengths are relative: the largest value on screen sets the scale.
The strike label on the zero line always shows the SPX strike (for example 7760.00), the bar itself sits at
the ES price of that strike.
Bars, wicks and markers get thinner as you zoom out, in order to avoid overlapping. The sizes in the Display settings are the largest they get. By default, bar lengths use a square-root scale, so small strikes stay visible next to the largest one.
There are two display styles. Pick one with the Display > Style buttons: click Candle profile or Simple bars; the selected one is highlighted in blue with a check mark.
Simple bars
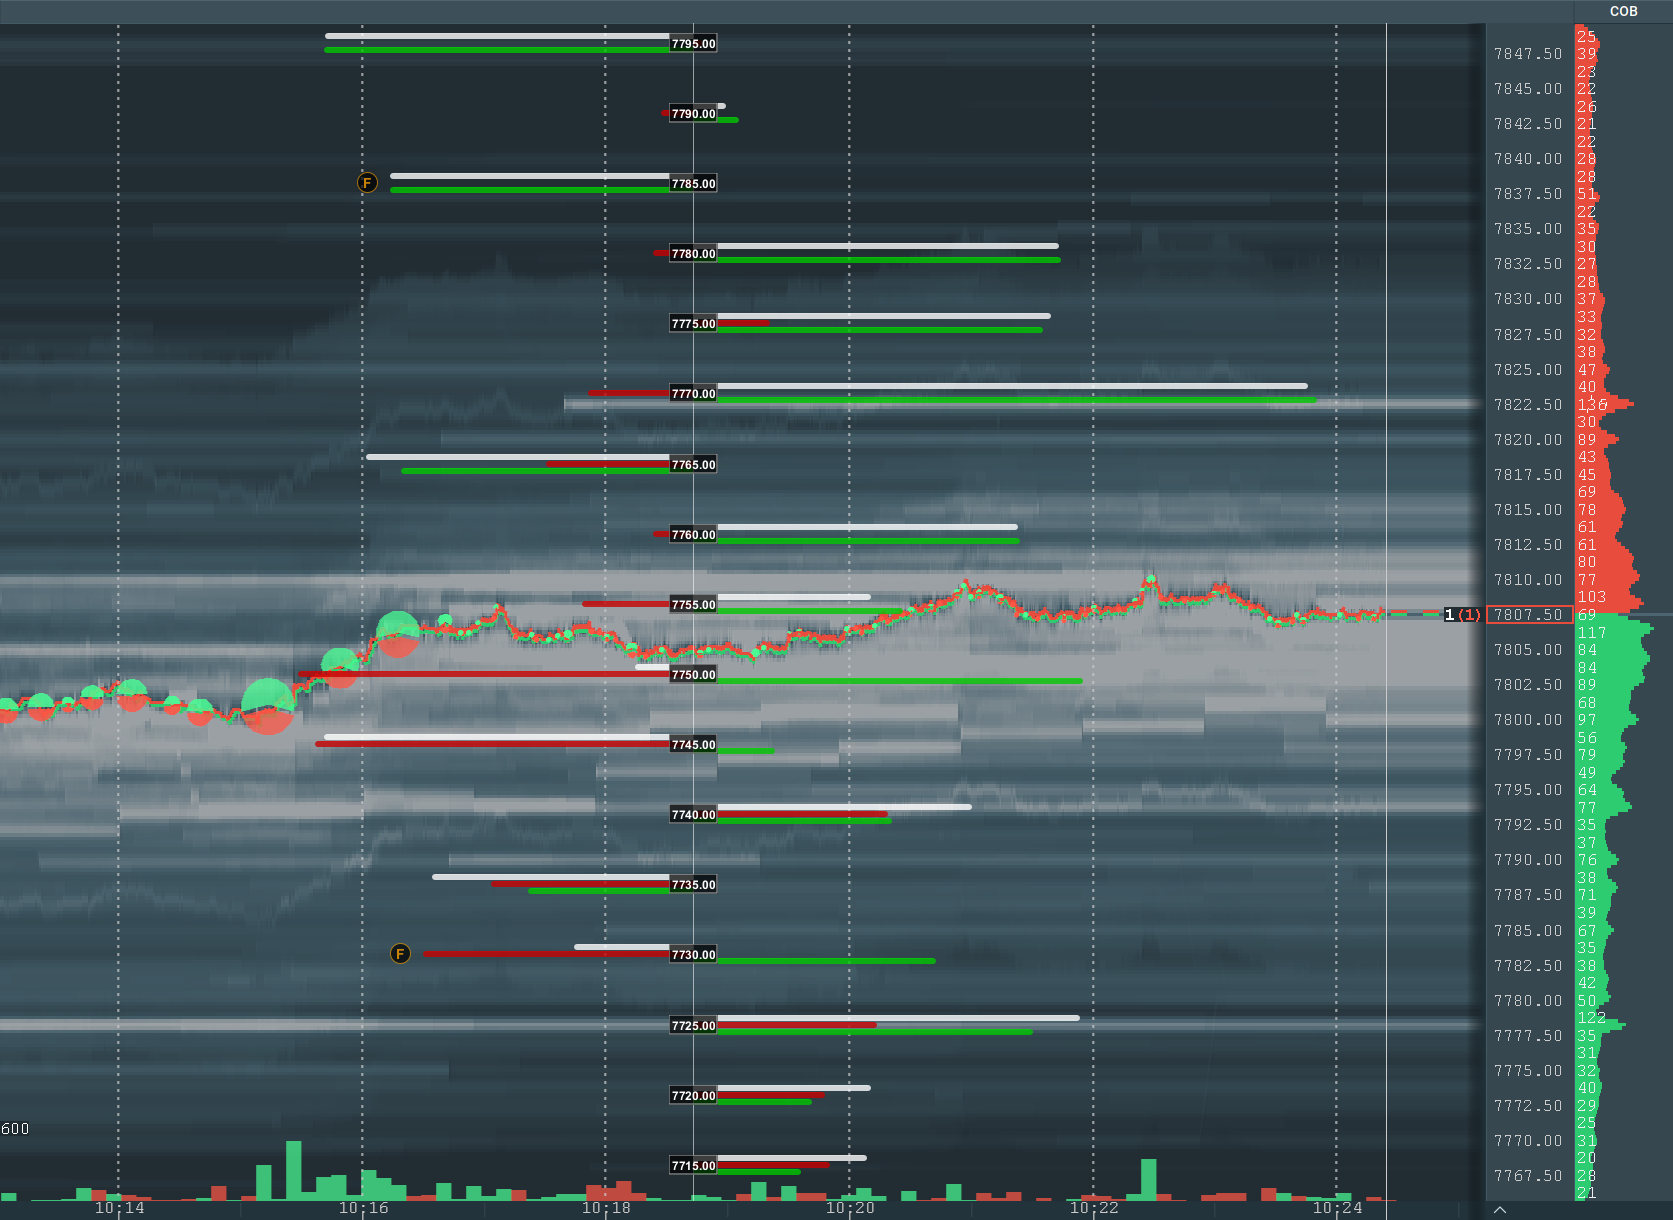
Up to three thin bars per strike, drawn in fixed colors whatever their sign:
| Bar | Colour | Shows |
|---|---|---|
| Calls | green | MM gamma exposure from call options at that strike |
| Puts | red | MM gamma exposure from put options |
| Net | white | calls + puts |
Each bar can be switched off in the settings. The style shows the latest value only, with no wick and no markers.

Candle profile (default)
One thick bar per strike, colored by sign, that shows how the strike's exposure changed today. It is not a price candle.
| Element | What it shows |
|---|---|
| Body | the latest value. Length is the size, colour is the sign: green long gamma, purple short gamma. |
| Wick (thin white line) | the day range: the lowest to the highest value today. It can cross the zero line. |
| Open marker (yellow ring) | the first value of the session, normally the 04:00 pre-market snapshot (not the 09:30 cash open). |
| Prior update marker (orange ring with an X) | the value at the previous update, about one minute before. |
The candle shows one option type at a time: Net (calls + puts, the default), Calls, or Puts. Choose it with Display > Option type.
Hover details
Move the pointer onto the zero line at a strike. A dark card appears in the bottom-left corner of the heatmap with that strike's numbers.
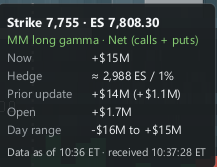
| Line | Meaning |
|---|---|
| Strike · ES | the SPX strike and the ES price it is drawn at |
| MM long / short gamma · type | the sign of the latest value, and which options are included (Net, Calls or Puts) |
| Now | the latest value: $M of MM delta change per 1-point SPX move (What the number means) |
| Hedge | the ES (or MES) contracts market makers must trade over a 1% SPX move through this strike (What the number means). |
| Prior update | the value one update ago, and in brackets the change since then |
| Open | the first value of the session, normally the 04:00 snapshot (Trading hours and data timing) |
| Day range | the lowest and highest value today, the wick |
| Data as of · received | the data minute in New York time, and when your Bookmap received it |
Amounts use B for billions, M for millions and K for thousands. $0 means no exposure.
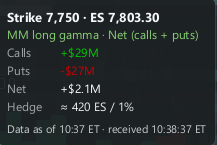
In Simple bars the card lists the Calls, Puts and Net rows in their bar colors instead of Now / Prior / Open / Day range. The side line follows the sign of the net value, and the Hedge line comes after Net when the Net bar is on. Bars switched off in the settings are not listed.
If flip detection is on and this strike is a flip, a line above the footer reads Gamma flip · long to short or
Gamma flip · short to long, read upward through the strikes.
Reading patterns
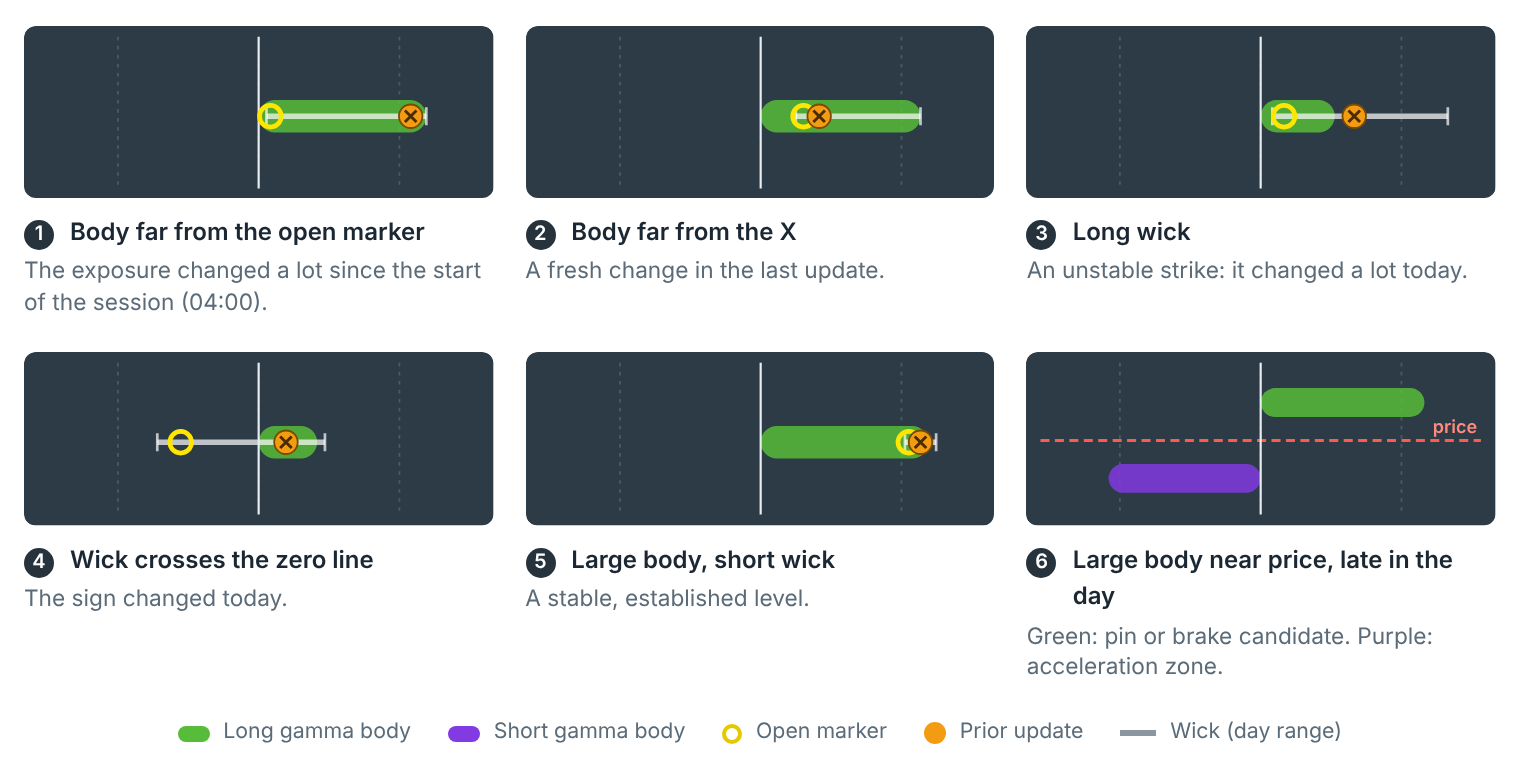
In the Candle profile, the shape of a candle tells you how the strike changed today.
| Shape | Usually means |
|---|---|
| Body far from the open marker | the exposure changed a lot since the start of the session (04:00) |
| Body far from the X | a fresh change in the last update |
| Long wick | an unstable strike: it changed a lot today |
| Wick crosses the zero line | the sign changed today |
| Large body, short wick | a stable, established level |
| Large body near price, late in the day | green: pin or brake candidate. Purple: acceleration zone |
Combine with order flow
The profile shows where MM hedge flow is likely. Bookmap's order flow shows what traders are doing at that price now. Use them together.
- Long-gamma strike + large resting liquidity on the heatmap: higher chance of a stall.
- Short-gamma zone + thin liquidity: higher chance of a fast move.
- Late in the day, 0DTE strikes near price usually have the largest effect.
Use it to find the levels to watch. Then let the order flow show what price does there.
Price conversion (SPX → ES)
The options data is for SPX, but the chart is ES or MES. The two trade a few points apart; the gap comes from interest and dividends until the futures expiration and changes daily. The add-on shifts every SPX strike by this gap so the bars line up with the ES price. Conversion is always on.
ES level = SPX strike + offset e.g. 7,755 + 53.25 = 7,808.25
The Price Conversion card on the settings panel has two modes, switched with the Auto | Manual toggle.
Auto (default)
The add-on measures the offset itself from live prices: the ES trade just before each data minute, minus the SPX price that arrives with the data. You do not need to set anything.
- The first update after loading sets the offset. A reload during the day keeps the value measured earlier today.
- After that the offset follows the median of the last 15 updates and only moves in steps of 0.5 or more, so it does not jitter.
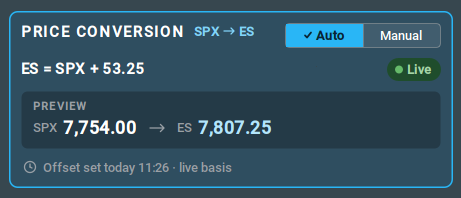
- The card shows the formula in use, for example
ES = SPX + 53.25, with a green Live pill and the footerOffset set today 11:26 · live basis.
Manual
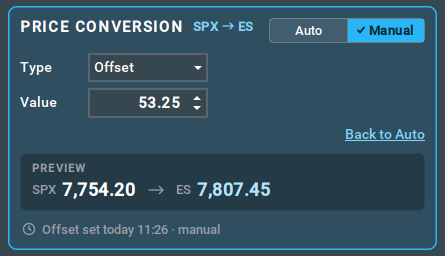
Pick Manual to type a value yourself. Choose Offset (ES = SPX + value) or Ratio (ES = SPX × value).
Switching to Manual copies the live offset as a starting point: in the screenshot below, the Auto offset of 53.25
becomes the Manual Value of 53.25, and the footer changes to · manual. For a value of your own, take the current
SPX price from a quote site and subtract it from the ES price.
| Pill | Meaning |
|---|---|
| Live (green) | Auto mode: the offset is measured from live prices |
| Active (green) | Manual mode: your value is in use |
| Check (amber) | your value looks wrong: it is 0 (or a ratio of 1), so levels are still at SPX prices; or it was set before today and the basis changes daily |
Back to Auto returns to the live offset.
The PREVIEW box shows the current data's SPX price converted with the settings above, for example
SPX 7,754.00 → ES 7,807.25 in Auto (7,754.00 + 53.25). The SPX price follows each new data minute, so the Manual
screenshot, taken on a newer minute, shows SPX 7,754.20 → ES 7,807.45 with the same 53.25 offset. The footer says
when the value was last changed and how (live basis or manual).
Settings reference
Open the add-on settings from the chart. Sections appear in this order.
Status
| Control | What it does |
|---|---|
| Update Now | Fetch data from the service immediately. Disabled while the request is invalid (the tooltip says why). |
| Status line | Updated, Up to date or Failed with your clock time. Underneath: the data minute in ET, or for Failed the reason, in orange. |
| Conversion pill | The SPX-to-ES conversion in use, for example ES +53.3 or ES ×1.006867. Amber · check when it needs attention. |
Price Conversion
| Control | Default | What it does |
|---|---|---|
| Auto / Manual | Auto | Auto measures the ES − SPX offset from live prices. Manual uses a value you type. |
| Type (Manual) | Offset | Offset: ES = SPX + value. Ratio: ES = SPX × value. |
| Value (Manual) | live offset / 1.0 | Offset from −1000 to 1000 in steps of 0.25. Ratio from 0.000001 to 1000. |
| Back to Auto (Manual) | Use the live offset again. | |
| PREVIEW | The current data's SPX price converted with the settings above. |
Data
| Control | Default | What it does |
|---|---|---|
| Locked summary | SPX · GEX · Market Makers · Net positions · intraday | Fixed in this version: SPX market-maker gamma exposure, net positions, intraday model. |
| Expiration | 0DTE | 0DTE: options expiring today only. All expirations: every open expiration. |
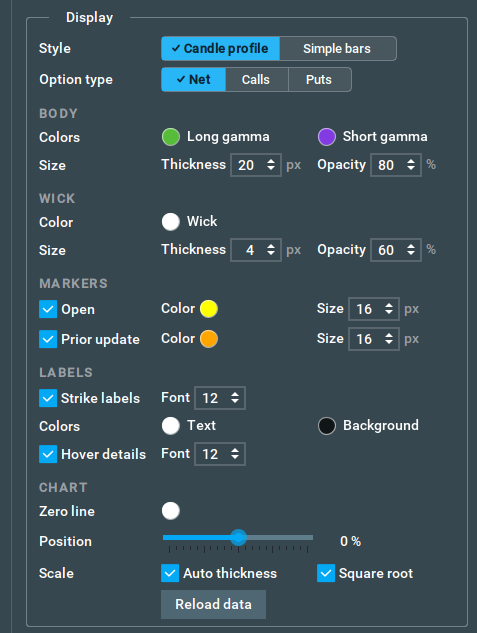
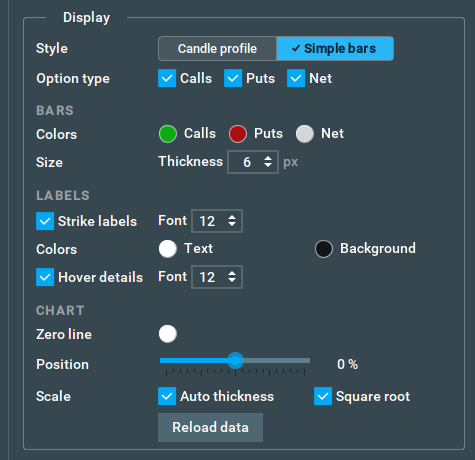
Display
| Row | Default | What it does |
|---|---|---|
| Style | Candle profile | Simple bars: three thin bars per strike (calls, puts, net). Candle profile: a body from the zero line to the latest value, a wick over the day's range, open and prior-update markers. Switching reloads the data. |
| Option type (candle) | Net | Net (calls and puts together), Calls only, or Puts only. Reloads the data. |
Body (candle)
| Row | Default | Range |
|---|---|---|
| Colors: Long gamma / Short gamma | green #57BC3A / purple #823AE2 | click a swatch to change; the picker has Reset to default |
| Size: Thickness | 14 px | 1–30 (the largest size with Auto thickness) |
| Size: Opacity | 80 % | 0–100 |
Wick (candle)
| Row | Default | Range |
|---|---|---|
| Color | white | |
| Size: Thickness | 4 px | 1–30 |
| Size: Opacity | 60 % | 0–100 |
Markers (candle)
| Row | Default | Range |
|---|---|---|
| Open (ring at the session's first value, normally 04:00) | on, yellow | size 12 px, 4–30 |
| Prior update (X at the value of the previous update) | on, orange | size 12 px, 4–30 |
Option type (simple bars)
| Row | Default | What it does |
|---|---|---|
| Calls / Puts / Net | all on | Draw that bar. A bar that is off is not drawn, not counted in the length scale and not listed in the hover card. |
Bars (simple bars)
| Row | Default | Range |
|---|---|---|
| Colors: Calls / Puts / Net | green / red / white | |
| Size: Thickness | 6 px | 1–30 |
Labels
| Row | Default | What it does |
|---|---|---|
| Strike labels | on, font 12 | Strike price labels at the zero line. Font 8–16. |
| Colors: Text / Background | white / black | |
| Hover details | on, font 12 | The hover card. Font 8–32; the box grows with it. |
Chart
| Row | Default | What it does |
|---|---|---|
| Zero line | white | Colour of the vertical line where exposure is zero. |
| Position | 0 % | Shift the profile left or right: 0 = centred, +25 = a quarter to the right, −25 = a quarter to the left. Range −50 to +50 in steps of 5. |
| Scale: Auto thickness | on | Bars, wicks and markers get thinner as you zoom out, so strikes never overlap. The sizes above are then the largest they get. |
| Scale: Square root | on | Square-root bar lengths, so small strikes stay visible next to the largest one. |
| Reload data | Clear the profile from the chart and load the latest data again. |
Alerts
| Control | Default | What it does |
|---|---|---|
| Sound: Play on update | off | Play a sound when data is updated. It also plays on a manual Up to date and on most fetch errors. |
| Volume | 5 | 0 = off, 10 = maximum. |

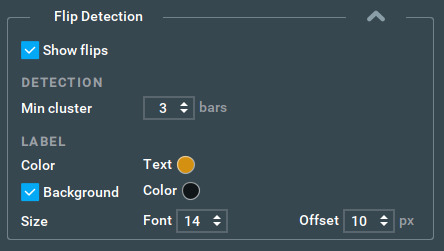
Flip Detection
| Control | Default | What it does |
|---|---|---|
| Show flips | off | Mark the strike where the bars switch from positive to negative (or back) after a cluster. |
| Min cluster | 3 bars | Consecutive bars on one side before a sign change counts as a flip. Range 2–20. |
| Text / Background colour | orange / black | The F pill's colours. |
| Background | on | Draw the flip label on a pill. |
| Font | 14 | Font size of the flip label. Range 8–32. |
| Offset | 0 px | Pixels from the bar's edge: positive = outside the cluster, negative = inside. Range −100 to 100. |
Alerts and flip detection
Play on update plays a short tone each time new data lands, so you can leave the panel closed. It also plays when you press Update Now and nothing is newer, and when a fetch fails, so a tone with no visible change is worth a glance at the Status line.
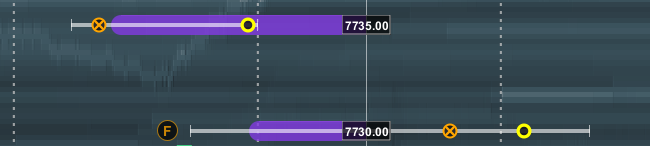
Flip detection marks the strike where the profile changes sign after a run of same-sign strikes. With Min
cluster at 3, at least three consecutive green (or purple) strikes must precede the first strike of the other
sign for it to count. The flip strike gets a bold F in a pill, placed on the outer edge of the bar. The hover
card for that strike shows Gamma flip · long to short or Gamma flip · short to long.
Good to know
- Six minutes are missing every day, 09:25 to 09:30 ET, by design. The session, the day range and the Open marker start at 04:00, not at the cash open.
- MMs hedge delta. This is an assumption. Market makers can also hedge with other instruments, only in part, or later.
- Other flows move hedges too. Vanna (from implied volatility changes) and charm (from time) also change MM delta.
- Other participants are not in this view. Customers, firms and broker-dealers also hold options.
- The data is per minute, not tick by tick.
- The profile shows each strike alone. It does not show the total market exposure.
This guide is educational. The past behavior of a level does not guarantee its future behavior.
Data and methodology by OptionsDepth. Add-on by Bookmap.