


See stock price more clearly in real time.
Compare plans to access deeper market visibility for stock price.
Education
October 12, 2024
Updated
Wyckoff Trading Strategy: Understanding the Wyckoff Market Cycle

Financial markets move in patterns. These patterns don’t just appear randomly; they emerge after some specific and predictable events. Richard D. Wyckoff, in the early 20th century, identified these patterns and developed a powerful trading strategy known as the Wyckoff Method. This method helps traders understand and predict stock market movements by focusing on market cycles and price patterns. It breaks down stock price behavior into four distinct phases: accumulation, markup, distribution, and markdown.
In this article, we will explore each phase in detail. We’ll start with the accumulation phase, where smart investors buy shares at lower prices. Next is the markup phase, where prices begin to rise as demand overtakes supply. Then, we’ll cover the distribution, where the stock price moves sideways as smart money sells at higher levels. Finally, we’ll examine the markdown phase, where prices decline due to increased selling pressure.
Moreover, you’ll also discover how to apply the Wyckoff Method using real-world examples and strategies for entering and exiting trades. Lastly, we’ll show you how integrating tools like Bookmap can enhance your analysis by providing real-time insights into market liquidity and order flow. This combination will help you make more informed trading decisions and improve your overall trading strategy. Let’s get started.
Table of Contents
- What is the Wyckoff Method?
- Market Cycles in Trading: Where the Wyckoff Cycle Fits
- Does Smart Money Manipulate Stock Prices?
- Wyckoff Accumulation Phase
- Markup Period
- Distribution Phase
- Richard Wyckoff’s Market Distribution Model
- Wyckoff Distribution Schematic
- How the Wyckoff Method Defines the Distribution Phase
- The Institutional Selling Phase in Trading
- Wyckoff Distribution and Common Chart Patterns
- How to Identify Wyckoff Distribution
- Sign of Weakness (SOW) in Wyckoff Analysis
- Wyckoff Distribution Phase C: Upthrust After Distribution (UTAD)
- Accumulation vs. Distribution in Wyckoff
- Markdown Period
- Trading Signals During a Markdown Phase
- Integrating Wyckoff for Improved Trading
- Conclusion
- FAQ
What is the Wyckoff Method?
The Wyckoff Method is a technique used in technical analysis. It is used to study and predict stock market movements. This method focuses on understanding market cycles and price patterns to make better trading decisions. Developed by Richard D. Wyckoff in the early 20th century, this method helps traders identify the best times to buy and sell stocks by analyzing the behavior of big market players.
The Wyckoff Method is usually divided into four different phases:
| Phases | Action of market participants | Impact on stock prices |
| Accumulation |
|
|
| Markup |
|
|
| Distribution |
|
|
| Markdown |
|
|
For more clarity, let’s study an example of a stock moving through these phases:
Let’s take a hypothetical stock, XYZ Corp., to illustrate these phases:
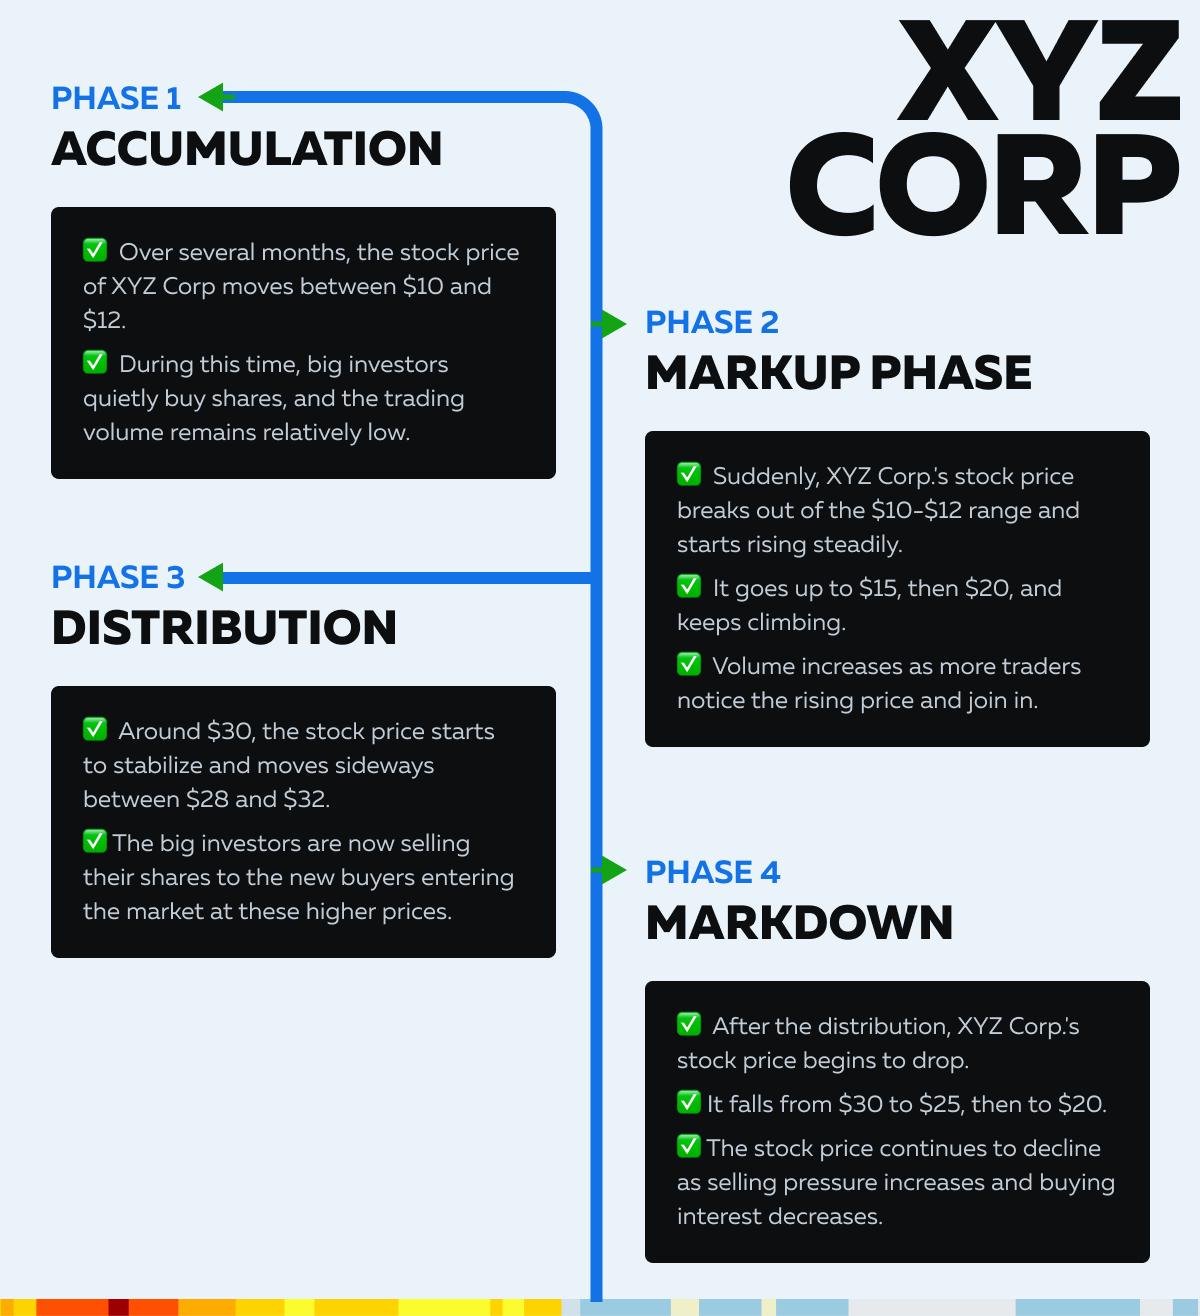
Now, let’s study these four phases in detail and learn how to identify them. Also, we will check how to make appropriate strategies for each phase.
Market Cycles in Trading: Where the Wyckoff Cycle Fits
The Wyckoff cycle describes a pattern that repeats in every market: a quiet period of buying, a rise, a period of selling, and a decline. Other frameworks describe the same rhythm at different scales. Economic cycles play out over years, sentiment cycles over weeks or months, and the four Wyckoff phases can be applied to any chart, from a 5-minute futures chart to a weekly stock chart.
Two points keep this practical. First, cycles are fractal. A markdown on a daily chart can sit inside an accumulation range on a weekly chart, so always state the timeframe you are analyzing. Second, the phases have no fixed length. A distribution range can last a few hours or many months, and Wyckoff analysis will not tell you in advance. It tells you what the evidence currently supports.
For a wider look at how cycles, patterns and sentiment fit together, see Bookmap’s guides to market cycles and timely trading decisions and 5 tips on market cycles, patterns and sentiment analysis. Dow Theory describes a similar progression with different labels (accumulation, public participation and distribution).
Does Smart Money Manipulate Stock Prices?
In Wyckoff’s writing, “smart money” is shorthand for the largest participants in a market. Wyckoff called their combined activity the “composite operator,” a thinking tool that treats the biggest players as if they were one actor building a position and later selling it. It is a model for reading price and volume, not a claim that one group controls the market.
Large traders do move price, simply because of their size. To build or exit a big position without pushing price against themselves, they split orders, trade over time and often use passive orders. That is trading with market impact in mind, and it is legal and routine.
Manipulation is something else. Spoofing (placing orders with no intention to fill them), wash trading and coordinated pump-and-dump schemes are illegal in regulated markets and are actively prosecuted. A Wyckoff pattern can look similar on a chart to the aftermath of manipulation, which is why it should be treated as an interpretation and not as proof.
Two practical points follow. A chart pattern alone cannot show who is trading or why. Order flow can add evidence, because resting orders that vanish as price approaches look different from passive orders that absorb aggressive buying and actually trade. For the difference, see Bookmap’s guides to spoofing, market manipulation and the spoofing cases behind it and why the market isn’t out to get you.
Wyckoff Accumulation Phase
The accumulation phase is a period in the market cycle where smart money (large, informed investors) quietly buys shares at lower prices before a major uptrend. During this phase, the stock price moves within a relatively narrow range. Such a movement is an indication that the big players are building their positions without causing significant price increases.
How to Identify Accumulation Phases?
Traders can identify accumulation phases by analyzing the following:
| Volume | Price Patterns | Market Sentiment |
|
|
|
Chart Example (Showing High Volume and Strong Support Levels)
For more clarity, let’s have a look at the below chart showing how a stock might look during the accumulation phase:

Please note that:
- $10.0 is the initial support level, with high buying interest.
- $12.0 represents the second support level where accumulation is evident.
- $13.0 further indicates a strong support level where the price consistently finds buying interest.
What are the Strategies for Entering Trades During Accumulation?
- Look for confirmation that support levels are holding strong.
- When the price bounces off support levels with high volume, it signals that accumulation is taking place.
- Place stop-loss orders just below the key support levels to manage risk.
- This protects your investment if the price breaks below the support, indicating a potential failure of the accumulation phase.
- Instead of buying all at once, consider accumulating shares gradually as the price moves within the range. This approach mirrors the smart money strategy and reduces the risk of price manipulation.
How to Set Buy Orders at Key Support Levels?
Let’s understand in some simple steps:
Step I: Identify Key Support Levels
- Use historical price data to identify where the stock has consistently found support.
- Say $10 and $12 are key support levels.
Step II: Set Buy Orders
- Place buy orders slightly above these support levels.
- For example, you might set a buy order at $10.50 if $10 is the identified support level.
- This ensures you enter the trade as the price approaches the support, but don’t miss out if the price doesn’t reach exactly $10.
Step III: Monitor Volume
- Ensure that buy orders are supported by high volume on up days.
- High volume confirms that smart money is buying and indicates a stronger accumulation phase.
Markup Period
The markup period is the phase in the market cycle that follows the accumulation phase. During this time, the stock price starts to rise steadily. This increase in stock price happens as demand begins to outpace supply and the broader market starts to buy in.

How to Spot the Beginning of a Markup Period?
Traders can identify the start of a markup period by looking for:
| Price Breakouts | Increasing Volume |
|
|
Chart Example (Showing Increased Buying Pressure and Upward Movement)
For more clarity, let’s have a look at the below chart showing how a stock might look during the markup phase:

Please note that the resistance level is at $20. Once it is crossed, the price breaks above it with increased volume.
How to Capitalize on the Markup Period?
- Once the markup phase begins, consider buying shares and holding them to ride the trend upward.
- Use technical indicators like moving averages (e.g., 50-day or 200-day) to confirm the trend direction.
- Set trailing stops to protect profits while allowing the stock price to continue rising.
- Keep an eye on volume trends. Increasing volume confirms the strength of the markup.
- Look for days with high volume, as they indicate strong buying interest.
How to Monitor Liquidity Zones and Adjust Positions?
For the unaware, liquidity zones are areas where there is a significant amount of buy and sell orders. These zones often act as support or resistance levels during the markup phase. Use historical price data to identify these zones. Now, as the markup progresses, adjust your positions based on the stock’s performance and market conditions.
For example:
- Add to Positions: If the stock breaks new highs with strong volume, consider adding to your position.
- Take Profits: When the stock reaches key resistance levels or shows signs of weakening (e.g., decreasing volume, lower highs), consider taking partial profits or setting stop-loss orders to protect gains.
- Stay Informed:
- Continuously monitor:
- News
- Earnings reports, and
- Market sentiment
- These factors significantly impact the markup phase
- Also, stay updated with technical analysis tools and indicators to make informed decisions.
- Continuously monitor:
Distribution Phase
The distribution phase is the period in the market cycle where smart money (large, informed investors) begins to sell off their shares at higher prices after the markup phase. During this phase, the stock price moves within a relatively narrow range. This situation indicates that big investors are distributing their holdings to the broader market. Often, this phase leads to increased volatility and signals the start of a downtrend.
How to Identify Distribution?
Traders can identify the distribution phase by looking for:
| Selling Pressure | Resistance Levels |
|
|
Chart Example (Showing High Volume at Resistance Levels)
For more clarity, let’s have a look at the below chart showing how a stock might look during the distribution phase:
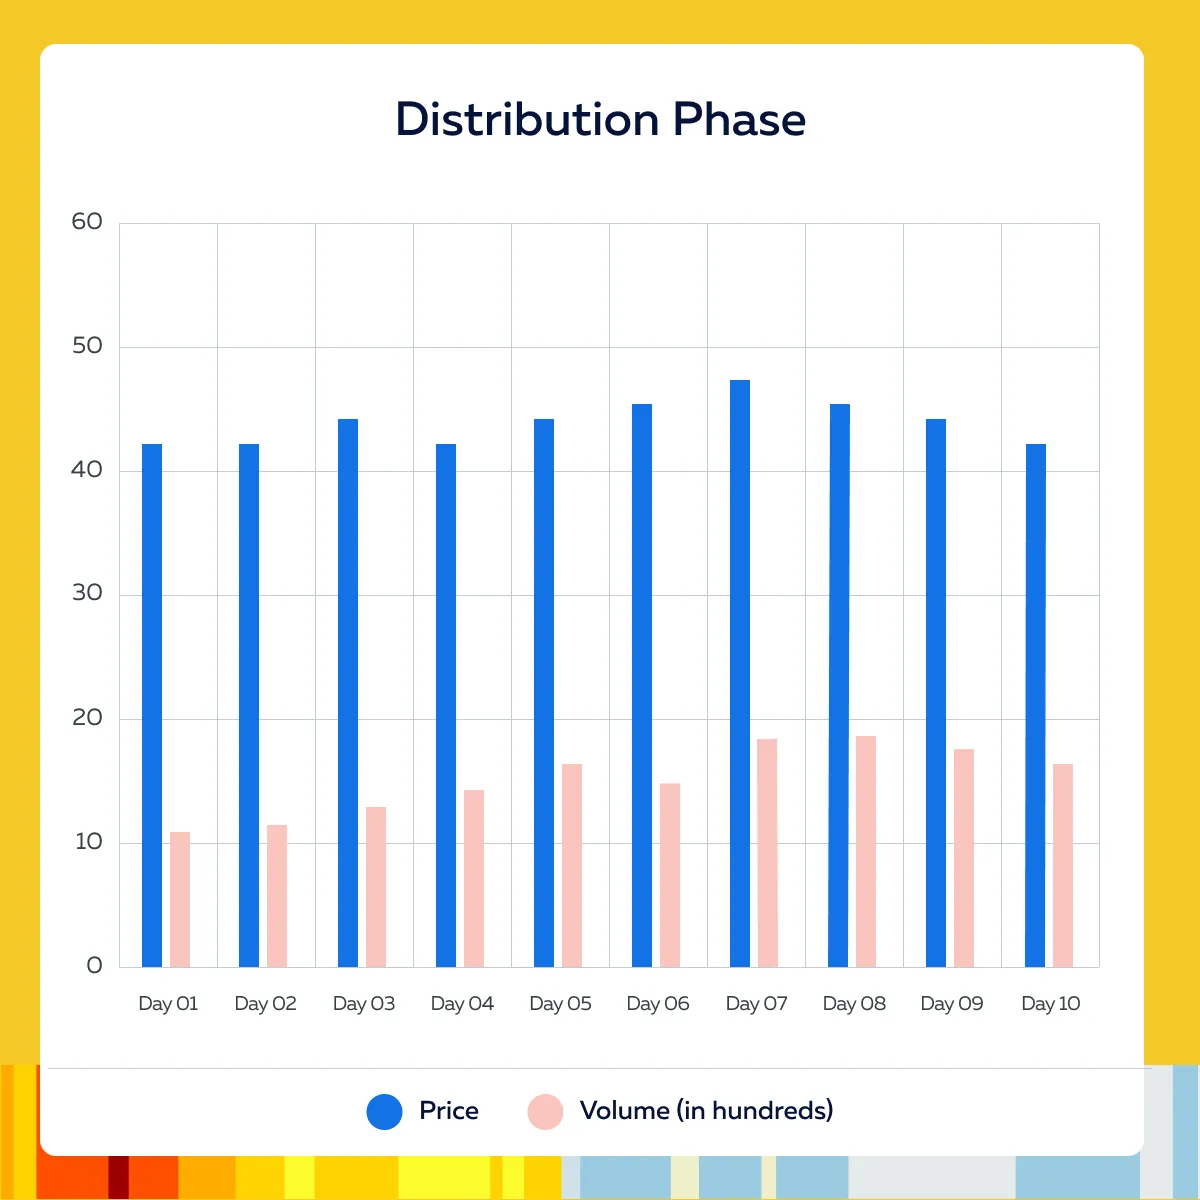
Please note that the resistance levels are visible at $44, $46, and $48.
How to Exit Positions or Do Short Selling?
As signs of distribution become apparent, consider gradually exiting your positions. Sell shares incrementally to:
- Avoid causing significant price drops
and
- To take advantage of remaining buying interest.
Furthermore, look for opportunities to short-sell the stock. Short selling involves borrowing shares to sell at current prices and buying them back at lower prices once the stock declines. Also, monitor the volume closely. Increasing volume on down days compared to up days indicates stronger selling pressure. This is usually one of the best cues to exit long positions or enter short positions.
How to Set Sell Orders at Resistance Levels and Identify Short-Selling Opportunities?
Follow these simple steps:
Step I: Identify Resistance Levels
- Use historical price data and recent trading activity to identify key resistance levels where the stock has struggled to move higher.
- In the above chart, $46-$48 is a key resistance zone.
Step II: Set Sell Orders
- Now, place sell orders slightly below resistance levels to ensure you can exit before the price potentially falls.
- For example, if $48 is a resistance level, consider setting a sell order at $47.50.
Step III: Identify Short-Selling Opportunities
| Breakdown Below Support | Bearish Patterns |
|
|
Step IV: Risk Management
- Use stop-loss orders to limit potential losses on short positions.
- Set stop-loss orders just above key resistance levels to protect against unexpected price increases.
Richard Wyckoff’s Market Distribution Model
Richard D. Wyckoff, a stock market trader and publisher active in the early 20th century, built his method by studying how large operators accumulate and distribute stock. The distribution model is the part of that work that explains how an advance ends.
The model rests on three principles that Wyckoff students still use:
- Supply and demand. Price rises when demand exceeds supply and falls when supply exceeds demand. Volume and price behavior show which side is in control.
- Cause and effect. The time spent building a trading range (the cause) sets the scale of the move that follows (the effect). As a rule of thumb, a long, wide distribution range points to a larger markdown than a short, tight one.
- Effort versus result. Volume is the effort and price movement is the result. Heavy volume with little price progress suggests the other side is absorbing the effort. Bookmap’s guide to reading market trends through order flow analysis covers how to see this directly.
In the distribution model, the composite operator sells into strength over a trading range at the top of an advance. The range is divided into five phases, A through E, and each phase is identified by named events. Those events are covered in the schematic below.
Wyckoff Distribution Schematic
The distribution schematic is an idealized map of how a trading range forms at the top of an uptrend. Real charts rarely match it exactly, so use it as a checklist of evidence, not a template to force onto every chart.
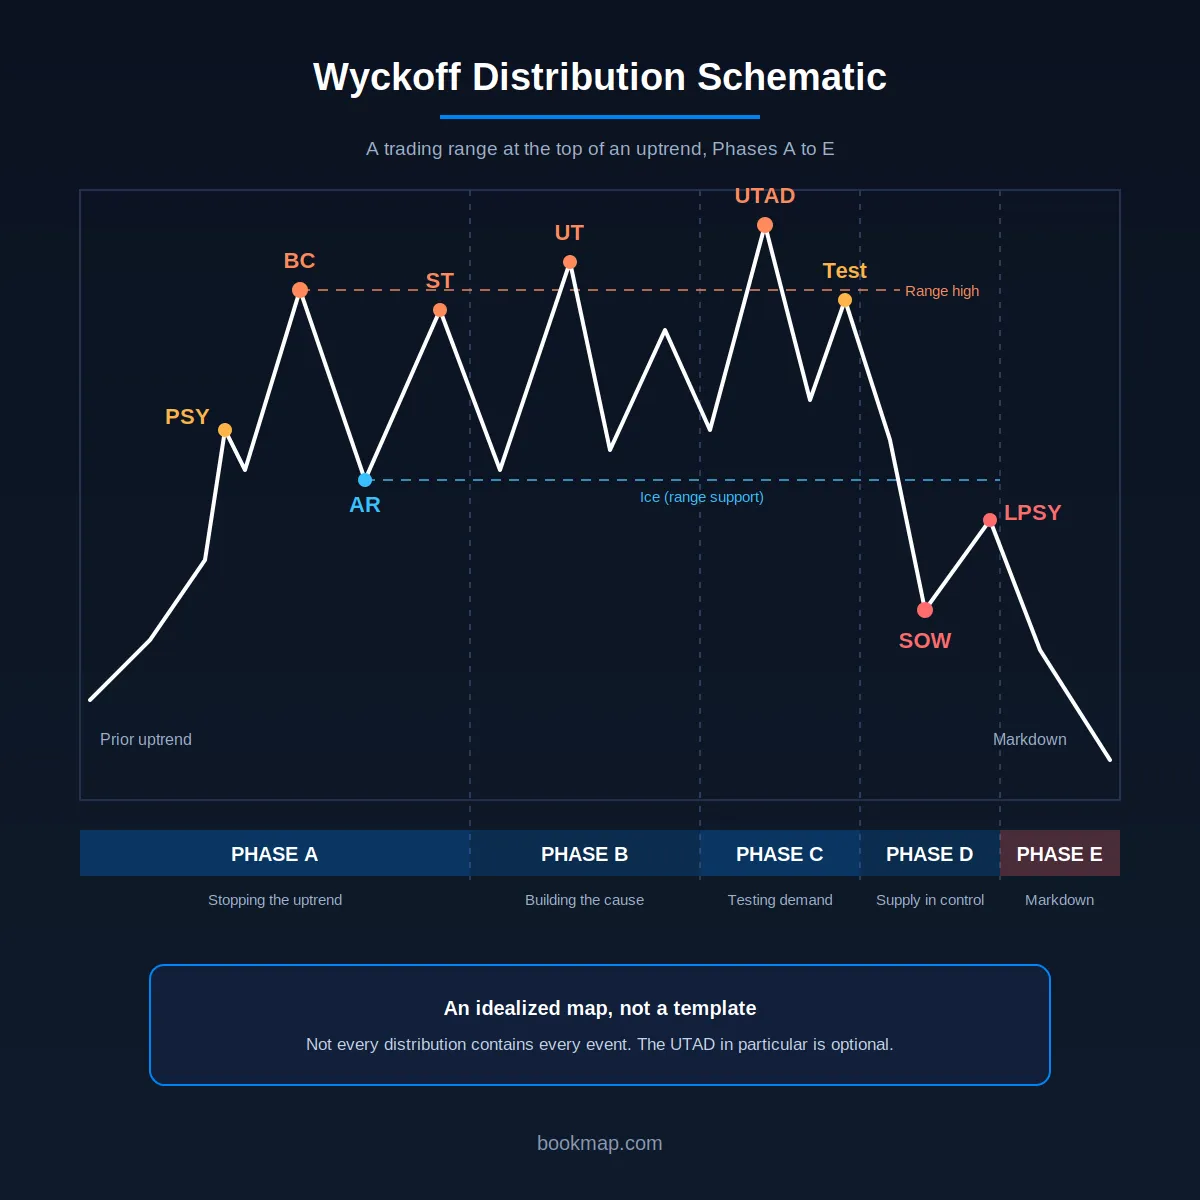
Each event has a standard abbreviation:
| Event | Name | What to look for |
| PSY | Preliminary supply | First sign of heavy selling into the advance. Volume rises and the spread widens, but the uptrend often continues. |
| BC | Buying climax | A sharp push to a high on very heavy volume, as public buying meets large selling. Often marks the top of the range. |
| AR | Automatic reaction | A fast drop after the BC as demand dries up. The AR low sets the lower edge of the range. |
| ST | Secondary test | A rally back toward the BC area, usually on lighter volume. Demand is weaker than at the high. |
| UT | Upthrust | A brief move above resistance that closes back inside the range. |
| UTAD | Upthrust after distribution | A UT late in the range (Phase C) that tests remaining demand. Not every distribution has one. |
| SOW | Sign of weakness | A decline through the middle or lower part of the range on wider spread and heavier volume. |
| LPSY | Last point of supply | A weak rally after the SOW, on lighter volume, that stalls below the broken levels. |
Wyckoff called the lower edge of a distribution range the “ice.” A break through it is the main evidence that supply has taken control.
How the Wyckoff Method Defines the Distribution Phase
In the market cycle covered earlier in this article, distribution is the stage between markup and markdown. Inside that stage, Wyckoff divided the range into five phases, labeled A to E. Do not confuse the two: phases A to E are stages inside a single distribution range, not the four phases of the market cycle.
- Phase A, stopping the uptrend. PSY, BC, AR and ST appear. Demand has been dominant, and the first evidence of supply shows up.
- Phase B, building the cause. Price moves between the BC high and the AR low. Large holders keep selling into rallies, and upthrusts and secondary tests are common.
- Phase C, testing demand. A UT or UTAD probes above resistance to see whether buyers remain.
- Phase D, supply takes control. A SOW breaks toward or through range support, and LPSY rallies fail below the broken levels. Lower highs form.
- Phase E, markdown. Price leaves the range and the downtrend runs.
The phases are a progression of evidence, not a mandatory sequence of identical shapes. A range can skip an event or repeat one several times.
The Institutional Selling Phase in Trading
Distribution is what institutional selling looks like when it is spread over time. A fund that wants to exit a large position cannot sell it all at once without pushing price down, so it sells into rallies and into demand created by other traders. A few things tend to show up as a result:
- Little price progress on heavy volume. Large passive offers absorb aggressive buying, so price stalls near the highs.
- Repeated rejection at the same levels. The same resistance holds through several tests.
- Delta divergence. Price makes a higher high while cumulative volume delta flattens or falls, which means aggressive buying is weakening.
- Hidden size. Trades larger than the displayed size at a level can point to iceberg orders refilling.
Institutions also use execution algorithms, so their selling is often spread across time and does not show up as one obvious event. That is part of why distribution can take weeks or months to resolve on a daily chart. Bookmap’s guide to trading like an institutional trader covers those execution methods, and the step-by-step guide to trading with Bookmap shows how to track absorption on the heatmap.
None of these signals proves who is selling. They show that supply is absorbing demand, which is what the Wyckoff model is built to detect.
Wyckoff Distribution and Common Chart Patterns
Many classic chart patterns are distribution ranges seen from a different angle. The Wyckoff model adds the volume and supply-demand logic behind them.
- Rectangle at a high: the distribution range between the BC and the AR.
- Double or triple top: the BC plus one or more secondary tests or upthrusts at the highs.
- Head and shoulders: the BC or an upthrust as the head, with a weak LPSY rally as the right shoulder.
- Descending triangle: repeated lower highs against flat support (the ice) as supply gains control.
The Wyckoff reading adds attention to volume and to effort versus result. A head and shoulders top with a right shoulder on dull volume is a different setup from one where volume expands on the way up. Reversal candles, such as the evening star, often appear at the BC or UTAD highs, and Bookmap’s guide to the most common candlestick patterns covers them. For how pattern names compare with what the order book shows, see technical analysis vs. order flow.
How to Identify Wyckoff Distribution
No single event confirms distribution, so the aim is to collect enough evidence to treat a range as distribution while there is still time to act. A workable sequence:
- Start with the prior trend. Distribution needs an advance to end. A range inside a downtrend is not distribution.
- Mark the climax. Look for a high on unusually heavy volume and a wide spread (the BC), followed by a sharp drop (the AR). The BC high and AR low frame the range.
- Watch the tests. A secondary test that reaches the high area on lighter volume suggests demand is fading.
- Compare rallies and declines. Inside the range, check whether down moves carry more volume than the rallies between them. That is effort versus result at work.
- Look for failed pushes above resistance. Upthrusts that close back inside the range show breakout buyers are not getting follow-through.
- Wait for the break. A sign of weakness through range support, followed by a weak rally (LPSY), is the strongest evidence in the model.
- Check the higher timeframe. Confirm the range on a higher timeframe before acting on a lower one.
A range with a climax, a weak secondary test and a sign of weakness is stronger evidence than a range with only one of them.
Order flow adds a second layer of evidence at each step. At resistance, repeated aggressive buying that fails to move price is absorption by passive sellers. On the way down, heavy aggressive selling with bids pulled away is a different picture from selling that gets absorbed. Bookmap’s guides to volume clusters and cumulative volume delta cover how to read both. Replaying past sessions in Bookmap is a good way to study these events.
Sign of Weakness (SOW) in Wyckoff Analysis
A sign of weakness is a decline that shows supply taking control. In a distribution range it usually appears as a drop through the middle or lower part of the range, on a wider spread and heavier volume than the declines before it. Buyers fail to defend range support (the ice), and the rally that follows is weak. It is the counterpart of the sign of strength (SOS) in accumulation.
A SOW matters because it changes the balance of evidence. Up to that point, a range can still resolve higher. After a SOW with a failed rally, the distribution reading is much stronger.
Treat a SOW as a hypothesis to test against what happens next. If price rallies back into the range on strong volume and holds, the SOW may have been a shakeout and not a real break. If the rally stalls on low volume below the broken level (an LPSY), the reading is confirmed. In order flow terms, a genuine SOW tends to show aggressive selling meeting thinning bids, while a failed one shows the selling being absorbed. Bookmap’s guide to order flow and historical context beyond Level II explains how to tell absorption from a real break.
Wyckoff Distribution Phase C: Upthrust After Distribution (UTAD)
Phase C is the test. After the range has formed, price makes one last push above resistance. If it closes back inside the range, that push is an upthrust. When it happens late in the range, after the secondary tests, it is called an upthrust after distribution (UTAD).
The logic behind it: a move above resistance attracts breakout buyers and triggers the buy stops of traders who are short. Large sellers can sell into that demand at high prices. When the demand is used up, price falls back into the range and the buyers are trapped. Stop orders do not appear in the order book, so this is inferred from structure and from how price behaves, not observed directly.
How to read a UTAD
- Price moves above the top of the range, often above the BC high, and then closes back inside.
- Volume on the break is often heavy, since supply is meeting breakout demand, but lighter-volume versions occur too. What matters is the failure to hold above resistance.
- A test of the UTAD high on lighter volume, followed by a drop through the middle of the range, makes it more likely that distribution is real.
How it is commonly traded
- Short after price re-enters the range and a test fails, with a stop above the UTAD high.
- Or wait for the SOW and LPSY, which gives up the best price but filters out more false signals.
What to watch out for
- A UTAD is not mandatory. Some distribution ranges have no final break above resistance, and in weak ranges the supply evidence may be a lower high inside the range.
- A break above resistance that holds is a breakout, not a UTAD. Bookmap’s breakout vs. fakeout checklist covers the confirmation signs, such as liquidity stacking behind the move and continued aggressive order flow.
- Repeated upthrusts can stop out early shorts, which is why many Wyckoff traders wait for Phase D.
- The same false-break idea shows up as a liquidity sweep in market structure analysis.
The mirror image in accumulation is the spring, a brief break below support that fails. See the comparison below.
Accumulation vs. Distribution in Wyckoff: What Is the Difference?
The two ranges are mirror images. The difference is the direction of the preceding trend and which side is absorbing the other.
| Accumulation | Distribution | |
| Where it forms | After a downtrend | After an uptrend |
| Who is active | Large buyers absorbing supply | Large sellers absorbing demand |
| First warning | Preliminary support (PS) | Preliminary supply (PSY) |
| Climax event | Selling climax (SC) | Buying climax (BC) |
| First reaction | Automatic rally (AR) | Automatic reaction (AR) |
| Test of the extreme | Secondary test (ST) of the lows | Secondary test (ST) of the highs |
| False move in Phase C | Spring (brief break below support) | UT or UTAD (brief break above resistance) |
| Evidence the balance has shifted | Sign of strength (SOS) | Sign of weakness (SOW) |
| Last pullback or rally | Last point of support (LPS) | Last point of supply (LPSY) |
| What follows | Markup | Markdown |
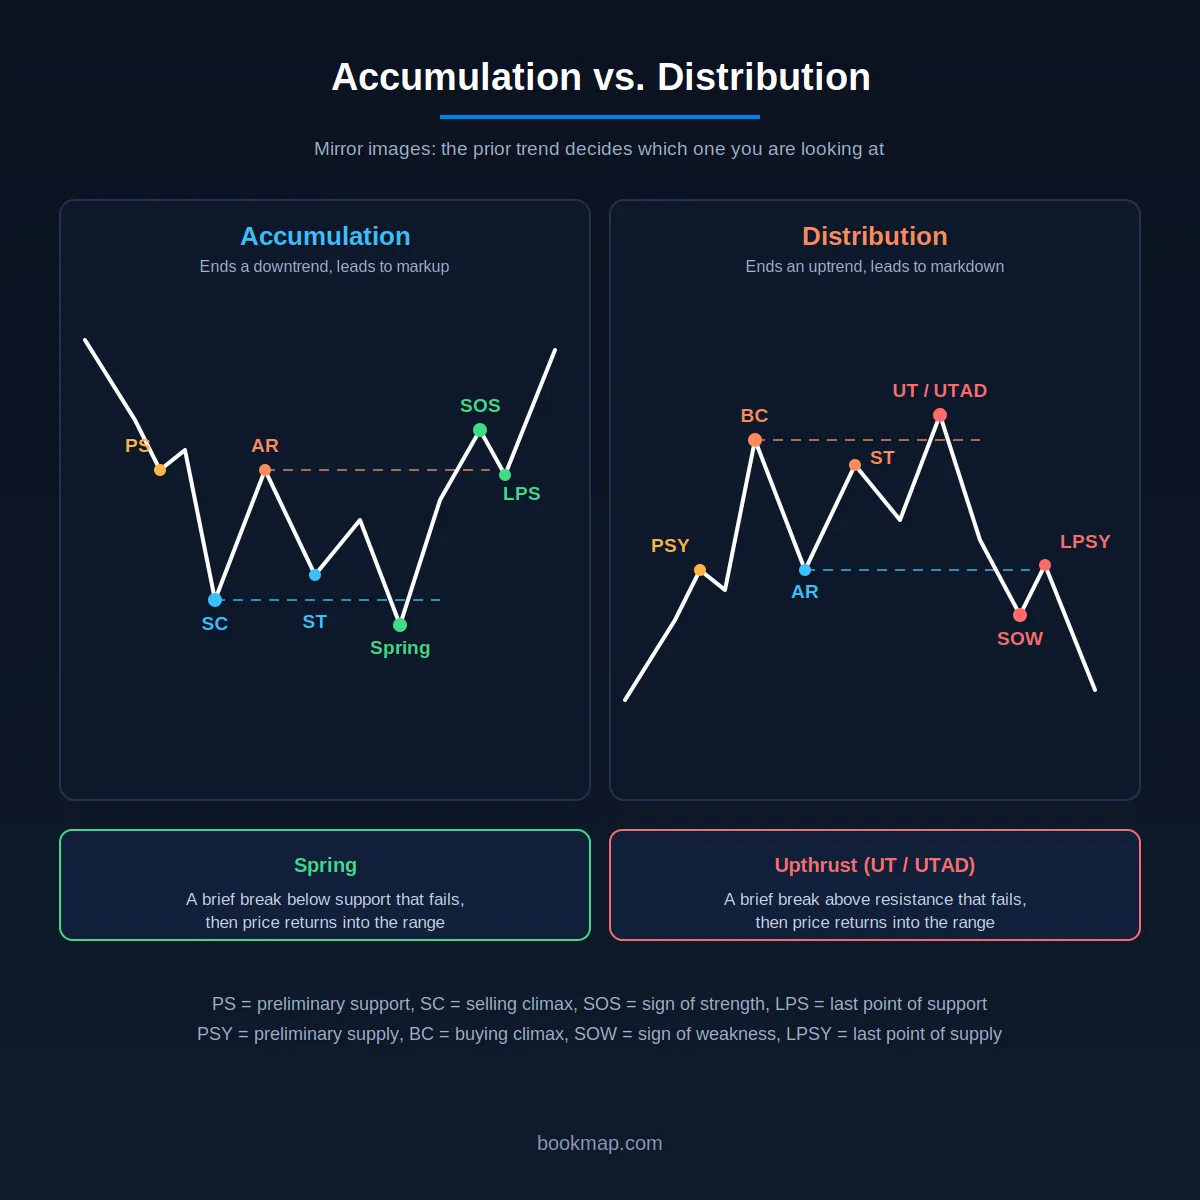
The volume footprints mirror each other too. Accumulation shows more volume on rallies than on declines, and distribution shows the reverse. A range on its own does not tell you which one you are looking at. The prior trend and the events inside the range do.
Markdown Period
The markdown period is the phase in the market cycle that follows the distribution phase. During this period, the stock price moves downward as selling pressure outweighs buying interest. This phase is characterized by declining prices, lower highs, and lower lows and can lead to significant losses if not managed properly.
How to Identify the Start of a Markdown Period?
Traders can identify the start of a markdown period by looking for:
| Volume Behavior | Price Breakdowns |
|
|
Chart Example (Showing Increased Selling Pressure and Downward Movement)
For more clarity, let’s have a look at the below chart showing how a stock might look during the markdown phase:
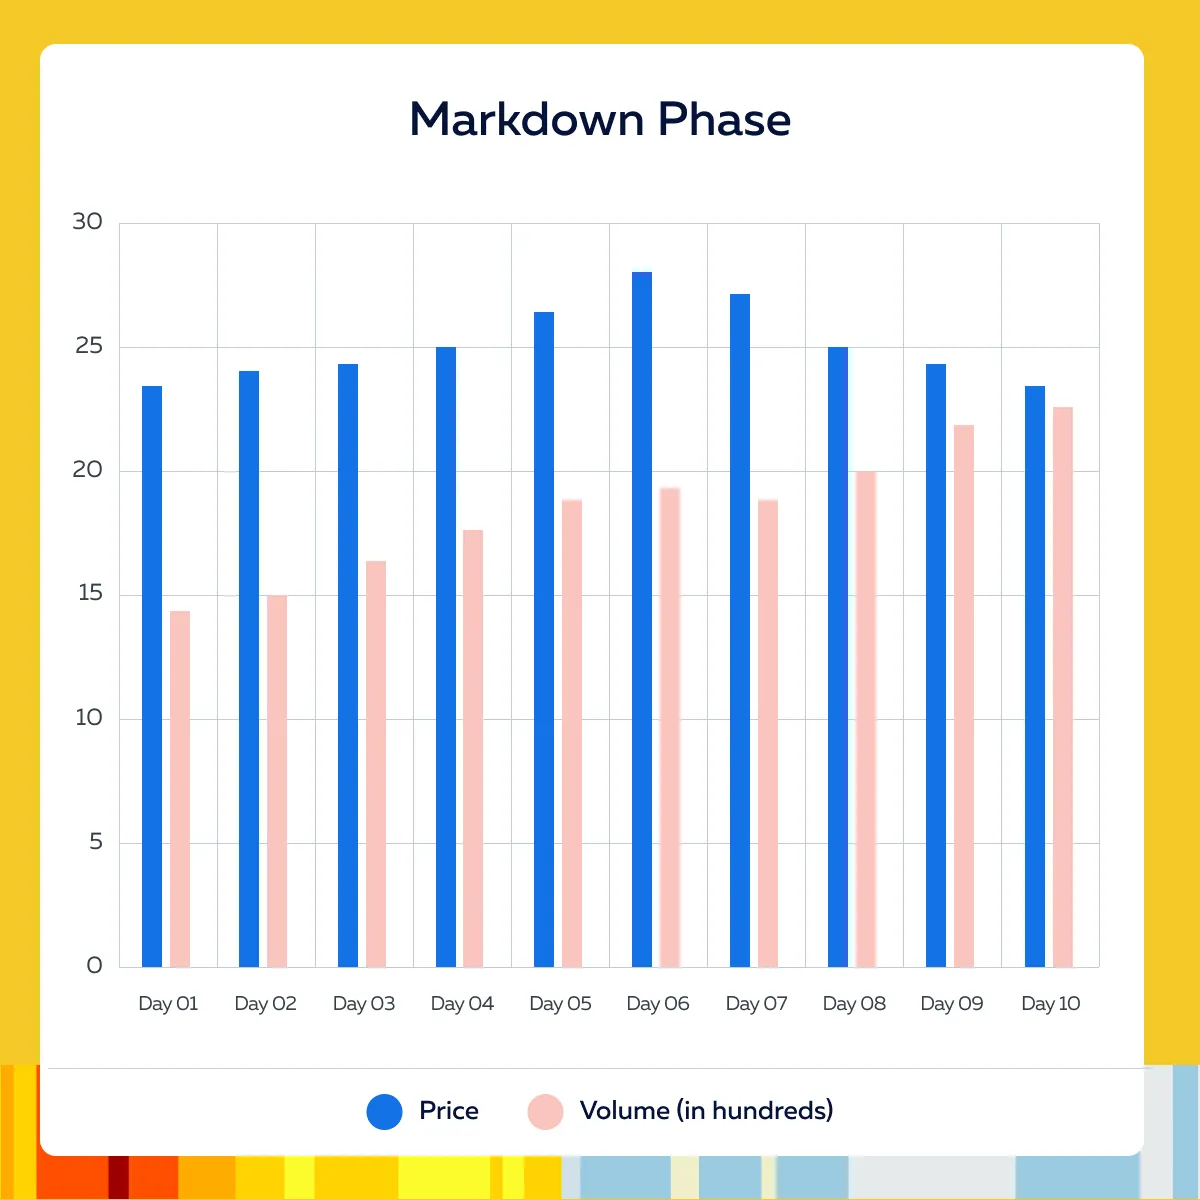
Please note that the stock price breaks below the $26 support level with increased selling pressure. This is an indication of the start of the markdown phase.
How to Capitalize on the Markdown Period?
- Short Selling:
- Short selling involves borrowing shares to sell at current prices, to buy them back at lower prices.
- This strategy allows traders to profit from declining prices.
- Setting Stop-Loss Orders:
- Use stop-loss orders to limit potential losses on short positions.
- Set stop-loss orders above key resistance levels to protect against unexpected price increases.
- Volume Analysis:
- Monitor volume trends closely.
- A decrease in volume on up days and an increase on down days confirms strong selling pressure.
Trading Signals During a Markdown Phase
Markdown is the phase where supply is in control and price has left the distribution range. These signals suggest it is underway or continuing:
- Lower highs and lower lows. Each rally ends below the previous one.
- Volume expands on declines and dries up on rallies. This is the opposite of what a healthy advance shows.
- Failed rallies. Weak bounces that stall below broken support, or below the LPSY level, show buyers are not stepping in.
- A break through range support followed by a failed retest. The SOW from Phase D, then a rally that stalls from below, is a common entry area for short sellers.
- A new lower low. In market structure terms this is a break of structure, and it confirms the downtrend is continuing. Bookmap’s market structure guide explains how a break of structure is read.
These signals suggest a markdown may be ending:
- A selling climax. A sharp drop on very heavy volume and a wide spread, followed by a quick rebound. This is the SC that starts an accumulation range.
- Heavy selling with little downside progress. Passive buyers may be absorbing the supply.
For risk, place stops above the most recent lower high, or above the LPSY. Late entries near a selling climax carry the highest risk of a sharp reversal. For entries after a pullback inside a downtrend, see Bookmap’s guide to continuation setups.
How to Monitor Price Movements and Adjust Short Positions?
Use historical price data and recent trading activity to identify key support levels where the stock may temporarily stabilize and resistance levels where it may encounter selling pressure. Now, you can adjust positions by:
- Adding to Short Positions: If the stock breaks below new support levels with strong selling pressure, consider adding to your short position.
- Covering Short Positions: If the stock shows signs of stabilizing or reversing (e.g., decreasing selling volume, forming a base), consider covering (buying back) your short positions to lock in profits.
Moreover, prefer using technical indicators to gauge the strength and duration of the markdown phase. Some common examples include:
- Relative Strength Index (RSI)
- Moving Average Convergence Divergence (MACD)
- Trendlines
Integrating Wyckoff for Improved Trading
Be aware that integrating the Wyckoff method with other analytical tools can significantly:
- Enhance market analysis
and
- Improve trading decisions
One such tool is Bookmap. Being a modern analytical tool, it provides advanced visualization of market data through heatmaps and order flow analysis. By combining Wyckoff’s market cycle analysis with Bookmap’s real-time data, you can gain a more comprehensive understanding of market phases and trader behavior. Also, such combined usage can improve the accuracy of your trading strategies.
How Bookmap Enhances Wyckoff Analysis?
| Heatmap Visualization | Order Flow Data |
|
|
For more clarity, let’s study a hypothetical example confirming Wyckoff patterns with Bookmap.
- Say a trader identifies a potential accumulation phase based on Wyckoff’s principles.
- They note the stock’s price range and low volume during the consolidation period.
- Now, the trader uses Bookmap’s heatmap to look for:
- High buying interest
and
- Minimal selling pressure around the key support levels identified by Wyckoff.
- The trader monitors the order flow data and spots large buy orders (icebergs) at support levels.
- This situation confirms the presence of strong buying interest.
Real-Time Validation of an Accumulation Phase Using Bookmap
To better understand the usage of Bookmap as an advanced analytics tool, let’s study another example. Say, using Wyckoff’s method, the trader identifies that XYZ Corp. is in the accumulation phase, with the price moving sideways between $40 and $42.
Now, the trader switches to Bookmap to confirm this phase in real time. They performed the following steps:
- Setup on Bookmap:
- Heatmap Display: The trader sets up Bookmap’s heatmap to monitor the order book for around $40.
- Order Flow Monitoring: The trader watches for large buy orders appearing at $40, with minimal sell orders (this validates the accumulation phase).
- Real-Time Observation:
- High Buying Interest: The heatmap shows a cluster of large buy orders at $40, with very few sell orders (this indicates strong buying interest).
- Order Flow Confirmation: Order flow data reveals large icebergs at $40, with minimal activity from sellers (this confirms the Wyckoff accumulation phase).
- Entry Decision:
- Confirming Wyckoff Patterns: The trader decides to enter a long position at $40 by placing buy orders just above the support level.
- Setting Stop-Loss: A stop-loss is placed below the next support level to ensure protection against potential breakdowns.
Conclusion
The Wyckoff trading strategy is a popular technique for understanding market movements through four distinct phases: accumulation, markup, distribution, and markdown. During the accumulation phase, smart money buys shares at lower prices and sets the stage for a markup period where prices rise. Next comes the distribution phase, in which shares are sold off at higher prices. This sell-off leads to a markdown phase where prices decline.
By combining the Wyckoff method with tools like Bookmap, traders can significantly enhance their trading strategies. Bookmap provides real-time insights into market liquidity and order flow through heatmap visualizations and the most recent order flow data. These Bookmap’s features help to confirm Wyckoff patterns and gain a clearer picture of market trends.
Sign up for FREE to Bookmap today and significantly improve the accuracy of your trading strategies.
FAQ
What is the Wyckoff distribution schematic?
It is an idealized map of how a trading range forms at the top of an uptrend. It has five phases (A to E) and a set of named events: PSY, BC, AR, ST, UT or UTAD, SOW and LPSY. Phase A stops the advance, Phase B builds the range, Phase C tests demand, Phase D shows supply taking control, and Phase E is the markdown.
What are the five phases of Wyckoff distribution?
Phase A stops the uptrend (PSY, BC, AR, ST). Phase B builds the trading range. Phase C tests demand with an upthrust or UTAD. Phase D shows supply taking control (SOW, LPSY). Phase E is the markdown. These phases sit inside a single distribution range and are separate from the four phases of the Wyckoff market cycle.
What is an upthrust after distribution (UTAD)?
A UTAD is a false break above the top of the trading range in Phase C that quickly closes back inside it. It traps breakout buyers and tests whether any demand is left. It is optional, since some distribution ranges end without one.
What is the difference between a spring and an upthrust?
A spring is a brief break below support in accumulation that fails and returns into the range. An upthrust is the mirror image: a brief break above resistance in distribution that fails and returns into the range. Both test whether the other side still has any strength. A spring belongs to Phase C of accumulation, and an upthrust (UT or UTAD) appears in Phase B or C of distribution.
What is a sign of weakness (SOW) in Wyckoff analysis?
A SOW is a decline through the middle or lower part of a distribution range on wider spread and heavier volume. It shows supply is taking control. It is strongest as evidence when the rally that follows is weak and stalls below the broken level.
How do I analyze a specific stock chart with the Wyckoff method?
Pick a timeframe and name the prior trend. Mark the highest-volume climax and the sharp reaction after it, which frame the range. Note volume at each test and on each rally and decline inside the range. Look for upthrusts and failed tests. Wait for a break of range support and a weak rally. Decide in advance what would prove you wrong, for example price holding above the range high on strong volume.
Does the Wyckoff method work in crypto as well as in stocks?
The logic applies to any market with a visible auction, and Wyckoff patterns are widely used on crypto charts. Two cautions apply. Crypto trades around the clock across many exchanges, so volume on one exchange may not represent the whole market. Crypto spot markets are also less regulated, which makes wash trading a bigger risk to volume data. Use aggregated volume where possible and confirm key events with order flow on the exchange you trade.
Does smart money manipulate stock prices?
Large traders move price because of their size, and they work to limit their market impact. That is legal and routine. Manipulation, such as spoofing or wash trading, is illegal in regulated markets. A Wyckoff pattern on a chart cannot show which of the two is happening, so it should be treated as an interpretation and checked against order flow.
How is Wyckoff distribution different from accumulation?
They are mirror images. Accumulation forms after a downtrend, with large buyers absorbing supply, and leads to markup. Distribution forms after an uptrend, with large sellers absorbing demand, and leads to markdown. The spring in accumulation and the upthrust in distribution are the matching false breaks.
Sign Up Now
Latest Articles